


Abstract
Although photochemically produced organic hazes are common in planetary atmospheres, there have been few experimental investigations of the gas-phase chemistry leading to organic haze formation. We report a laboratory study of the gas-phase compounds formed by far-ultraviolet irradiation of a CH4/N2 mixture. Using high-resolution chemical ionization mass spectrometry (CIMS) we made in situ measurements of gas-phase products up to m/z 400. Organic nitrogen species dominate the mass spectra with smaller contributions from unsaturated hydrocarbons. Using a structural group method to estimate vapor pressures, we calculate that for compounds detected at m/z > 320, ≥50% of the total compound loading (gas + condensed phase) would be present in the condensed (aerosol) phase at 300 K. Using approximations for changes in vapor pressure with temperature, we estimate that ≥50% of the total loading for species with m/z > 110 would be in the aerosol-phase at 150 K, suggesting that the measured compounds may be important for aerosol composition for a range of temperatures. Finally, we leverage the sensitivity and fast time response of the CIMS measurements to investigate how the gas-phase chemistry evolved over the course of the experiment. This analysis shows that hydrocarbons were the initial products followed by the formation of unsaturated organic nitrogen compounds. Higher molecular weight species and alkylamines appear late in the experiment. Comparison of our measurements to chemical mechanisms used to model planetary haze formation suggests that larger molecular weight compounds need to be considered in haze formation chemistry.
Export citation and abstract BibTeX RIS
1. Introduction
Atmospheric hazes are common in our solar system and potentially present in exoplanetary atmospheres. While all types of haze can affect physical and chemical atmospheric processes, organic hazes are of specific interest as they are an abiotic source of complex organic molecules including those of potential prebiotic relevance (Hörst et al. 2012; Trainer 2013). Organic hazes in methane-rich N2 atmospheres are prevalent in our solar system, occurring on Titan (Smith et al. 1981), Triton (Krasnopolsky et al. 1993), and Pluto (Gladstone et al. 2016). As methane can have biotic and abiotic sources (Etiope & Sherwood Lollar 2013), methane-rich atmospheres may be common on terrestrial exoplanets.
Organic haze formation occurs via polymerization-like growth of small gas-phase compounds with the exact mechanism depending on atmospheric composition, temperature, pressure, and energy sources (e.g., Imanaka et al. 2004; Cable et al. 2012). Laboratory experiments have mainly focused on understanding the chemical and physical properties of haze particles (e.g., He et al. 2018; Hörst et al. 2018b; Sebree et al. 2018), with significantly less work on gas-phase chemistry. Past experiments of Titan-like (e.g., Imanaka & Smith 2010; Carrasco et al. 2012; Hörst et al. 2018c; Dubois et al. 2019) and exoplanetary (He et al. 2019) atmospheres targeted small gas-phase compounds with an emphasis on how product concentrations varied with precursor composition. There is a lack of in situ compositional measurements that provide insight into how the gas-phase composition evolves during haze formation. Furthermore, most work has investigated chemistry occurring in high-energy plasmas, leaving the photochemically produced gas-phase compounds less studied. As photochemistry is expected to be an important driver of haze formation under various atmospheric conditions (e.g., Hörst et al. 2018a), constraining the gas-phase chemistry is critical for understanding haze formation. Here, we used in situ chemical ionization mass spectrometry (CIMS) to probe how the gas-phase composition evolved during a photochemical CH4/N2 haze simulation experiment. We observed high molecular weight gas-phase compounds (m/z > 400) and found that the temporal evolution of the compounds provides key insights into haze formation.
2. Materials and Experimental Methods
2.1. Photochemical Reactor
The procedure and experimental design have been explained in detail previously (Trainer et al. 2012; Berry et al. 2019). A 2% CH4 in N2 mixture was prepared by mixing CH4 (Airgas, 99.99%) and N2 (Airgas, 99.998%) in a stainless-steel mixing chamber for at least 8 hr. A mass flow controller (Mykrolis FC-2900) continuously flowed the mixture at 100 standard cm3 per min into a stainless-steel reaction cell (∼300 cm3). One side of the cell interfaced to a deuterium lamp (Hamamastsu, L1825) that emitted in the range relevant for CH4 photolysis without any predicted N2 photolysis. After the cell, 2 standard liters per min (slpm) of N2 was added as a dilution flow and the chemical composition of the gas-phase sample was analyzed in real time with a high-resolution atmospheric pressure interface time-of-flight chemical ionization mass spectrometer (CIMS). Teflon (FEP) sample lines were used following the dilution flow addition to maximize the transmission of gas-phase compounds. Experiments were performed at ambient temperature and pressure (∼840 mbar and ∼300 K).
2.2. CIMS
A CIMS (Aerodyne Research, Inc. and Tofwerk AG; Berry et al. 2018) measured how the chemical composition of gas-phase compounds evolved during the haze formation experiment. Gas-phase neutral compounds were softly ionized using protonated ethanol-cluster reagent ions. The reagent ions were formed by flowing 1 slpm of a 0.1% ethanol in N2 through a Po-210 ionizer (NRD, model 2021) and introduced into the ion-molecule reaction chamber orthogonally to the 1.7 slpm analyte flow. Neutral analytes were ionized through proton transfer (R1) or ligand exchange (R2):

where n = 1, 2, and 3 (Nowak et al. 2002; Yu & Lee 2012; You et al. 2014; Berry et al. 2018). In the following analysis, we only consider CxHy and CxHyNw compounds as most CxHyOz and CxHyNwOz are expected to be ethanol ion-adducts from R2. Oxygen containing ions may originate from contaminates (i.e., adsorbed H2O). We expect such ions to be minor contributors to the overall signal; our previous work investigating the composition of ambient ions found that two contaminate ions, most likely water-clusters, contributed ∼0.1% to the total ion signal (Berry et al. 2019). Inclusion of CxHyOz and CxHyNwOz does not significantly change our results.
Mass spectra were collected from m/z 1–962 at 1 s resolution with mass resolving power of ∼8000 m/z/(Δm/z) and mass accuracy of <5 ppm for mass calibration peaks. Post-processing was done with Tofware (Version 2.5.11, Aerodyne Research Inc. and Tofwerk AG) in Igor Pro 64 bit 7.0.8.1 (Wavemetrics). To correct for sensitivity variations from changes in reagent ion abundance, all ions were normalized to the sum signal of the (C2H5OH)nH+ (n = 1−3) reagent ions. No corrections for the mass-dependent ion transmission efficiency or duty cycle were applied (Heinritzi et al. 2016).
2.3. Hierarchical Clustering Analysis
Timeseries for high-resolution ions were exported into MATLAB (R2018b; Mathworks) for analysis with the built-in hierarchical cluster analysis (HCA) functions. HCA is an agglomerative bottom-up algorithm; Euclidean distances are used to determine the similarities between objects and then are used to iteratively combine the most similar objects into new clusters through Ward's linkage (Lee & Yang 2010; Koss et al. 2019). In this study, each object was a timeseries of an individual ion. Thus, HCA groups ions with similar temporal evolution across the experiment into a cluster. Each individual ion is a member of only one cluster.
Only ions with sufficient signal-to-noise ratios (S/N ≥ 4) were included in HCA (Appendix Table 1). In fully constrained high-resolution peak fitting, low-intensity ions adjacent to high-intensity ions can have large errors (Cubison & Jimenez 2015). In order to reduce related precision errors, only ions exhibiting <20% change in intensity upon a 10 ppm mass calibration shift were included. All ion timeseries were background corrected. In order to focus on the photochemistry occurring during haze formation, only the lamp on period and the two previous minutes were included in HCA. We analyzed the three-cluster result because it gave physically meaningful data; additional clusters provided no further interpretable information. Including longer timeseries or more clusters gave similar results.
3. Results and Discussion
3.1. Neutral Composition in Titan-like Atmospheres
Far-ultraviolet (FUV) light irradiation of CH4/N2 produced a complex mixture of gas-phase species including high molecular weight products detected out to m/z 400 (Figure 1). While ethanol CIMS is selective for high-proton-affinity compounds and only gives a partial view of the total composition, a comparison to past measurements of the bulk composition, as discussed below, suggests that the CIMS measurements broadly represent the overall composition. High-resolution analysis of the mass spectra below m/z 215 showed that CxHyNw (w = 1−3) compounds were the most intense signals and accounted for 96% of the total CxHyNw (w = 0−3) signal (Figure 1). While CxHyN1 compounds accounted for 68.7%, multiple-nitrogen species were significant where CxHyN2 and CxHyN3 compounds contributed to 19.8% and 7.5% of the signal, respectively. The detected CxHyNw (w = 1−3) compounds spanned a range of unsaturation values (double bond equivalencies (DBE) = 0−5). DBE is calculated as

where x, y, and w correspond to the subscripts in CxHyNw formulas. Although ethanol CIMS has a low sensitivity toward hydrocarbon compounds, several larger hydrocarbons with up to 15 carbons were detected (DBE ≤ 7).

Figure 1. Average, unit-mass resolution, background corrected mass spectra from the last 15 minutes of the lamp on period. Signals from isobaric ions are stacked on top of each other. The background shading represents compounds that would have ≥50% of their total loading in the aerosol-phase due to absorptive partitioning at 300 K (dark gray) and 150 K (light gray).
Download figure:
Standard image High-resolution imageAbove m/z 215, numerous isobaric ions were observed thus precluding ion identification. However, we expect this composition to be chemically similar to the low-mass region because of the regular spacing of the unit-mass spectra with intense peaks separated by m/z 14, a feature that is consistent with compounds related by methylene groups. Based on the nitrogen rule and the intense signals at even masses, we expect that CxHyN1 compounds were important at m/z > 215.
Although the FUV light used in this work is not energetic enough to ionize or dissociate N2, past work has repeatedly shown nitrogen incorporation into organic molecules (Sebree et al. 2018; Berry et al. 2019 and references therein). Possible mechanisms for nitrogen incorporation have been discussed (Trainer et al. 2012; Yoon et al. 2014; Berry et al. 2019); however, the mechanism ultimately remains uncertain.
Previous measurements in the same system of small gas-phase compounds by Hörst et al. (2018c) were generally consistent with the results here. Somewhat surprisingly given the unknown nitrogen incorporation mechanism and that the temperature/pressure conditions differ from Titan, Hörst et al. (2018c) measured concentrations of small gas-phase species that are consistent with concentrations in Titan's stratosphere. While quantification of the gas-phase compounds in the present work was unfeasible given the lack of available calibration standards, the previous results suggest that our detected neutrals are also relevant to Titan's stratosphere.
Compared to the previous work (Hörst et al. 2018c), the higher resolving power of the CIMS used here allows for improved identification, including protonated CxHyN2 compounds at odd m/z ratios that were previously attributed solely to protonated CxHy compounds. Compounds with multiple nitrogens are of interest because they provide insight into the haze formation chemistry. Nitrile polymerization has been proposed as a haze formation pathway (Imanaka et al. 2004; Lavvas et al. 2008a; Pernot et al. 2010; He & Smith 2014a, 2014b) and Gautier et al. (2011) previously measured small gas-phase CxHyN2 compounds, specifically dinitriles, in Titan simulation experiments. While differences in experimental conditions and the CIMS' low sensitivity to nitriles prevent a direct comparison to Gautier et al. (2011), it is interesting to note that the majority of the CxHyN2 compounds identified here were too saturated to be dinitriles. This suggests that a haze formation pathway other than nitrile polymerization, but still involving nitrogen compounds, was more active in this study.
We unambiguously detected both methanimine and ammonia, compounds not identified by Hörst et al. (2018c) likely because of high background and interfering ions. Methanimine and ammonia are of prebiotic interest because they represent forms of nitrogen more available for incorporation into prebiotic molecules than triply bonded nitrogen. Additionally, methanimine has been suggested to lead to polymerization of organic molecules (Balucani et al. 2009, 2010; Carrasco et al. 2012) and thus contribute to aerosol formation (Imanaka et al. 2004; Redondo et al. 2006; He et al. 2012; He & Smith 2014a, 2014b). The two pathways to form methanimine discussed in Carrasco et al. (2012) are unlikely to occur in these experiments. The radical pathway (R3)

is unlikely as N(2D), only produced by galactic cosmic rays (GCRs) in this study, is not expected to be formed in significant concentrations (Berry et al. 2019). The ion pathway to form protonated methanimine (R4)

is also unlikely as  is formed through reactions of
  and N+, similarly only formed by GCRs, a minor source in this study. Methanimine formation could occur via the chemistry proposed in Redondo et al. (2006):

or Bocherel et al. (1996):

However, both of these reactions require the prior formation of reactive nitrogen, the source of which is unclear in these experiments.
3.2. The Influence of the Gas-phase on Aerosol-phase Composition
If we assume that absorptive partitioning controlled the distribution of semi-volatile compounds between the gas- and aerosol-phases, we can estimate the fraction of compounds in the aerosol-phase and compare our gas-phase results to previous measurements of bulk aerosol composition. We calculated gas-aerosol absorptive partitioning using the identified chemical formulas and the SIMPOL.1 method (Pankow & Asher 2008) to estimate vapor pressures (Pvap; Appendix Table 1). We assumed all nitrogen compounds are tertiary amines and units of unsaturation are carbon–carbon double bonds. With estimated Pvap, we calculated the effective saturation concentration ( ) for an individual compound, which is defined as

where  is the concentration of the compound in the gas-phase,
  is the concentration of the compound in the aerosol-phase, and CPOM is the total particulate organic matter (POM) concentration (Donahue et al. 2006; Epstein et al. 2010). The fraction of the total loading that is present in the aerosol-phase is found by

A compound will be present at equal concentrations in the gas- and aerosol-phases (Fp = 50%) when its  is equal to CPOM.
  is calculated from Pvap by

where R is the ideal gas constant, T is temperature, M is mean molecular weight of POM, and γ is the activity coefficient in the organic phase. M and γ were assumed to be 300 g mol−1 and 1, respectively (Donahue et al. 2012).
Previous work reports a mass loading ( ) of 10 μg m−3 within the cell under the same experimental conditions (Hörst & Tolbert 2013). With this loading, a compound would need to have a C* ≥ 10 μg m−3 (i.e., Pvap ≤ 8.2 × 10⁻¹⁰ atm) for ≥50% of its total loading to be present in the particle phase (Fp ≥ 50%). Of the detected CxHyNw (w = 0−3) compounds in this study, the lowest C* was ∼104 μg m−3 and thus the compounds existed entirely in the gas-phase. Calculated C* reached ∼10 μg m−3 for species with heavy atom (carbon + nitrogen) numbers of 23–25, dependent on the number of nitrogens and DBE. This corresponds to the m/z range of 320 to 350, where there still existed an appreciable signal (Figure 1).
The chemical composition of the aerosol generated with this experimental set-up has been extensively investigated (Hörst et al. 2018c and references therein). Cable et al. (2014) identified primary amines with = ≤24 carbons, although these species only accounted for 0.1% by weight of the aerosols. Measurements of bulk aerosol composition reported elemental ratios of H/C = ∼2.0 and N/C = ∼0.2–0.3 (Trainer et al. 2012; Hörst et al. 2018c). Our identified gas-phase species (m/z < 215) show similar average signal-weighted elemental ratios of H/C = 2.2 and N/C = 0.22. These gas-phase species predominately have one nitrogen and seven carbons. Because a compound must have 23–25 heavy atoms for at least half of the total loading to exist in the aerosol-phase ( ), the agreement in elemental ratios between the aerosol- and gas-phase measurements implies that compounds in aerosols have four to five nitrogens.
3.3. Temporal Separation of Compounds with HCA
In addition to steady-state composition analysis (Section 3.1), we leveraged the fast in situ measurement capability of CIMS. Analyzing the measurements with HCA allowed us to probe how the chemistry evolved as the system approached steady-state. For HCA input, we used 140 ions that passed filtering criteria related to S/N and precision fitting errors. We identified three clusters with distinctly different temporal trends (Figure 2) and chemical composition (Figure 3). The differences in the temporal trends when the FUV lamp is turned on compared to off indicates that absorptive/adsorptive partitioning to the cell and tubing (Pagonis et al. 2017) cannot explain the different cluster signal growth rates. This suggests that the temporal analysis provides insight into multi-generational chemistry and the haze formation mechanism.
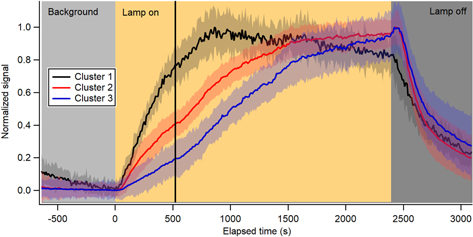
Figure 2. Normalized timeseries of the three HCA clusters. The shading around each timeseries is one standard deviation of the average. The signals continue to grow beyond three times the residence time after the start of radiation (black line at 520 s), showing that chemistry is occurring.
Download figure:
Standard image High-resolution image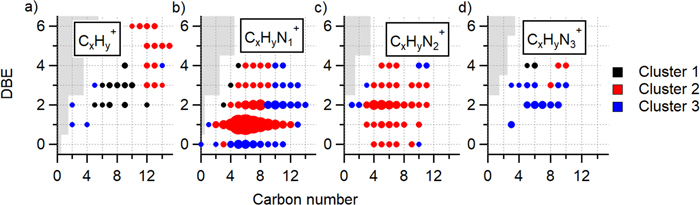
Figure 3. Compounds that make up the three HCA clusters shown as DBE versus carbon number. For clarity, species are separated into different panels according to the number of nitrogen atoms for (a)–(d) CxHyN0–3 compounds. In this format, each point represents a unique molecular formula, which can be determined with Equation (1). Each compound is colored by its cluster number and sized by its average signal intensity. The gray portions show chemical formulas that are non-physical molecular formulas.
Download figure:
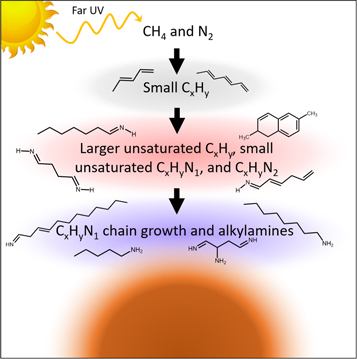
Standard image High-resolution imageThe HCA results suggest a general mechanism for the gas-phase chemistry leading to aerosol formation and growth (Figure 4). Cluster 1 (black), composed mostly of C5–12Hy hydrocarbons (DBE = 2−4), was the first to grow in and reach maximum intensity. Ethanol CIMS has low sensitivity to hydrocarbons due to their low proton affinity, and thus these compounds are expected to be underrepresented by this technique. The second cluster to appear (cluster 2; red) included larger, unsaturated hydrocarbons (C10 − 15Hy, DBE = 3−6), most of the observed CxHyN1 (DBE = 1) compounds, small CxHyN1 compounds (x = 4−9, DBE = 2−4), and most of the CxHyN2 compounds. The last cluster to grow in (cluster 3; blue) contained alkylamine (DBE = 0) compounds, higher mass unsaturated CxHyN1 compounds, and the CxHyN3 compounds. Overall, the HCA results showed that hydrocarbons are the main early generation products formed during the photolysis of methane in nitrogen. More heavy atoms are added in later-generation products and alkylamines are one of the last compound classes to form (Figure 4).
Figure 4. Temporal evolution of chemical composition analyzed with HCA suggests that small unsaturated hydrocarbons are formed first. Unsaturated organic nitrogen compounds form next. The last group of compounds to form are alkylamines and large, unsaturated organic nitrogen compounds.
Download figure:
Standard image High-resolution image
With Cluster 1 containing mainly hydrocarbons, this hints that larger, unsaturated hydrocarbon compounds may play a role in nitrogen incorporation. Li et al. (2013) reported nucleophilic addition of N2 to aryl cations, forming activated nitrogen and organic nitrogen compounds. Additional photochemistry would be required to produce the small molecules such as NH3 and methanimine observed here. It is unlikely that the exact reaction proposed by Li et al. (2013) was active in our experiments as aryl cations were not detected in our previous ambient ion work (Berry et al. 2019). Another possibility for nitrogen incorporation that first requires hydrocarbon growth is the reaction of N(2D) with small organic molecules (Balucani et al. 2009, 2012). The formation of N(2D) from the direct photolysis or predissociation of N2 in our cell is unlikely, but N(2D) can be formed by GCRs. However, as discussed by Berry et al. (2019), GCRs cannot account for the magnitude of observed nitrogen incorporation in the system. It is also possible that hydrocarbon growth may not be required for nitrogen activation. The kinetics of nitrogen activation may simply be slower than those of hydrocarbon growth, thus explaining the presence of hydrocarbons in Cluster 1 and organic nitrogen in later-forming clusters.
3.4. Implications for Haze Formation in Planetary Atmospheres
Haze formation is typically assumed to occur via polymerization or copolymerization of nitriles, polyynes, imines, and/or aromatic molecules. Pure hydrocarbon pathways are inconsistent with our H/C and N/C values. For example, polyyne polymerization would lead to H/C values <1, where we measure H/C = 2.2. Our N/C = 0.22 suggests a nitrogen-compound polymerization, yet not purely (HCN)x or (CH2NH)x pathways that would result in N/C closer to 1. The observed N/C value suggests that copolymerization between small hydrocarbons and organic nitrogen compounds is more likely. Copolymerization has been modeled to be important in Titan's haze formation (Lavvas et al. 2008b). Additionally, the similarities between the aerosol- and gas-phase elemental ratios suggest aerosol compounds with five to six nitrogens and 23–25 heavy atoms, indicative of growth through polymerization with nitrogen-containing species.
Given the complexity of haze formation, models typically only track small gas-phase compounds, sometimes only out to C4–6 (Pavlov et al. 2001; Lavvas et al. 2008a; Arney et al. 2016). Our work finds that heavy atom numbers of 23–25 are required for substantial aerosol partitioning at 300 K, suggesting that larger molecular weight compounds should be considered. Even if we adjust C* using heat of vaporization approximations (Epstein et al. 2010) to Titan-like conditions of 150 K and an aerosol mass loading ∼1 μg m−3, a compound must have ∼eight heavy atoms (m/z ∼ 110) for at least half of the total loading to exist in the aerosol-phase. We note that this reduction in temperature would alter gas-phase chemistry. Still, for a wide temperature range, it is likely that models are missing higher molecular weight compounds that are key to aerosol growth. Fully explicit mechanisms out to ∼eight heavy atom molecules are impractical due to a lack of experimental constraints and from a computational standpoint, but lumping of compounds into a reduced complexity mechanism may be warranted. Lumping is common with atmospheric chemical mechanisms representing present-day Earth. Without including the chemistry of these large species, exoplanetary models may poorly represent the carbon and nitrogen budgets as well as aerosol formation and growth.
In our partitioning calculations, we have assumed that aerosol growth occurs via absorptive partitioning. Heterogeneous reactions are a possible growth pathway that is not considered here. While there are limited investigations of heterogeneous chemistry, past work has generally found that heterogeneous reactions may be important for organic chemistry and growth of aerosols (Sekine et al. 2008; Hong et al. 2018). Further experimental investigations into the role of heterogeneous chemistry is needed to properly account for it in laboratory experiments and models of exoplanetary atmospheres.
4. Conclusions
Gas-phase chemistry plays a fundamental role in determining haze formation and growth. With CIMS, we investigated the gas-phase chemistry leading to organic haze formation during the FUV photolysis of CH4 in N2. We detected compounds out to m/z 400, with large signals from organic nitrogen compounds. Using the SIMPOL.1 method, we estimated vapor pressures for the measured compounds and found that compounds with m/z > 320 would have ≥50% of their total loading in the aerosol-phase at 300 K. Through HCA, we found that hydrocarbons were the first products formed, followed by the incorporation of nitrogen into compounds with DBE ≥ 1 and that with time carbon numbers increased. Alkylamines were one of the last organic nitrogen compounds to be formed. Similarities between the elemental ratios of the gas-phase compounds and of bulk aerosol composition suggest that the observed chemistry continues as compounds grow large enough to partition onto aerosols. Our results show that models using small species with heavy atom numbers less than eight for haze formation may insufficiently account for aerosol partitioning at a wide range of temperatures, leading to inaccuracies in the carbon and nitrogen budgets of exoplanetary atmospheres.
J.L.B. and E.C.B. acknowledge start-up funds from the University of Colorado Boulder Department of Chemistry and Cooperative Institute for Research in Environmental Sciences. J.L.B acknowledges support from the CU Boulder Summer Departmental Fellowship and the CIRES Graduate Student Research Award. M.S.U acknowledges a NASA Earth and Space Science Fellowship NNX14AO32H.
Appendix
The identified cations from CIMS that were used in HCA with the vapor pressures calculated with the SIMPOL.1 method at 300 K and CPOM of 10 μg m−3 are given in Table 1.
Table 1. Exact Mass, Signal Intensity, and Calculated Vapor Pressure of Identified Ions
| Identified formula | Exact Mass (m/z) | Signal (ions/s) | Vapor Pressure (atm) | Identified Formula | Exact Mass (m/z) | Signal (ions/s) | Vapor Pressure (atm) | |
|---|---|---|---|---|---|---|---|---|
| H4N+ | 18.0338 | 3.8E+01 | 5.8E+00 | C3H9N2+ | 73.0760 | 1.7E+02 | 2.0E−02 | |
C2
|
27.0229 | 2.0E+01 | 5.1E+00 | C4H12N+ | 74.0964 | 1.5E+03 | 1.0E−01 | |

|
29.0134 | 1.0E+02 | N/A | C5H6N+ | 80.0495 | 1.4E+02 | 1.4E−02 | |
C2
|
29.0386 | 6.2E+01 | 6.4E+00 | C6
|
81.0699 | 4.9E+01 | 7.0E−02 | |
| CH4N+ | 30.0338 | 4.5E+01 | 1.6E+00 | C5H8N+ | 82.0651 | 2.4E+02 | 1.8E−02 | |
CH3
|
43.0291 | 1.7E+02 | 1.2E−01 | C4H7
|
83.0604 | 4.3E+02 | 4.6E−03 | |
| C2H6N+ | 44.0495 | 1.3E+03 | 6.0E−01 | C6
|
83.0855 | 6.3E+01 | 9.0E−02 | |
| C2H8N+ | 46.0651 | 8.3E+01 | 7.7E−01 | C3H6
|
84.0556 | 5.2E+01 | 1.2E−03 | |

|
56.0117 | 2.5E+01 | 2.3E−03 | C5H10N+ | 84.0808 | 1.5E+03 | 2.3E−02 | |
| C3H6N+ | 56.0495 | 6.8E+01 | 1.7E−01 | C4H9
|
85.0760 | 3.7E+03 | 5.9E−03 | |

|
57.0196 | 3.6E+01 | 2.3E−03 | C5H12N+ | 86.0964 | 1.3E+04 | 2.9E−02 | |
C2H5
|
57.0447 | 4.7E+02 | 4.4E−02 | C4H11
|
87.0917 | 7.2E+02 | 7.5E−03 | |
C4
|
57.0699 | 1.4E+01 | 8.6E−01 | C3H10
|
88.0869 | 1.1E+03 | 1.9E−03 | |
| C3H8N+ | 58.0651 | 3.5E+03 | 2.2E−01 | C5H14N+ | 88.1121 | 2.9E+03 | 3.7E−02 | |
| C3H10N+ | 60.0808 | 4.5E+02 | 2.8E−01 | C4H13N2+ | 89.1073 | 2.3E+02 | 9.5E−03 | |
C5
|
67.0542 | 4.8E+00 | 1.9E−01 | C6H8N+ | 94.0651 | 2.7E+02 | 5.2E−03 | |
| C4H6N+ | 68.0495 | 5.4E+01 | 4.9E−02 | C5H7N2+ | 95.0604 | 1.6E+02 | 1.3E−03 | |
C3H5
|
69.0447 | 3.5E+01 | 1.3E−02 | C7
|
95.0855 | 3.5E+02 | 2.6E−02 | |
C5
|
69.0699 | 1.2E+01 | 2.5E−01 | C6H10N+ | 96.0808 | 5.0E+02 | 6.6E−03 | |
| C4H8N+ | 70.0651 | 3.5E+02 | 6.3E−02 | C5H9
|
97.0760 | 7.6E+02 | 1.7E−03 | |
C3H7
|
71.0604 | 1.6E+03 | 1.6E−02 | C7
|
97.1012 | 2.2E+02 | 3.3E−02 | |
| C4H10N+ | 72.0808 | 5.8E+03 | 8.0E−02 | C4H8
|
98.0713 | 9.3E+01 | 4.3E−04 | |
| C6H12N+ | 98.0964 | 2.9E+03 | 8.4E−03 | C6H12
|
126.1026 | 3.0E+02 | 5.7E−05 | |
| C5H11N2+ | 99.0917 | 3.8E+03 | 2.1E−03 | C8H16N+ | 126.1277 | 4.6E+03 | 1.1E−03 | |
| C6H14N+ | 100.1121 | 1.4E+04 | 1.1E−02 | C7H15
|
127.1230 | 2.3E+03 | 2.8E−04 | |
C5H13
|
101.1073 | 1.1E+03 | 2.7E−03 | C6H14
|
128.1182 | 2.3E+03 | 7.3E−05 | |
| C6H16N+ | 102.1277 | 3.2E+03 | 1.4E−02 | C8H18N+ | 128.1434 | 9.0E+03 | 1.4E−03 | |
C5H15
|
103.1230 | 5.8E+02 | 3.5E−03 | C7H17
|
129.1386 | 1.0E+03 | 3.6E−04 | |
| C7H10N+ | 108.0808 | 6.6E+02 | 1.9E−03 | C8H20N+ | 130.1590 | 1.5E+03 | 1.8E−03 | |
C6H9
|
109.0760 | 5.6E+02 | 4.8E−04 | C10
|
131.0855 | 1.5E+02 | 6.0E−04 | |
C8
|
109.1012 | 5.5E+02 | 9.4E−03 | C7H19
|
131.1543 | 5.5E+02 | 4.6E−04 | |
C5H8
|
110.0713 | 8.1E+01 | 1.2E−04 | C9H14N+ | 136.1121 | 7.1E+02 | 2.5E−04 | |
| C7H12N+ | 110.0964 | 6.9E+02 | 2.4E−03 | C10
|
137.1325 | 5.0E+02 | 1.2E−03 | |
| C6H11N2+ | 111.0917 | 9.5E+02 | 6.1E−04 | C9H16N+ | 138.1277 | 8.2E+02 | 3.2E−04 | |
C5H10
|
112.0869 | 1.6E+02 | 1.6E−04 | C9H18N+ | 140.1434 | 2.6E+03 | 4.1E−04 | |
| C7H14N+ | 112.1121 | 4.3E+03 | 3.0E−03 | C8H17
|
141.1386 | 1.5E+03 | 1.0E−04 | |
C6H13
|
113.1073 | 3.1E+03 | 7.8E−04 | C7H16
|
142.1339 | 2.2E+03 | 2.7E−05 | |
C5H12
|
114.1026 | 1.5E+03 | 2.0E−04 | C9H20N+ | 142.1590 | 5.9E+03 | 5.2E−04 | |
| C7H16N+ | 114.1277 | 1.2E+04 | 3.9E−03 | C8H19
|
143.1543 | 7.7E+02 | 1.3E−04 | |
| C6H15N2+ | 115.1230 | 1.2E+03 | 9.9E−04 | C9H22N+ | 144.1747 | 9.7E+02 | 6.6E−04 | |
| C7H18N+ | 116.1434 | 2.3E+03 | 4.9E−03 | C11
|
145.1012 | 1.9E+02 | 2.2E−04 | |
C6H17
|
117.1386 | 6.7E+02 | 1.3E−03 | C10H16N+ | 150.1277 | 5.2E+02 | 9.1E−05 | |
| C9H13+ | 121.1012 | 2.1E+02 | 2.7E−03 | C10H18N+ | 152.1434 | 7.1E+02 | 1.2E−04 | |
C6H8
|
122.0713 | 7.7E+01 | 3.5E−05 | C9H17
|
153.1386 | 8.3E+02 | 3.0E−05 | |
| C8H12N+ | 122.0964 | 7.9E+02 | 6.9E−04 | C8H16
|
154.1339 | 5.1E+02 | 7.6E−06 | |
| C7H11N2+ | 123.0917 | 7.8E+02 | 1.8E−04 | C10H20N+ | 154.1590 | 3.5E+03 | 1.5E−04 | |
C9
|
123.1168 | 5.6E+02 | 3.4E−03 | C9H19
|
155.1543 | 1.3E+03 | 3.8E−05 | |
C6H10
|
124.0869 | 3.1E+02 | 4.5E−05 | C8H18
|
156.1495 | 1.7E+03 | 9.7E−06 | |
| C8H14N+ | 124.1121 | 8.0E+02 | 8.7E−04 | C10H22N+ | 156.1747 | 3.9E+03 | 1.9E−04 | |
C7H13
|
125.1073 | 9.8E+02 | 2.2E−04 | C10H24N+ | 158.1903 | 5.6E+02 | 2.4E−04 | |
C9
|
125.1325 | 2.4E+02 | 4.3E−03 | C12
|
159.1168 | 2.5E+02 | 8.0E−05 | |
| C9H23N2+ | 159.1856 | 1.9E+02 | 6.1E−05 | C13
|
175.1481 | 6.1E+02 | 3.7E−05 | |
C12
|
161.1325 | 4.1E+02 | 1.0E−04 | C13
|
177.1638 | 2.5E+02 | 4.7E−05 | |
C12
|
163.1481 | 5.1E+02 | 1.3E−04 | C11H19
|
179.1543 | 3.7E+02 | 3.1E−06 | |
| C11H18N+ | 164.1434 | 4.0E+02 | 3.3E−05 | C13
|
179.1794 | 1.6E+02 | 6.0E−05 | |
C10H17
|
165.1386 | 4.8E+02 | 8.5E−06 | C10H18
|
180.1495 | 3.2E+02 | 7.9E−07 | |
C12
|
165.1638 | 2.7E+02 | 1.7E−04 | C12H22N+ | 180.1747 | 5.6E+02 | 1.5E−05 | |
C9H16
|
166.1339 | 3.2E+02 | 2.2E−06 | C11H21
|
181.1699 | 6.1E+02 | 4.0E−06 | |
| C11H20N+ | 166.1590 | 6.7E+02 | 4.2E−05 | C10H20
|
182.1652 | 4.8E+02 | 1.0E−06 | |
| C10H19N2+ | 167.1543 | 7.6E+02 | 1.1E−05 | C12H24N+ | 182.1903 | 1.8E+03 | 2.0E−05 | |
C12
|
167.1794 | 7.5E+01 | 2.1E−04 | C11H23
|
183.1856 | 6.7E+02 | 5.0E−06 | |
C9H18
|
168.1495 | 4.9E+02 | 2.8E−06 | C12H26N+ | 184.2060 | 1.5E+03 | 2.5E−05 | |
| C11H22N+ | 168.1747 | 2.6E+03 | 5.4E−05 | C14
|
189.1638 | 4.3E+02 | 1.4E−05 | |
| C10H21N2+ | 169.1699 | 9.8E+02 | 1.4E−05 | C14
|
191.1794 | 1.2E+02 | 1.7E−05 | |
C9H20
|
170.1652 | 1.2E+03 | 3.5E−06 | C14
|
193.1951 | 1.3E+02 | 2.2E−05 | |
| C11H24N+ | 170.1903 | 2.4E+03 | 6.9E−05 | C13H24N+ | 194.1903 | 4.6E+02 | 5.6E−06 | |
C10H23
|
171.1856 | 3.5E+02 | 1.8E−05 | C13H26N+ | 196.2060 | 1.2E+03 | 7.2E−06 | |
| C11H26N+ | 172.2060 | 4.1E+02 | 8.7E−05 | C13H28N+ | 198.2216 | 9.6E+02 | 9.1E−06 | |
C13
|
173.1325 | 3.6E+02 | 2.9E−05 | C15
|
203.1794 | 3.7E+02 | 5.0E−06 | |
| C10H25N2+ | 173.2012 | 8.0E+01 | 2.2E−05 | C14H28N+ | 210.2216 | 8.0E+02 | 2.6E−06 |