


Abstract
We present the first radio polarimetric observations of a fast-rising blue optical transient, AT2018cow. Two epochs of polarimetry with additional coincident photometry were performed with the Atacama Large Millimeter/submillimeter Array. The overall photometric results based on simultaneous observations in the 100 and 230 GHz bands are consistent with the nonthermal radiation model reported by Ho et al. and indicate that the spectral peaks (∼110 GHz at the first epoch and ∼67 GHz at the second epoch) represent the synchrotron self-absorption frequency. The non-detection of linear polarization with <0.15% in the 230 GHz band at the phase when the effect of synchrotron self-absorption was quite small in the band may be explained by internal Faraday depolarization with high circumburst density and strong magnetic field. This result supports the stellar explosion scenario rather than the tidal disruption model. The maximum energy of accelerating particles at the shocks of AT2018cow-like objects is also discussed.
Export citation and abstract BibTeX RIS

Original content from this work may be used under the terms of the Creative Commons Attribution 3.0 licence. Any further distribution of this work must maintain attribution to the author(s) and the title of the work, journal citation and DOI.
1. Introduction
A luminous transient, AT2018cow, was discovered near the galaxy CGCG 137−068 (z = 0.0141) at 2018 June 16 10:35:02 UT (Smartt et al. 2018). High luminosity in various wavelengths, featureless hot blackbody spectra, and long-lived radio emission revealed that AT2018cow is an unusual transient (Prentice et al. 2018; Rivera Sandoval et al. 2018; Ho et al. 2019; Kuin et al. 2019). Panchromatic approaches suggested the presence of the central engine of high-energy emission radiated through equatorial-polar asymmetric low-mass ejecta in a dense medium, and the progenitor of a low-mass H-rich star or blue supergiant star (Ho et al. 2019; Margutti et al. 2019; Soker et al. 2019). A scenario was also proposed in which a star disrupted by an intermediate black hole produced AT2018cow (Kuin et al. 2019; Perley et al. 2019). However, the large environment density concluded by Margutti et al. (2019) and Ho et al. (2019) made the tidal disruption scenario unlikely and indicated a stellar explosion hypothesis. The host galaxy observation with H i 21 cm mapping demonstrated that AT2018cow lies within an asymmetric ring of high column density, which indicates the formation of massive stars, supporting the stellar explosion scenario of AT2018cow (Roychowdhury et al. 2019). Lyutikov & Toonen (2018) built an electron-capture collapse model following a merger of white dwarfs, one of which is a massive ONeMg white dwarf.
Polarimetry may be another key to investigating the circumstances of stellar explosion objects, such as density, magnetic field, and turbulence. Moreover, the study of particle acceleration at shocks associated with the objects could be equally interesting. Using SN 1987A (Zanardo et al. 2018) and Kepler's supernova remnant (SNR; DeLaney et al. 2002) as examples, spatially resolved linear polarizations of radio synchrotron emissions were observed with local polarization degrees of ∼10%. The local polarization angles (PAs) of both objects imply a radially oriented magnetic field. The polarization degree for integrated Stokes parameters over all emission regions is a few percent. Such radial orientations and sizable polarization degrees are ubiquitously observed in young SNRs (such as the freely expanding phase to early Sedov phase, e.g., Milne 1987; Dickel et al. 1991 for Tycho's SNR; Reynoso et al. 2013 for SN 1006) and could be explained by magnetohydrodynamic turbulence resulting from the interaction between the shock wave and density fluctuations pre-existing in the upstream medium (i.e., stellar wind and/or interstellar medium, Inoue et al. 2013). As for the early stages of radio supernovae, however, the density and magnetic field strength in the shocked region can be so high that the Faraday rotation effect is strong. Then the emissions from different parts in the shocked region have different PAs, which lead to suppression of the net linear polarization, i.e., the internal Faraday depolarization. The non-detection of linear polarization at 1.7–8.4 GHz in SN 1993J is explained by this effect (Bietenholz et al. 2003).
In this Letter, we report the radio polarimetry of AT2018cow using the Atacama Large Millimeter/submillimeter Array (ALMA) in the 100 and 230 GHz bands. In this millimeter wavelength range, the Faraday effect is weaker than the centimeter radio band. Based on two epochs of ALMA observations, the scenarios of a progenitor accompanied by a dense circumstellar medium are examined. MJD 58285 (2018 June 16 00:00:00 UT) is used as T0, which is between the last non-detection (MJD 58284.13) and the date of discovery (MJD 58285.441). The date is the same T0 used in Perley et al. (2019) and Ho et al. (2019).
2. Observations
Two epochs of ALMA observations were executed as part of Director's Discretionary Time during Cycle 5 (2017.A.00046.T; PI: K. Huang) using both the 12 m antenna array and Atacama Compact Array (ACA). The first epoch of radio linear polarimetry was performed at 97.5 GHz (i.e., Band 3) starting at 2018 June 27 01:04 UT (midpoint T0 = 11.1 days, here after epoch1). Coincident 230 GHz band (i.e., Band6) observations were also performed with the ACA. Because our quick-look photometry using the ACA data exhibited the brightness sufficient for polarimetry and positive power-law index by fitting with fν ∝ νβ, we decided to switch the frequency from Band 3 to Band 6 to perform polarimetry above the spectral peak. Hence, the second epoch of polarimetry was executed at the 230 GHz band using the 12 m antenna array on 2018 July 3 UT (midpoint T0 = 17.1 days, here after epoch 2). The coincident photometry at 97.5 GHz was also performed using the ACA. For the 12 m antenna array, the bandpass and flux were calibrated using observations of J1550+0527, and J1606+1814 was used for the phase calibration. Polarization calibration was performed by observations of J1642+3948. Regarding ACA observations, J1337−1257 and J1517−2422 were utilized for the bandpass and flux calibrations. The phase calibrations were performed using observations of J1540+1447, J1613+3412, and J1619+2247.
3. Analysis and Results
The raw data of ALMA were reduced at the East Asian ALMA Regional Center using CASA (version 5.1.1; McMullin et al. 2007). We further performed interactive CLEAN deconvolution imaging (Högbom 1974; Clark 1980) with self-calibration for the data obtained by the 12 m antenna array. The Stokes I, Q, and U maps were CLEANed with an appropriate number of CLEAN iterations after the final round of self-calibration. The results of photometry and polarimetry are summarized in Table 1. Regarding polarimetry, the 3σ upper limits were derived based on the non-detections in Q and U maps. Because the depolarization between the source and observation site is negligible for the point source (i.e., transients) in this millimeter band (Brentjens & de Bruyn 2005), the values of <0.10% in the 97.5 GHz band and <0.15% in the 233 GHz band describe the intrinsic origin.
Table 1. ALMA Observing Log
| Epoch 1: 2018 Jun 27 01:04–04:43, T0 = 11.1 Days (Midpoint) | |||||||
| Instruments | Spectral Window (SPW) | Band (GHz) | Pol. (%) | PA (deg) | I flux (mJy) | Q flux (mJy) | U flux (mJy) |
| 12 m | 0, 1, 2, 3 | 97.5 | <0.10 | ⋯ | 39.629 ± 0.046 | 0.010 (rms) | 0.010 (rms) |
| 0 | 90.5 | <0.18 | ⋯ | 36.886 ± 0.029 | 0.016 (rms) | 0.014 (rms) | |
| 1 | 92.5 | <0.17 | ⋯ | 37.823 ± 0.029 | 0.016 (rms) | 0.015 (rms) | |
| 2 | 102.5 | <0.15 | ⋯ | 42.243 ± 0.030 | 0.015 (rms) | 0.015 (rms) | |
| 3 | 104.5 | <0.17 | ⋯ | 43.087 ± 0.036 | 0.017 (rms) | 0.017 (rms) | |
| Epoch 1: 2018 Jun 27 01:00–04:05, T0 = 11.1 Days (Midpoint) | |||||||
| Instruments | SPW | Band (GHz) | Pol. (%) | PA (deg) | I flux (mJy) | Q flux (mJy) | U flux (mJy) |
| ACA | 4, 6, 16, 18 | 233.0 | ⋯ | ⋯ | 35.49 ± 0.48 | ⋯ | ⋯ |
| 4 | 224.0 | ⋯ | ⋯ | 36.47 ± 0.57 | ⋯ | ⋯ | |
| 6 | 226.0 | ⋯ | ⋯ | 36.51 ± 0.37 | ⋯ | ⋯ | |
| 16 | 240.0 | ⋯ | ⋯ | 33.57 ± 0.49 | ⋯ | ⋯ | |
| 18 | 242.0 | ⋯ | ⋯ | 33.88 ± 0.47 | ⋯ | ⋯ | |
| Epoch 2: 2018 Jul 3 00:39–02:06, T0 = 17.1 Days (Midpoint) | |||||||
| Instruments | SPW | Band (GHz) | Pol. (%) | PA (deg) | I flux (mJy) | Q flux (mJy) | U flux (mJy) |
| ACA | 4, 6, 8, 10 | 97.5 | ⋯ | ⋯ | 68.18 ± 0.44 | ⋯ | ⋯ |
| 4 | 90.5 | ⋯ | ⋯ | 64.74 ± 0.31 | ⋯ | ⋯ | |
| 6 | 92.4 | ⋯ | ⋯ | 64.93 ± 0.37 | ⋯ | ⋯ | |
| 8 | 102.5 | ⋯ | ⋯ | 68.66 ± 0.45 | ⋯ | ⋯ | |
| 10 | 104.5 | ⋯ | ⋯ | 68.47 ± 0.53 | ⋯ | ⋯ | |
| Epoch 2: 2018 Jul 3 00:43–04:05, T0 = 17.1 Days (Midpoint) | |||||||
| Instruments | SPW | Band (GHz) | Pol. (%) | PA (deg) | I flux (mJy) | Q flux (mJy) | U flux (mJy) |
| 12 m | 0, 1, 2, 3 | 232.9 | <0.15 | ⋯ | 48.755 ± 0.047 | 0.016 (rms) | 0.018 (rms) |
| 0 | 224.0 | <0.23 | ⋯ | 50.186 ± 0.052 | 0.025 (rms) | 0.028 (rms) | |
| 1 | 226.0 | <0.22 | ⋯ | 49.975 ± 0.046 | 0.026 (rms) | 0.025 (rms) | |
| 2 | 240.0 | <0.25 | ⋯ | 48.023 ± 0.050 | 0.027 (rms) | 0.029 (rms) | |
| 3 | 242.0 | <0.31 | ⋯ | 45.348 ± 0.086 | 0.033 (rms) | 0.033 (rms) | |
Download table as: ASCIITypeset image
To describe the phase of the polarization observation, the photometric measurements in the entire Band6 frequency range were plotted, together with the 230 GHz monitoring data (Ho et al. 2019). As shown in Figure 1, the ∼230 GHz light curves indicate that our polarimetric measurements were performed around the brightest plateau phase with significant variabilities.

Figure 1. AT2018cow light curve in the submillimeter band (∼230 GHz). The red box points indicate the photometric results of the ALMA, and the blue circle points show the monitoring results reported by Ho et al. (2019).
Download figure:
Standard image High-resolution imageThe photometric measurements in each of the spectral windows of Band 3 and Band 6 were fitted with a simple power-law function (i.e., fν ∝ νβ). These fittings yield βE1B3 = 1.080 ± 0.007 (χ2/ndf = 1.39 with number of degree of freedom, ndf = 2) for epoch 1 with Band 3, βE1B6 = −1.15 ± 0.16 (χ2/ndf = 0.62 with ndf = 2) for epoch 1 with Band 6, βE2B3 = 0.44 ± 0.05 (χ2/ndf = 1.00 with ndf = 2) for epoch 2 with Band 3, and βE2B6 = −0.86 ± 0.29 (χ2/ndf = 280 with ndf = 2) for epoch 2 with Band 6. Large scatter were observed at 242 GHz (i.e., the highest frequency in Band 6) for epoch 2, which may be related to the significant variabilities as shown in Figure 1. The same fitting was therefore performed by excluding the data, and βE2B6 = −0.65 ± 0.02 (χ2/ndf = 1.25 with ndf = 1) was obtained. As shown in Figure 2, the fitting basically describes the spectral energy distribution (SED) and indicates that the spectral peak frequency, νp is located at ∼140 GHz. Hence, the polarimetric measurements on epoch 1 and epoch 2 were performed below and above the spectral peak, respectively.

Figure 2. SED and polarization using ALMA Band 3 and Band 6 data taken at 11.1 (blue circle points and arrow) and 17.1 (red box points and arrow) days. The blue and red dotted lines indicate the best fitted simple power-law functions.
Download figure:
Standard image High-resolution image4. Discussion
4.1. Spectral Flux Distribution
The observed radio light curves and time-resolved spectra of AT2018cow may be interpreted as the synchrotron emission of relativistic nonthermal electrons produced at an adiabatic strong shock that freely expands in an ionized medium at a non-relativistic speed (Ho et al. 2019; Margutti et al. 2019). This emission model is widely applicable for radio supernovae (Chevalier 1998). Considering the smooth connection of two power-law spectra, the temporal evolution of the spectral indices in Band 3 may be consistent with the spectral modeling presented by Ho et al. (2019). The smooth broken power-law fitting was performed, including ATCA data taken at the similar epochs (Δt = −0.6 day for epoch 1 and Δt = 0.4 day for epoch 2 (Ho et al. 2019)). The smooth fitting with wider spectral frequency coverage is also reasonable to characterize the spectral peak frequency as the method is applied for various analyses such as gamma-ray burst prompt emissions (e.g., Band et al. 1993). Because the significant variabilities were observed (Figure 1), we excluded the data taken by the Submillimeter Array (SMA). For this fitting, the spectral index of the lower-frequency side was fixed as βlow = 2.5 (reported by Ho et al. 2019), and the higher-frequency side was fixed as βhigh = −1.15 for epoch1 and βhigh = −0.86 for epoch 2. The fitting yields the spectral peak frequency, νp = 109.8 ± 0.5 GHz (χ2/ndf = 7.3 with ndf = 7) at epoch 1 and νp = 67.4 ± 1.6 GHz (χ2/ndf = 7.6 with ndf = 6) at epoch 2.14 The larger reduced χ2 may be caused by the epoch differences. As show in Figure 3, the best-fit functions basically describe the SED. The temporal evolution of the spectral peak frequency is also characterized as νp ∝ t−1.1, which is consistent with that of the theoretical model for the synchrotron self-absorption frequency (Chevalier 1998). Therefore, we concluded that the spectral peak frequency represents the synchrotron self-absorption frequency, and the effect of self-absorption, is quite small for the polarization measurement with in the 233 GHz band at epoch 2.

Figure 3. SED of the AT2018cow at 11.1 days (i.e., epoch 1, left) and 17.1 days (i.e., epoch 2, right) using ALMA with the ATCA data taken by Ho et al. (2019). Time differences of ATCA observations were Δt = −0.6 day for epoch 1 and Δt = 0.4 day for epoch 2, respectively. The dashed lines indicate the best fit smoothly connected broken power-law functions with the spectral peak frequencies of ∼110 GHz at epoch 1 and ∼67 GHz at epoch 2.
Download figure:
Standard image High-resolution image
For further discussion in Section 4.2, the theoretical analysis of Ho et al. (2019) is followed for the estimated values of the radius of the shock, magnetic field strength in the shocked region, shock speed, and number density of the shocked region at T ≃ 22 days as
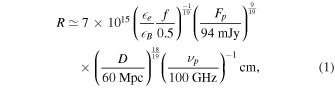
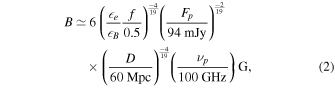
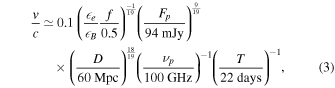
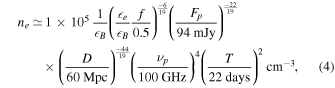
where  e and B are the fractions of thermal energy at the shocked region that are carried by the nonthermal electrons and the magnetic field, respectively, and f is the filling factor of the emission region in the sphere with radius R.
4.2. Polarization
As introduced in Section 1, the polarization degree of AT2018cow without the Faraday effect is expected to be a few percent, which is similar to other stellar explosions.15 The non-detection of linear polarization (especially <0.15% in the 233 GHz band at epoch2) in AT2018cow may be explained by internal Faraday depolarization, because ne and B are so high. The result supports the stellar explosion scenario rather than the tidal disruption scenario.16
In this scenario, we can derive a lower limit of the coherence length of the turbulent magnetic field in the shocked region. Supposing that the turbulent magnetic energy peaks at the maximum coherence length scale ℓM, which is observationally implied in Tycho's SNR (Shimoda et al. 2018), we obtain the Faraday depth as

where N ∼ R/ℓM. The condition τV > 1 at ν ∼ 100 GHz gives
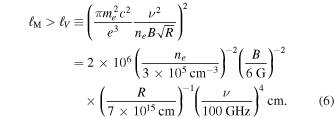
The observation of Tycho's SNR indicates ℓM ∼ R/10 (Shimoda et al. 2018). If this relation is valid for AT2018cow, the values of ne, B, and R estimated by Ho et al. (2019) and Margutti et al. (2019) (Equations (1), (2), and (4)) satisfy Equation (6).
The lower limit on ℓM leads to the lower limit on the maximum energy of accelerating particles at the shock. In the first-order Fermi acceleration, which is assumed by Ho et al. (2019), energetic particles are scattered through interactions with the turbulent magnetic-field to go back and forth between upstream and downstream of the shock, and then gain energies at every reciprocation (Bell 1978; Blandford & Ostriker 1978). The particles experience large-angle scattering if they resonantly interact with magnetic disturbances with a scale length comparable to their gyro radius, i.e., a pitch-angle scattering (Jokipii 1966). When the gyro radius of accelerated particles becomes larger than the maximum coherence length scale ℓM, the particle is no longer efficiently scattering and escapes from the shock. Thus, we obtain the maximum energy of accelerating particles as
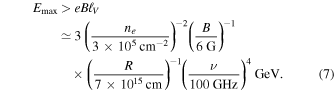
This argument is consistent with the model in which the relativistic non-thermal electrons are produced by the shock in AT2018cow.
The strong ν dependence of the lower limit on Emax should be emphasized. If one can perform polarimetric observation of such kinds of stellar explosions at higher frequencies, a stricter limit on Emax can be obtained. The origin of the PeV energy cosmic rays is unknown. By polarimetry at a higher ν (i.e., ∼THz), we could examine whether AT2018cow-like objects are the origin of PeV cosmic rays.
This Letter makes use of the following ALMA data: ADS/JAO.ALMA#2017.A.00046.T. ALMA is a partnership of ESO (representing its member states), NSF (USA) and NINS (Japan), together with NRC (Canada), MOST and ASIAA (Taiwan), and KASI (Republic of Korea), in cooperation with the Republic of Chile. The Joint ALMA Observatory is operated by ESO, AUI/NRAO and NAOJ. This work is supported by the Ministry of Science and Technology of Taiwan grants MOST 105-2112-M-008-013-MY3 (Y.U.) and 106-2119-M-001-027 (K.A.). This work is also supported by JSPS Grants-in-Aid for Scientific Research No. 18H01245 (K.T.). We thank EA-ARC, especially Pei-Ying Hsieh, for support in the ALMA observations. Y.U, K.Y.H, and K.A. also thank Ministry of Education Republic of China.
Facility: ALMA. -
Software: CASA (McMullin et al. 2007).
Footnotes
- 14
The differences between our deduced spectral peak frequencies and ∼100 GHz at 22 days estimated by Ho et al. (2019) may be caused by their analysis for narrow frequency range and power-law index measurement (−1.06 ± 0.01) using interpolated SMA data (between 20 and 24 days). Much flatter spectral index may be reasonable to explain the spectral excess of their measurement with 671 GHz at 23 days.
- 15
- 16
In the tidal disruption scenario, the external shock which propagates in the interstellar medium will have ne ∼ 1 cm−3, B ∼ 1 μG (Gaensler et al. 2005; Perley et al. 2019), R < c × 22 days. These lead to τV < 3 × 10⁻⁷ ≪ 1 in Equation (5) even for N = 1, and then a sizable linear polarization may be detected.