


Abstract
We present the observations of a small-scale oscillatory reconnection for the first time and its resulting in formation and disappearance of a flux rope with the high-resolution data obtained by the New Vacuum Solar Telescope and the Solar Dynamics Observatory on 2013 July 24 and 25. This oscillatory reconnection consists of four relatively independent magnetic reconnections which last for about 48, 158, 275, and 340 minutes, respectively. The durations of the four magnetic reconnections increase with time. Four current sheets along two nearly perpendicular directions are formed alternately. The oscillatory reconnection experiences two cycles, and the periods of the two oscillations are 206 and 615 minutes, which are much longer than the previous results. The period of the first oscillation is shorter than that of the second oscillation. Furthermore, a flux rope forms during the second magnetic reconnection. Its twist increases with the reconnection and transfers from the reconnection site to one leg, and this leads the flux rope to become more slender. Then, the flux rope disappears in the early stage of the third magnetic reconnection. We conclude that the formation and disappearance of the flux rope are caused by the oscillatory reconnection.
Export citation and abstract BibTeX RIS
1. Introduction
Magnetic reconnection is a fundamental and important process in astrophysics and laboratory physics. It is the rearrangement of magnetic field topology, in which the magnetic energy is released into plasma kinetic energy, thermal energy, and particle acceleration. Recently, both observations and numerical simulations have confirmed that magnetic reconnection does occur in the Sun (e.g., Savage et al. 2010; Xue et al. 2016, 2017; Huang et al. 2018; Li et al. 2018a; Ni et al. 2018; Yan et al. 2018), and, more and more observational evidence of magnetic reconnection is reported, such as reconnection inflows and outflows (Yokoyama et al. 2001; Takasao et al. 2012; Su et al. 2013; Xue et al. 2016), hot cusp-shaped loops (Tsuneta et al. 1992), loop-top hard X-ray sources (Masuda et al. 1994), current sheets (Xue et al. 2017), supra-arcades downflows (Asai et al. 2004), brightening (Yang et al. 2015), and so on. On the Sun, most eruptive events are accompanied by magnetic reconnections, e.g., flares, filament eruptions, coronal mass ejections, and jets (Sturrock 1966; Shibata et al. 1992; Lin & Forbes 2000; Shen et al. 2012; Yan et al. 2015; Li et al. 2018b). It is also found that magnetic reconnections play a key role in the formation of flux ropes (Xue et al. 2017; Yan et al. 2017). Different from the emergence model where flux ropes form originally in the convection zone (e.g., Fan 2001; Okamoto et al. 2008), in the reconnection model the flux ropes form by magnetic reconnections in the lower atmosphere due to convergence and vortex motions in the photosphere (e.g., van Ballegooijen & Martens 1989; Moore et al. 2001).
The oscillatory reconnection is reported for the first time by Craig & McClymont (1991) in a two-dimensional (2D) simulation. It is found that the relaxation of the free magnetic energy of an X-type neutral point can be accomplished by oscillatory reconnection in which the reconnection process is oscillatory and the plasma undergoes several oscillations through the neutral point. When studying the nonlinear fast magnetoacousic waves near about a 2D X-point based on a 2.5-dimensional numerical magnetohydrodynamic simulation, McLaughlin et al. (2009) found that a series of horizontal/vertical current sheets appear in the system and the connectivity of the associated magnetic field lines changes, and thus oscillatory reconnection occurs in their system. Murray et al. (2009) and McLaughlin et al. (2012b) analyzed the oscillatory reconnection accompanied by the emergence of a flux tube into a coronal hole. They conclude that the driving mechanism for oscillatory reconnection is due to the gas pressure gradient. McLaughlin et al. (2012a) investigated the periodic nature of oscillatory reconnection and identified two distinct periodic regimes: the impulsive and stationary phases. They found that the greater the amplitude of the initial velocity driver, the shorter the resultant period. Recently, Thurgood et al. (2017) studied three-dimensional (3D) oscillatory magnetic reconnection triggered by the localized collapse of a 3D null point. So far, there are only a few examples of oscillatory reconnections based on numerical simulations. However, a very clear observational case of oscillatory reconnection has not been reported, although it is used to explain the observed eruptive events on the Sun (e.g., Fletcher et al. 2001; Goff et al. 2007; Zhang et al. 2014).
In this Letter, for the first time, we present the observations of a small-scale oscillatory reconnection and its resulting in the formation and disappearance of a flux rope using the high-resolution data from the New Vacuum Solar Telescope (NVST; Liu et al. 2014) and the Solar Dynamic Observatory (SDO; Pesnell et al. 2012) on 2013 July 24 and 25. Observations of the NVST and SDO are described in Section 2. The results are given in Sections 3, while a summary and discussion are presented in Section 4.
2. Observations
The observational data are obtained by the NVST and SDO. NVST is a one-meter ground-based vacuum telescope and located in the Fuxian Solar Observatory of the Yunnan Observatories, Chinese Academy of Sciences (CAS). It provides observations of solar fine structures and their activities/eruptions in the solar lower atmospheres, and the field of view (FOV) is about 180'' × 180''. The main data used in this Letter are the Hα images of the NVST from 01:45:31 UT to 04:37:01 UT on 2013 July 25 that have a cadence of 12 s and a spatial resolution of 0 33. They are reconstructed using at least 100 short exposure images (Xiang et al. 2016). Additionally, the extreme ultraviolet (EUV) images at 304 Å and photospheric magnetograms observed by the Atmospheric Imaging Assembly (AIA; Lemen et al. 2012) and the Helioseismic and Magnetic Imager (HMI; Scherrer et al. 2012) are used to show the entire process of the oscillatory reconnection and the current sheets in the higher temperature atmosphere and magnetic configuration of the NOAA active region (AR) 11800, respectively. Furthermore, based on the photospheric vector magnetic fields of HMI and the nonlinear force-free field modeling (e.g., Wiegelmann 2004; Wiegelmann et al. 2006), we reconstruct the extrapolated magnetic fields and then calculate squashing factor Q (Démoulin et al. 1996; Titov et al. 2002) using the code developed by Liu et al. (2016).
3. Results
On 2013 July 25, the NOAA AR 11800 was located at S12W21 (Figure 1(a)). This AR consists of two main polarities and many discrete polarities. In the middle region of the AR, four polarities are focused on and indicated by P1, P2, N1, and N2, respectively (see Figure 1(b)). A small-scale oscillatory reconnection is observed by the NVST and SDO in this region. It contains four relatively independent magnetic reconnections named as MR1, MR2, MR3, and MR4 in chronological order, respectively. In the NVST Hα images, partial processes of the MR2 and MR3 are observed. MR2 occurs between the two sets of magnetic loops marked by the red (connecting the polarities P1 and N2) and the blue dotted lines (connecting the polarities P2 and N1) in Figures 1(c) and (d). MR3 occurs between the magnetic loops connecting P1 and N1 (marked by the pink lines in Figures 1(f) and (g)) and the loops connecting P2 and N2 (marked by the cyan lines). As seen from the NVST Hα images (Figures 1(c) and (f)), there may be a magnetic null point in the reconnection region. Additionally, the Q maps (Figures 1(e) and (h)) calculated at the photosphere show that the factor Q in the reconnection region is higher (denoted by the yellow arrows), indicating the existence of a quasi-separatrix layer therein, and magnetic reconnection occurs usually in a neutral region (e.g., neutral/null point, current sheet region, or quasi-separatrix layer). This provides the conditions for the occurrence of magnetic reconnections.
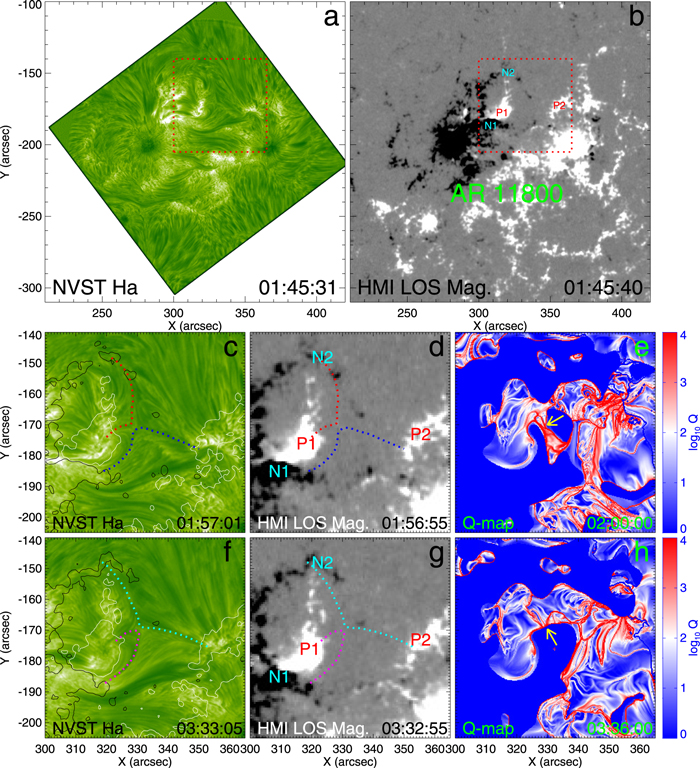
Figure 1. Overview of the NOAA AR 11800 in the NVST Hα images (panels (a), (c), and (f)), SDO/HMI magnetograms (panels (b), (d), and (g)), and Q maps (panels (e) and (h)). The red rectangles indicate the FOV of panels (c)–(h). The four polarities are labeled by P1, P2, N1, and N2, respectively. The contours of the SDO/HMI magnetograms are overlaid on the NVST Hα image in panels (c) and (f). The levels of ±50 Gauss is marked by the white (positive) and black (negative) curves, respectively. The inflow loops of the MR2 and MR3 are indicated by the dotted lines. Two higher Q regions in the reconnection site are denoted by the yellow arrows in panels (e) and (h).
Download figure:
Standard image High-resolution image
Figure 2 shows the partial process of the oscillatory reconnection (MR2 before 02:55 UT in Figures 2(a)–(f), and MR3 after 02:55 UT in Figures 2(g)–(l) using the NVST Hα data; see also the animation of Figure 2). MR2 and MR3 are significantly different in topology. During the MR2, the inflow regions (black arrows) are located in the northeast and southwest regions of the magnetic null point, and the outflow regions (white arrows) are in the northwest and southeast of the magnetic null point. However, during the MR3, the inflow regions are located in the northwest and southeast of the magnetic null point, and the outflow regions are in the northeast and southwest. Therefore, the inflow/outflow regions of the MR2 transfer into the outflow/inflow regions of the MR3, respectively. These series of the magnetic reconnections are named as oscillatory reconnections in previous studies (e.g., Craig & McClymont 1991; McLaughlin et al. 2009; Murray et al. 2009).
Figure 2. Evolutions of the oscillatory reconnection in the NVST Hα images. The reconnection inflow and outflow regions, the small-scale eruption, the newly formed loops, the heated inflow region, the current sheets, and the flux rope are indicated by the black, white, cyan, pink, blue, yellow, and red arrows, respectively. The black and the pink dotted lines represent the magnetic loops before reconnections and the cusp-shaped structures, respectively. An animation with the NVST Hα images is available. The animation covers all of the images from 01:47:56 UT to 04:35:51 UT on 2013 July 25. The duration of the animation is 27 s. The blue rectangle in the left panel indicates the FOV of the right panel.
(An animation of this figure is available.)
Download figure:
Video Standard image High-resolution image
MR2 occurs between two sets of the magnetic loops whose directions are opposite at the reconnection site (black dotted lines in Figure 2(a)). When the NVST began to observe this AR, the process of the MR2 was underway. It is easy to see that the magnetic loops approach and interact with each other and then reconnect. The new magnetic loops form in the two outflow regions and gradually move away from the reconnection site (pink arrows in Figure 2(d)), and their connectivities are different from that of the original magnetic loops. Meanwhile, two cusp-shaped structures are observed (marked by the pink lines in Figure 2(b)). Furthermore, at the reconnection site, the original magnetic loops are stretched into a bright linear structure between the two cusps (yellow arrow in Figure 2(e)), and it can be positively confirmed as a current sheet in the AIA 304 Å images (labeled by CS2, see the following paragraph). The current sheet is along the northwest–southeast direction. Therefore, all of the observations indicate that the magnetic reconnection (MR2) does occur in the middle region of AR 11800 until ∼02:55 UT.
At about 02:18 UT, a small-scale eruption takes place in the southwest region (cyan arrows in Figure 2(c)). A portion of the eruption moves to the reconnection site with a velocity of 42.4 km s−1, which is larger than the inflow velocities (see the following paragraph), and then the reconnection inflow region of the MR2 is heated (blue arrow in Figure 2(d)). This eruption may drive more magnetic loops to reconnect and results in the conversion of more magnetic energy. After the small-scale eruption (∼02:25 UT), a flux rope with a twist structure is formed gradually in the northwest outflow region (red arrows in Figures 2(e) and (f)), which is composed of the newly formed loops in the MR2.
MR3 starts at around 02:55 UT and occurs between the magnetic loops in the southeast region and first the threads of the magnetic flux rope and then the magnetic loops in the northwest region. In Figure 2(g), two typical loops (black dotted lines) are indicated before their reconnection. The observational evidence of the MR3 is similar to that of the MR2, such as the two cusp-shaped structures (pink dotted lines in Figure 2(j)), another current sheet along the northeast–southwest direction (labeled by CS3, the yellow arrow in Figure 2(k)), and newly formed loops (pink arrows in Figure 2(l)). At the same time, the flux rope disappears quickly in the initial stage of the MR3.
Using the running difference Hα images that are produced by subtracting the images 24 s earlier, we track four typical inflows of MR2 and MR3, which are marked by the green dotted lines in Figures 3(a1)–(d1) and its animation. The positions of each typical inflow at five moments are shown in Figures 3(a2)–(d2) using the dotted lines with different colors. It is easy to find that the magnetic inflows move gradually to the reconnection site. To show the dynamical evolution of these two magnetic reconnections, two time–distance diagrams displayed in Figure 3 are obtained using the running difference Hα images along the yellow dotted lines in Figure 3(a1). The time–distance diagrams in Figures 3(e) and (f) are made along the slices S1 and S2, respectively. In Figures 3(e) and (f), a lot of reconnection inflows and outflows propagating into and from the reconnection site are observed, respectively. In Figure 3(e), the magnetic loops first converge to the reconnection site before around 02:55 UT, and then the newly formed loops in the following magnetic reconnection are separated from the reconnection site. Therefore, the inflow regions transfer into the outflow regions at 02:55 UT. However, Figure 3(f) shows the opposite results in which the outflow regions transfer into the inflow regions. Here, several typical reconnection inflows (indicated by pink lines) and outflows (red lines) are chosen to calculate their velocities through fitting the motion with linear functions. It is shown that the velocities of the inflows during the MR2 are from to 5.5 to 10.0 km s−1, and the velocities of the outflows are from 1.7 to 4.4 km s−1. During the MR3, the velocities of the inflows and outflows are from 2.8 to 9.5 km s−1 and from 2.0 to 8.9 km s−1, respectively. Here, the velocities of the inflows and outflows are the projection of the actual value on the plane of the sky. They are the lower limit of the actual value.
Figure 3. (a1)–(d1) Running difference Hα images in which the green dotted lines mark the typical inflows at different inflow regions. The two slices indicated by the yellow dotted lines in panel (a1) are chosen to calculate the time–distance diagrams in panels (e) and (f). (a2)–(d2) The positions of the typical inflows indicated by different color lines at different moments. The black arrows represent the direction of the inflows. Panels (e) and (f): the time–distance diagrams obtained along the cyan dotted lines in panel (a1) using the NVST Hα running difference images. Panels (e) and (f) are along S1 and S2, respectively. The pink, red, and blue dotted lines represent the inflows, the outflows, and the small-scale eruption, respectively. The vertical white dotted line indicates the onset of the MR3. An animation with Hα running difference images is available. The animation covers all of the images from 01:48:20 UT to 04:37:03 UT on 2013 July 25. The duration of the animation is 14 s. The blue rectangle in the left panel indicates the FOV of the right panel.
(An animation of this figure is available.)
Download figure:
Video Standard image High-resolution image
The magnetic reconnections have also signals in the AIA 304 Å channel (Figure 4 and its animation). However, due to the lower spatial resolution than that of the NVST, we do not observe significant reconnection inflows and outflows in the AIA images. The current sheet CS2 (black arrows in Figures 4(c) and (e)) formed in the MR2 can be seen clearly to show a bright linear structure along the northwest–southeast direction in 304 Å channel. Meanwhile, two bright cusp-shaped structures (blue dotted lines in Figure 4(f)) appear at two ends of the CS2. These observations confirm the occurrence of magnetic reconnection again. Similarly, during the MR3 (Figures 4(g)–(j)), the CS3 and two additional cusp-shaped structures are observed clearly. But the CS3 is almost perpendicular to the CS2. Due to the longer observations of the SDO/AIA, we can check the data before and after the NVST observations. In the AIA 304 Å images before the occurrence of the MR2, another process of magnetic reconnection (MR1; Figures 4(a)–(b)) is observed and its observational characteristics are similar to the MR3. Meanwhile, after the MR3, there is also a process of magnetic reconnection (MR4; Figures 4(k)–(l)) that is similar to the MR1. In these two reconnection processes (MR1 and MR4), one can also see northeast–southwest and northwest–southeast current sheets (named as CS1 which formed in the MR1, and CS4 which formed in the MR4) and hot cusp-shaped structures, respectively. Thus, in this oscillatory reconnection, four independent magnetic reconnections occur. In other words, two complete cycles of the oscillatory reconnection are observed. During the oscillatory reconnection, the reconnection site shifts from the northeast to the southwest which may be driven by the movement of the associated polarities in the photosphere (Xue et al. 2018).
Figure 4. Oscillatory reconnection in the AIA 304 Å images. The current sheets are indicated by the black arrows. The blue arrow points to the small-scale eruption. The bright cusp-shaped structures are marked by the blue dotted lines. An animation of the SDO/AIA 304 Å images, covering from 23:20:31 UT on July 24 to 13:19:55 UT on 2013 July 25, is available. The duration of the animation is 69 s. The blue rectangle in the left panel indicates the FOV of the right panel.
(An animation of this figure is available.)
Download figure:
Video Standard image High-resolution image
MR1 occurs between around 23:29 UT on July 24 to 00:17 UT on July 25, and the MR2, MR3 and MR4 occur between ∼00:17 to 02:55 UT, between 02:55 UT to 07:30 UT, and between 07:30 and 13:10 UT on July 25, respectively. They last for about 48 minutes, 158 minutes, 275 minutes, and 340 minutes, respectively. If the combination of the MR1 and MR2 is considered as the first oscillation of the oscillatory reconnection, and the MR3 and MR4 as the second oscillation, the periods of two oscillations are calculated to be about 206 minutes and 615 minutes, respectively. And, if the MR2 and MR3 are one oscillation, its period is around 433 minutes.
During the MR2 and MR3, the flux rope forms in the northern region and then disappears from ∼02:28 UT to ∼03:21 UT (see Figure 5 and its animation). Before 02:28 UT, there has not a twist structure in this region, and the magnetic loops are almost parallel to each other. At 02:28 UT, the newly formed loops begin to become curved relative to the previously formed loops (see Figure 5(a)). The curved structures initially appear near the reconnection site and then spread to the southwest leg. And then, another newly curved structure forms again near the reconnection region. As in the magnetic reconnection, the curved loops become more and more dense (Figure 5(b)) and cross each other to form a twist structure (Figure 5(c)). This structure is often considered to be a flux rope. It is more and more clear with time in the Hα channel (Figure 5(d)). However, the flux rope is not observed in the EUV channels, implying that it is a lower temperature structure or it forms in the lower atmosphere (see also Xue et al. 2017). During its formation, it is found that the flux rope rotates around its central axis from 02:50 UT to 02:59 UT. If viewed from the reconnection site to the southwest footpoint of the flux rope, the rotation is clockwise. Furthermore, the twist of the flux rope increases with time and drifts from the reconnection region to the southwest leg. Meanwhile, the flux rope gradually becomes more slender with the increase of the twist. The width of the flux rope is estimated to be from about 3.3 Mm at first to 1.8 Mm in the end. Here, two typical threads of the flux rope are indicated by the cyan and pink lines in Figure 5(d). At last, the flux rope has a left-handed twist structure, and its twist is estimated to be about 1.5 turns (3π). From 02:55 UT, the threads of the flux rope begin to reconnect with the magnetic loops in the southeast inflow region of the MR3. These reconnecting threads are separated from the flux rope gradually (Figures 5(e)–(g)). In Figure 5(f), three typical threads of the flux rope at different stages are marked by the white, yellow, and red dotted lines, respectively. The white line represents the threads after the magnetic reconnection. The yellow line indicates the threads that are reconnecting, and the red line marks the threads before the magnetic reconnection. It is easy to see that the threads of the flux rope move to the reconnection site and reconnect with other loops, and thus their connectivity is changed due to the magnetic reconnection. At about 03:21 UT, it is too hard to see a twisting structure, and finally, the flux rope completely disappears. Additionally, in the same position, a lot of magnetic loops still exist for reconnection, but they are unwound (Figure 5(h)).
Figure 5. Formation and disappearance of the flux rope. The blue and the red arrows point to the reconnection site and the flux rope. The pink and the cyan dotted lines in panel (d) represent the typical threads of the flux rope. Three threads of the flux rope after, during, and before the reconnection are marked by the white, yellow, and red dotted lines, respectively. An animation showing the formation and disappearance of the flux rope from 01:45:31 UT to 04:30:36 UT on 2013 July 25 with NVST Hα images is available. Its duration is 14 s.
(An animation of this figure is available.)
Download figure:
Video Standard image High-resolution image
4. Summary and Discussion
On 2013 July 24 and 25, an oscillatory reconnection that consisted of a series of magnetic reconnections was observed by the NVST and SDO in the middle region of AR 11800. The solid observational evidence of these magnetic reconnections was obtained, including the reconnection inflows and outflows, the cusp-shaped structures, the newly formed loops and flux rope, and the current sheets. The inflow and outflow velocities are only several kilometers lower than those of the previous results (Yokoyama et al. 2001; Takasao et al. 2012; Su et al. 2013; Xue et al. 2016). In this oscillatory reconnection, four independent magnetic reconnection processes occur continuously at the same location, and they last for about 48 minutes, 158 minutes, 275 minutes, and 340 minutes, respectively.
The main characteristic of oscillatory reconnection is that the reconnection is oscillatory (Craig & McClymont 1991; McLaughlin et al. 2009; Murray et al. 2009; Thurgood et al. 2017). In our observations, the reconnection inflow regions in the previous magnetic reconnection are transferred into the outflow regions in the following magnetic reconnection, and the outflow regions during the previous reconnection change to the inflow regions during the following reconnection as seen from the NVST Hα data (Figures 2 and 3). Furthermore, in each independent magnetic reconnection, one current sheet forms (see Figure 4), and four current sheets in total are observed in the oscillatory reconnection. However, their directions are different. The two current sheets (CS1 and CS3) that formed in the MR1 and MR3 are along the northeast–southwest direction, and the other two (CS2 and CS4) that formed in the MR2 and MR4 are along the northwest–southeast direction. The current sheets along the two different directions are nearly perpendicular to each other and appear alternately in the oscillatory reconnection. Thus, these magnetic reconnections as a whole exhibit oscillatory properties, and two cycles of the oscillatory reconnection are observed in this event. Similarly, in the numerical simulation, McLaughlin et al. (2009) found that a series of horizontal/vertical current sheets appear alternately in oscillatory reconnection. They reported that the time taken to evolve from a horizontal current sheet to the following one is defined as the period of the oscillatory reconnection and as one complete cycle. Murray et al. (2009) reported a cycle of inflow/outflow bursts followed by outflow/inflow bursts.
In this event, it can be clearly seen that the two periods of the oscillatory reconnection are about 3.4 and 10.3 hr, respectively, and they increase with time. The period of the second oscillation is about three times that of the first one. In the numerical experiment, McLaughlin et al. (2012a) found that the greater the amplitude of the initial velocity driver, the shorter the resultant period, and the stationary period is longer than the impulsive period. They also reported that, for driving amplitudes of 6.3–126.2 km s−1, associated impulsive and stationary periods are in the range of 46.9–65.4 s and 56.3–78.9 s, respectively. If it is considered that the first oscillation corresponds to that in the impulsive phase and the second oscillation to that in the stationary phase of McLaughlin et al. (2012a), our observations about the difference of the periods are consistent with their prediction that the first period measured would be shorter than the following periods. However, one problem is that the observational periods (a few hours) are longer than the results (tens of seconds) of McLaughlin et al. (2012a). Recently, Thurgood et al. (2019) studied the periodicity of linear and nonlinear oscillatory reconnection and concluded that the nonlinear oscillatory reconnection is more realistic in the solar atmosphere. Meanwhile, periods of the nonlinear oscillatory reconnection are estimated to be from 10−3 to 103 s for typical solar parameters. Even so, the observed value of the periods of this oscillatory reconnection is 10 times larger than the maximum value of the theoretical value. The reason for these longer periods is unclear, and this will be investigated further whether from observations or numerical simulations in future studies.
In the oscillatory reconnection, the flux rope forms during the MR2 and then disappears during the MR3. It is found that the formation and disappearance of the flux rope are caused by the oscillatory reconnection. The formation of the flux rope due to the MR2 is based on the following reasons. First, the flux rope is composed of the newly formed loops in the northwest outflow region of the MR2. Second, the twist of the flux rope is initially formed near the reconnection site and then drifts to the southwest leg of the flux rope. And third, the twist of the flux rope increases with the magnetic reconnection. Therefore, we conclude that the formation of this flux rope is consistent with the reconnection model (e.g., van Ballegooijen & Martens 1989; Moore et al. 2001). Similarly, Xue et al. (2017) reported an observation of the formation of a flux rope driven by magnetic reconnection using the NVST data. In this event, the disappearance of the flux rope is caused by the magnetic reconnection between the threads of the flux rope and the surrounding magnetic loops. So far, observations of the disappearance of flux ropes due to magnetic reconnection are rarely reported in detail (Xue et al. 2016; Yang et al. 2017). Previous results for the disappearance of flux ropes have focused on their eruption (Zhang et al. 2012; Cheng et al. 2013; Li & Zhang 2014; Yan et al. 2014). These results shed light on the disappearance of the flux rope without any eruptions.
The authors gratefully acknowledge the insightful and constructive comments and suggestions by the anonymous referee which led to the significant improvements of this paper. The authors thank the NVST and SDO teams for providing high-resolution data. This work is sponsored by the National Science Foundation of China (NSFC) under the grant No. 11503080, 11873087, 11803085, 11633008, 11573012, and 11763004, the Yunnan Science Foundation of China under numbers 2018FB007 and 2018FA001, Youth Innovation Promotion Association, CAS (No. 2019061, 2011056), CAS Key Laboratory of Solar Activity, National Astronomical Observatories under number KLSA201910, CAS "Light of West China" Program, and the grant associated with the Project of the Group for Innovation of Yunnan Province.