


Abstract
Observations from Earth-based ground and orbiting telescopes indicate that the Ceres's exosphere has a time-varying water component. Evidence of a transient atmosphere was also detected by Dawn upon its arrival, inferred from the response on the Gamma Ray and Neutron Detector. That atmosphere appeared shortly after the passage of a large enhancement in the local flux of high-energy solar protons. Solar proton events have highly variable fluxes over a range of proton energies from 10 s of keV to over 100 MeV and are capable of sputtering water ice at or near the surface. Herein, we examine the fluxes of solar energetic protons measured during Earth-based attempts to detect water vapor and OH in the Ceres' atmosphere. We find that the presence of the cerean exosphere is correlated with the inferred presence of solar energetic protons at Ceres, consistent with the event detected by Dawn.
Export citation and abstract BibTeX RIS
1. Introduction
Ceres, the largest body in the main asteroid belt, is thought to be water-rich based in part on its low density. Prior to Dawn's arrival, the density was inferred by telescopic observations of its dimensions combined with measurements of its mass, determined from its gravitational pull on Mars (Konopliv 2011). These observations, combined with Ceres's shape (e.g., Drummond et al. 2014) were consistent with Ceres being composed of a mixture of water ice (∼20% ice mass) and rock. The International Ultraviolet Explorer (IUE) conducted searches for a water exosphere in both 1990 and 1991, successfully detecting OH emission on the latter attempt (A'Hearn & Feldman 1992). The launch of the Herschel Space Observatory in 2009 provided a new instrument sensitive to atmospheric water and successfully detected water in the cerean exosphere on three occasions with a non-detection on a fourth (Küppers et al. 2014). Similarly, a sensitive search with the Very Large Telescope (VLT) in 2007 did not observe OH emission (Rousselot et al. 2011). Proposed explanations for the variable nature of the cerean atmosphere included endogenic processes such as sublimation and localized plumes, and exogenic events, such as exposure of ice by impacts.
In 2015 March, Dawn arrived at Ceres to make a detailed examination of the dwarf planet's composition and geology and measure its gravitational field. Observations of water in the form of exposed surface ice in Oxo crater (Combe et al. 2016) and permanently shadowed regions (Platz et al. 2016) were accompanied by evidence that ice is present globally, within the top meter of the surface (Prettyman et al. 2017). Moreover, surface geology was consistent with significant water-ice content in the crust with pit craters in crater floors and long runout features from impacts (Buczkowski et al. 2016). A possible diurnal haze signature was also reported to occur in Occator crater (Thangjam et al. 2016), but no long-term variation was noted. Finally, no evidence was seen in Dawn's imagery of the surface for possible endogenic sources (e.g., vapor plumes) that could explain the transient behavior of the atmosphere. Instead, evidence for the production process was provided by Dawn's Gamma Ray and Neutron Detector (GRaND) (Prettyman 2011), which pointed to an exogenic solar source triggering the appearance of an atmosphere.
While Dawn was in Ceres's Survey orbit at 4400 km altitude, energetic electrons were inferred to be moving toward the Dawn spacecraft from the direction of Ceres over a period of a week (Russell et al. 2016b). The strength and temporal behavior of these electron bursts were similar to electron bursts seen at Earth when spacecraft are connected by the interplanetary magnetic field to the Earth's bow shock. The Earth's bow shock electrons are accelerated by fast Fermi acceleration when the interplanetary field is compressed as it crosses the shock at near tangency and the electrons experience a moving magnetic mirror that accelerates them away from the point of intersection with the shock (Leroy & Mangeney 1984; Wu 1984). One way of producing a transient, standing bow shock at Ceres is a comet-like interaction of the solar wind with a cerean atmosphere that can mass load the solar wind and cause it to deflect. Once the atmosphere dissipates, there will no longer be a significant obstacle to the solar wind to form a bow shock and the electron acceleration will cease. The longevity of a transient atmosphere produced by an impulse of emitted particles is expected to be about a week at Ceres from the time of the production of the atmosphere (Formisano et al. 2016). The event seen by Dawn began with a high flux of what was interpreted to be solar energetic protons, which have a different signature than that of the electron bursts (Russell et al. 2016b, Supplementary Text). This observation raised the question as to whether the solar energetic protons could explain the appearance of a transient cerean atmosphere on this, as well as other, occasions. We address that question by examining the solar energetic proton flux during the various detections and non-detections of the Ceres atmosphere, including the Dawn observation.
2. Observations
Due to its low binding energy, water ice is prone to sputtering by energetic particles. Creating a tenuous atmosphere via sputtering requires ions with energies between ∼1 keV and 1 MeV, with the sputtering rate peaking at ∼100 keV (Shi et al. 1995). The atmospheres of Europa and Ganymede are thought to be created by this process (Cheng & Johnson 1989) as the energetic particles trapped in Jupiter's magnetosphere impact and eject water molecules from the surface. Ceres, on the other hand, is bombarded by energetic ions only during solar energetic particle (SEP) events. These SEP proton events are generally accelerated by interplanetary shocks (rather than solar flares), providing a sometimes broad, expanding source. These charged particles travel outward ahead of the shock, to a first approximation guided by the interplanetary magnetic field. On Ceres, protons with energies higher than 100 keV will penetrate the surface. These protons scatter and slow down as they penetrate the crust and can release the water molecules that Dawn has detected near the surface (Prettyman et al. 2017). Water will be sputtered over a range of depths and can diffuse to the surface on timescales similar to that of the transient atmosphere. Figure 1 shows typical spectra of solar protons detected at 1 au from 10 eV solar wind ions to 10 MeV galactic cosmic rays. While at low energies the flux is relatively stable, the flux of protons above 10 keV jumps by orders of magnitude between quiet times and the disturbed times of SEP events. The variable fluxes of these particles are capable of causing a temporary enhancement in the sputtering rate at the dwarf planet, while the more stable solar wind interstellar pickup ions and corotating interaction region do not have sufficient energy to cause this variation. SEP induced water release could explain the apparent random presence of the cerean exosphere since the fluxes of SEP particles are highly variable due to their association with solar events.

Figure 1. Proton energies and densities provided by different sources. SEP events produce high densities of energetic protons. Figure reproduced from Russell et al. (2016a) with permission.
Download figure:
Standard image High-resolution imageIn this Letter, we examine the hypothesis that SEPs were also responsible for creating the previous transient atmospheric detections. We begin by comparing the 2015 June SEP event at Dawn and 1 au, when the observing locations were 28° apart. Figure 2 shows the comparison between protons ∼4–7 MeV measured by Wind 3DP (Lin et al. 1995) with the counts from GRaND's +Z Phoswich, which is sensitive to protons greater than 4 MeV (Prettyman 2011). The SEP event on Day 169 strongly resembles that seen at Ceres ∼10 hr later. However, since the Earth and Ceres are magnetically connected to different portions of the heliosphere, it is not guaranteed that both locations will experience the same events. On this occasion, a second larger event on Day 173 is seen at Earth but not at Ceres. Still, the typical broad extent of SEP events in heliospheric longitude makes it likely that both bodies will experience the same event when they have a small angular separation. In these cases, the Earth data can provide a useful estimate of the SEP fluxes at Ceres, but we should not expect the fluxes to be identical, or present, at both locations on every occasion.

Figure 2. Comparison of Earth's Wind 3DP 4–7 MeV proton data with GRaND's +Z Phoswich counts for the 2015 June event. Protons with energies greater than 4 MeV contaminate the Phoswich scintillator. The same SEP event seen at Earth on Day 169 is also seen by Dawn 10 hr later.
Download figure:
Standard image High-resolution imageAttempts to detect water in Ceres's atmosphere are ideally made when Ceres and Earth are near opposition since the observations are most sensitive at the smallest distance. The IUE and VLT observations were 20° ± 10° from opposition and the HSO observations were 55° ± 5° as shown in Figure 3. We used solar energetic proton data from the Advanced Composition Explorer (ACE) Electron, Proton, and Alpha Monitor (EPAM; Gold et al. 1998), Wind 3DP (Lin et al. 1995), and the OMNI data provided by the Space Physics Data Facility (http://omniweb.gsfc.nasa.gov). We inspected the proton fluxes for energies of ∼100 keV–4 MeV for a 10 day period prior to each observation, the estimated timescale for which an exosphere is expected to last at Ceres (Formisano et al. 2016). The IUE observations occurred before the respective 1994 and 1997 launches of Wind and ACE. Hence, only OMNI data greater than 1 MeV are available for the IUE cases. The relative delay in arrival times of the particles at Ceres from Earth will depend on how each is magnetically connected to the source. However, the travel time between Earth and Ceres for a 2 MeV particle should be on the order of a few hours. Thus, the 1 au data roughly reflect the real-time arrival of particles at Ceres.

Figure 3. Relative geometries of Ceres, Earth, STEREO A/B, at the time of each exospheric detection attempt. The spiral lines show the nominal interplanetary magnetic field that must connect the shock sources of the solar protons to the various observation sites.
Download figure:
Standard image High-resolution imageThere have been a total of eight observational attempts to detect H2O or OH in the Ceres exosphere. Figure 4 shows examples of the proton fluxes present at 1 au during each Ceres observation. The IUE 1990 and 1991 cases are plotted using the OMNI data for energies of 2–4 MeV, while all other cases are taken from the ACE EPAM instrument for energies of 1.91–4.75 MeV. The energetic proton flux during the 1991 IUE observation, when OH emission was detected, is about three orders of magnitude larger than the 1990 observation, which did not detect exospheric OH. Similarly, during the VLT 2007 non-detection, the proton flux is continually steady at a low value, which is consistent with a low sputtering rate. These are the three observations made closest to opposition. The strongest absorption feature seen by HSO on 2012 October 11 (Küppers et al. 2014) corresponds to the period with the highest ion flux bombardment. After the ion flux returns to its normal value, the water signal observed on 2012 October 24 becomes significantly weaker. This may reflect the decay of the exosphere due to the end of the solar event. Likewise, the water absorption feature was weaker during the 2013 March 6 detection (Küppers et al. 2014), when the proton flux was smaller in comparison to 2012 October 11, but still above the background value. The 10 day period before the 2011 November 23 observation is slightly above the normal value, but the ion flux may not have been high enough to produce an exosphere above the observable limit. In the case of the 2015 June GRaND event, the ion flux is large and comparable to that of the 2012 October 11 case.
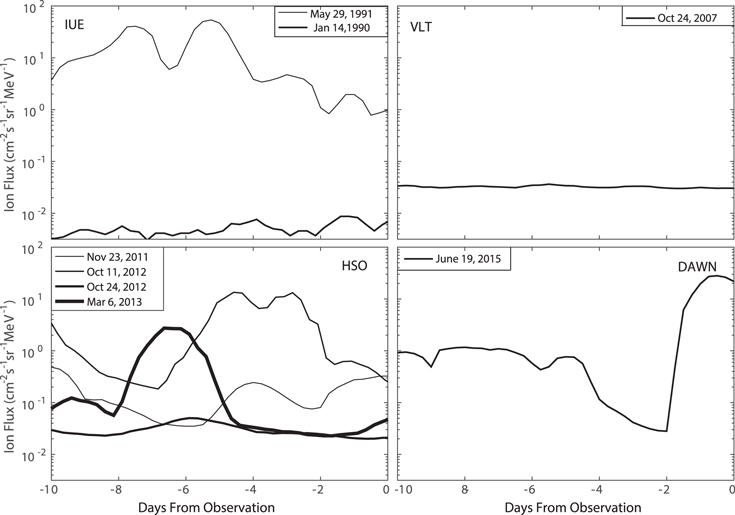
Figure 4. Daily averages of the ion fluxes prior to each observation. The data for the IUE cases are provided by the OMNI data (2–4 MeV), while all other cases are taken from the ACE EPAM instrument (1.91–4.75 MeV).
Download figure:
Standard image High-resolution imageFor all SEP events detected while it has been in operation, the Wind 3DP instrument shows protons with energies greater than 200 keV to have similar variations in their fluxes as the 2–4 MeV protons. Protons below 200 keV energy are fairly constant during the solar proton events and do not appear to significantly enhance the sputtering rate. Figure 5 shows the correlation between the ion flux averaged over the 10 day period leading up to the time of the observation with the estimated water vapor production rates. For cases where water vapor or its components were not detected, the reported upper limits are used. The water vapor production rate was estimated by A'Hearn & Feldman (1992) to be 1.4 × 1026 s−1. However, in that calculation, the OH is assumed to be escaping at the thermal speed of 0.5 km s−1. If we quadratically add the excess dissociation velocity (1.1 km s−1, isotropic) we obtain a production rate for this measurement of ∼3 × 1026 s−1. For the HSO observations, only the 2013 March 6 attempt observed Ceres for a full rotation, providing a production rate of 2 × 1026 s−1 (Küppers et al. 2014). However, we can estimate the global vapor production rates for the remaining attempts with a larger uncertainty. The strength of the water signal on 2012 October 24 was similar to that of 2013 March 6, providing a similar estimate of 2 × 1026 s−1 for that observation. The strongest signal from HSO on 2012 October 11 gives an estimated production rate between (3–4) × 1026 s−1; this measurement has the highest amount of noise present and the largest uncertainty in its estimation. For the HSO non-detection on 2011 November 23, the estimated upper bound on the vapor production rate is 1 × 1026 s−1. The vapor production rate for the Dawn event is based on a magnetohydrodynamic model that calculates the vapor production rate necessary to produce a bow shock. This model is similar to the code used by Jia et al. (2014) to study comets in the solar wind. Figure 5 shows a positive correlation between the calculated water production rates and the measured flux of SEPs at 1 au. In instances where the observations were preceded by an above-average flux of energetic ions, water vapor was detected. In interpreting the correlation, one should note that a factor of two variation in the HSO observations is significant, but a factor of two difference between HSO and IUE may not be significant since the two techniques have not been intercalibrated.

Figure 5. Energetic ion flux at 1 au averaged over 10 days prior to observation vs. the water vapor production rate detected. Upper limits are used for cases where water was not detected.
Download figure:
Standard image High-resolution image
3. Discussion
Previously proposed methods for the production of the cerean atmosphere do not provide satisfactory explanations for its occurrence. Dawn has seen no evidence for active plumes, optically or thermally. A sublimation-driven exosphere is inconsistent with the orbital locations of Ceres during the positive and negative water detections. The IUE observations were taken at similar heliocentric distances near perihelion, yet have contrasting detection results. HSO saw the strongest water signal when it was midway between aphelion and perihelion, followed by detections that were about half the magnitude as it approached the Sun. While sublimation may be the original source of the water stored on the surface of Ceres, the correlation with the solar proton flux indicates that solar particle sputtering is the proximate agent for the temporary enhancements in the vapor production rate, allowing the exosphere to be detected telescopically.
The observed variability in solar energetic protons is consistent with the transient behavior of Ceres's water exosphere. The differing solar energetic proton conditions provide a plausible explanation for the difference in exospheric detection during the two IUE measurements. The positive OH detection directly followed a large proton event, while the negative detection occurred when the proton flux was at background levels. The magnitudes of the water signals detected by HSO also varied with the particle flux observed at 1 au. Continuous GRaND observations during the event shown in Figure 2 indicate the transient exosphere can last on the order of a week once produced. Solar protons may generate the exosphere by sputtering water ice from exposed ice patches on the surface (Combe et al. 2016), water ice in polar cold traps (Platz et al. 2016; Schorghofer et al. 2016), the global ice table (Prettyman et al. 2017), or water molecules adfixed to the Ceres soil. We conclude that the time variability of solar proton sputtering from one or more of these possible sources is the most likely cause of the transient nature of Ceres's exosphere. We recommend that a reactive program be instituted to observe the Ceres atmosphere during SEP events. This could be instituted during alignments with MAVEN, Earth, or the STEREO spacecraft, all of which are properly instrumented to observe these particles. We also recommend that studies be conducted on proton sputtering from icy regoliths to enable more quantitative calculations of the water vapor production.