


Abstract
Possible violations of Lorentz invariance (LIV) have been investigated for a long time using the observed spectral lags of gamma-ray bursts (GRBs). However, these generally have relied on using a single photon in the highest energy range. Furthermore, the search for LIV lags has been hindered by our ignorance concerning the intrinsic time lag in different energy bands. GRB 160625B, the only burst so far with a well-defined transition from positive lags to negative lags provides a unique opportunity to put new constraints on LIV. Using multi-photon energy bands we consider the contributions to the observed spectral lag from both the intrinsic time lag and the lag by LIV effects, and assuming the intrinsic time lag to have a positive dependence on the photon energy, we obtain robust limits on LIV by directly fitting the spectral lag data of GRB 160625B. Here we show that these robust limits on the quantum gravity energy scales are  GeV for the linear, and
  GeV for the quadratic LIV effects, respectively. In addition, we give, for the first time, a reasonable formulation of the intrinsic energy-dependent time lag.
Export citation and abstract BibTeX RIS
1. Introduction
Spectral lag, the arrival time delay between light curves in different energy bands (or between correlated photons with different energies), is a common feature in gamma-ray bursts (GRBs; e.g., Cheng et al. 1995; Norris et al. 1996; Band 1997). Generally speaking, most GRBs show positive lags, i.e., light curves at higher energies (say, in the MeV range) peak earlier than those at lower energies (say, in a range of 10 s to 100 s keV). However, there are some rare cases showing zero lags or even negative lags (e.g., Norris et al. 2000; Liang et al. 2006; Ukwatta et al. 2012). Since the launch of the Fermi satellite, many GRBs with high energy emission above 100 MeV have been detected. In contrast to the positive lags of low energy emission, GeV photons are found to be delayed with respect to MeV photons in many (but not all) GRBs (i.e., negative lags; see Abdo et al. 2009a, 2009b; Mészáros & Rees 2011). Some physical models have been formulated to account for the intrinsic origin of lags (e.g., Ioka & Nakamura 2001; Shen et al. 2005; Toma et al. 2009; Uhm & Zhang 2016). Particularly, Uhm & Zhang (2016) showed that the intrinsic positive lags could be well reproduced by a simple model invoking synchrotron radiation from a rapidly expanding outflow.
On the other hand, one possible explanation for the negative lags is provided by quantum gravity (QG) effects. One such effect is the Lorentz invariance violation (LIV). Lorentz invariance is typically expected to be broken at the Planck scale ( GeV; see Mattingly 2005; Amelino-Camelia 2013, and references therein).11
Many theories of QG predict that LIV happens at high energy scales, since high-energy photons may interact with the foamy structure of spacetime at small spatial scales (Amelino-Camelia et al. 1997). In such cases, the speed of light in a vacuum would depend on the energy of the photon, and high-energy photons propagate in a vacuum slower than low-energy photons (Amelino-Camelia et al. 1998). The energy scale for LIV,
GeV; see Mattingly 2005; Amelino-Camelia 2013, and references therein).11
Many theories of QG predict that LIV happens at high energy scales, since high-energy photons may interact with the foamy structure of spacetime at small spatial scales (Amelino-Camelia et al. 1997). In such cases, the speed of light in a vacuum would depend on the energy of the photon, and high-energy photons propagate in a vacuum slower than low-energy photons (Amelino-Camelia et al. 1998). The energy scale for LIV,  , could therefore be constrained by the arrival time differences of the photons with different energies originating from the same astronomical source (Amelino-Camelia et al. 1998; Ellis & Mavromatos 2013).
Thanks to their short spectral lags, cosmological distances, and very high-energy photons, GRBs have been viewed as the most promising sources for studying LIV effects (Amelino-Camelia et al. 1998; Ellis et al. 2006; Jacob & Piran 2008). In the past, various limits on LIV have been obtained from the spectral time lags of individual GRBs or a large sample of GRBs (e.g., Amelino-Camelia et al. 1998; Coleman & Glashow 1999; Schaefer 1999; Ellis et al. 2003, 2006; Boggs et al. 2004; Kahniashvili et al. 2006; Jacob & Piran 2008; Abdo et al. 2009a, 2009b; Biesiada & Piórkowska 2009; Xiao & Ma 2009; Shao et al. 2010; Chang et al. 2012, 2016; Nemiroff et al. 2012; Ellis & Mavromatos 2013; Kostelecký & Mewes 2013; Vasileiou et al. 2013, 2015; Pan et al. 2015; Zhang & Ma 2015; Wei et al. 2016). In particular, Abdo et al. (2009a) used the time lag of the highest energy (13.2 GeV) photon from GRB 080916C to constrain the linear LIV energy scale ( ) and presented a stringent limit of
  GeV, improving the previous limits by at least one order of magnitude. Abdo et al. (2009b) set the current strictest limits on both the linear and quadratic LIV energy scales by analyzing the arrival time delay between a 31 GeV photon and the low-energy (trigger) photons from GRB 090510. The limits set are
  and
and  GeV. However, these limits were based on the rough time lag of a single GeV-scale photon. It is necessary to consider using the true spectral time lags of bunches of high-energy photons (i.e., the lags of high-quality, high-energy light curves) to constrain the LIV. Furthermore, since the emission mechanism of GRBs is still poorly understood, it is difficult to distinguish an intrinsic time delay at the source from a delay induced by propagation in a vacuum to the observer. That is, the method of the flight-time difference used for testing LIV is hindered by our ignorance concerning the intrinsic time delay in different energy bands (see, e.g., Ellis et al. 2006; Biesiada & Piórkowska 2009).
The first attempt to disentangle the intrinsic time delay problem was presented in Ellis et al. (2006). They proposed working on statistical samples of GRBs at a range of different redshifts, and formulated the problem in terms of a linear regression analysis where the slope corresponds to the QG scale related to the LIV effect, and the intercept represents the possible intrinsic time delay. This analysis has the advantage that it can extract the spectral time lags of broad light curves in different energy bands. In this manner, weak evidence for LIV was found under the assumption that all GRBs had the same intrinsic time delay (Ellis et al. 2006). However, due to the fact that the durations of GRBs span about six orders of magnitude, it is not likely that the high-energy photons emitted from different GRBs (or from the same GRB) have the same intrinsic time lag as compared with the emission time of the low-energy photons (Chang et al. 2016). As an improvement, Zhang & Ma (2015) fitted the data of the energetic photons from GRBs on straight lines with the same slope but with different intercepts (i.e., different intrinsic time lags). Unfortunately, photons from different GRBs on the same line still mean that the intrinsic time lags between the high-energy photons and the onset low-energy photons are approximately the same for these GRBs, which is not always true and could be a coincidence. Chang et al. (2012) estimated the intrinsic time lag between emissions of high- and low-energy photons from GRBs by using the magnetic jet model. However, the magnetic jet model relies on some particular theoretical parameters, and this leads to uncertainties on the LIV results.
Recently, Fermi detected a peculiar burst, GRB 160625B, that had three dramatically different isolated sub-bursts (Burns 2016; Zhang et al. 2016a), with unusually high photon statistics, allowing the use of amply populated energy bands. Here we calculate the spectral lags between the lowest energy band (10–12 keV) and any other high-energy band for the second sub-burst of GRB 160625B, and find that the lag increases at  , and then shows a steep decline in the energy range
  . In other words, the behavior of the spectral lags of this GRB is quite different, and a transition from positive lags to negative lags is, for the first time, discovered within a burst. If the LIV effect that happens at high energy scales is considered here, the observed time lag (
 ) between different energy bands of a GRB should consist of two terms

where  represents the intrinsic emission time delay, and
  denotes the time delay induced by the LIV effect. Instead of assuming an unknown constant for
  , we argue that the intrinsic lag should be positively correlated with the energy, i.e., the higher-energy photon arrives earlier than the lower-energy photon (Shao et al. 2016). Due to the LIV effect at high energy scales, a high-energy photon emitted (ideally) simultaneously with a low-energy photon is to be observed later than that low-energy photon. Here we study the LIV effect of the high-energy photons in this direction. Put differently,
  and
and  have a different sign and therefore this positive correlation between the lag and the energy gradually becomes an anti-correlation.
In this work, we develop a new method through which a reasonable formulation of the intrinsic time delay can be derived, by fitting the energy dependence of the time lag. This allows us to simultaneously obtain robust limits on the 1st order and 2nd order QG energy scale. We describe the data analysis in Section 2, and our methods and results are presented in Section 3. Our conclusions are briefly summarized in Section 4.
2. The Observed Properties of Spectral Lags of GRB 160625B
At  UT on 2016 June 25, the Fermi Gamma-Ray Burst Monitor (GBM; Burns 2016) triggered and located GRB 160625B for the first time. Then the Fermi Large Area Telescope (LAT; Dirirsa et al. 2016) detected a sharp increase in the rate of high-energy photons at 22:43:24.82 UT, resulting in an onboard trigger on a bright pulse from the same GRB. At 22:51:16.03 UT, GBM triggered again on GRB 160625B (Burns 2016). The gamma-ray light curve of GRB 160625B consisted of three dramatically different isolated sub-bursts with a total duration of about
  (15–350 keV; Zhang et al. 2016a). The first sub-burst (precursor) that initially triggered the GBM was soft with a duration of about 0.84 s. The precursor was followed, corresponding to the LAT trigger and starting at
  , by the main, extremely bright and spectrally hard episode with a duration of about 35.10 s. After a long waiting time (∼339 s), the third sub-burst triggered GBM again, and had a duration of about 212.22 s. Spectroscopic observations reveal absorption features consistent with Mg i, Mg ii, Mn ii, and Fe ii lines at a redshift of z = 1.41 (Xu et al. 2016).
Since the second sub-burst of GRB 160625B is very bright, we can easily extract its light curves in different energy bands (see Figure 1). In this analysis, we use the cross-correlation function (CCF) method to calculate the lags between light curves of different energies for intervals 180.6–215.7 s of the burst. The detailed CCF method is described in Zhang et al. (2012). We look for spectral time lags in the light curves recorded in the lowest energy band (10–12 keV) relative to any other GBM light curves with higher energy bands, and find that the lag behavior is quite different. A transition from positive lags to negative lags is first discovered at  (see Figure 2). The observed time lags we extract from the energy-dependent light curves are listed in Table 1, together with their energy bands.

Figure 1. Energy-dependent light curves of the second sub-burst of GRB 160625B. The full-range (10–20,000 keV) light curve is shown on top (thick black line).
Download figure:
Standard image High-resolution image
Figure 2. Energy dependence of the observed spectral lag  (relative to the softest band), and the best-fit theoretical curves: (solid line) the linear (n = 1) LIV model; (dashed line) the quadratic (n = 2) LIV model.
Download figure:
Standard image High-resolution imageTable 1. The Time Lags between the Lowest Energy Band (10–12 keV) and Any Other High-energy Bands for the Second Sub-burst of GRB 160625B
| Energy |

|
Energy |

|
|---|---|---|---|
| (keV) | (s) | (keV) | (s) |
| 12–16 | −0.070 ± 0.134 | 1059–1247 | 1.892 ± 0.158 |
| 16–20 | −0.015 ± 0.130 | 1247–1468 | 2.208 ± 0.162 |
| 20–25 | 0.081 ± 0.125 | 1468–1728 | 2.375 ± 0.179 |
| 25–32 | 0.210 ± 0.123 | 1728–2035 | 2.088 ± 0.193 |
| 32–41 | 0.296 ± 0.124 | 2035–2396 | 2.361 ± 0.208 |
| 41–52 | 0.466 ± 0.122 | 2396–2821 | 2.325 ± 0.212 |
| 52–66 | 0.611 ± 0.127 | 2821–3321 | 2.242 ± 0.255 |
| 66–84 | 0.699 ± 0.122 | 3321–3910 | 2.334 ± 0.273 |
| 84–106 | 0.913 ± 0.120 | 3910–4603 | 3.080 ± 0.290 |
| 106–135 | 1.012 ± 0.128 | 4603–5419 | 3.538 ± 0.382 |
| 135–171 | 1.204 ± 0.121 | 5419–6380 | 4.306 ± 0.409 |
| 171–217 | 1.257 ± 0.132 | 6380–7511 | 4.142 ± 0.483 |
| 217–275 | 1.290 ± 0.131 | 7511–8843 | 4.435 ± 0.542 |
| 275–348 | 1.477 ± 0.145 | 8843–10411 | 2.681 ± 0.653 |
| 348–442 | 1.908 ± 0.168 | 10411–12256 | 1.670 ± 0.803 |
| 442–560 | 1.846 ± 0.182 | 12256–14429 | 1.962 ± 0.906 |
| 560–710 | 1.856 ± 0.202 | 14429–16988 | −0.223 ± 1.030 |
| 710–899 | 2.765 ± 0.243 | 16988–20000 | 1.637 ± 0.858 |
| 899–1059 | 2.079 ± 0.143 |
Download table as: ASCIITypeset image
3. Constraints on the Violation of Lorentz Invariance
As mentioned above, the LIV-induced time lag  may be accompanied by an unknown intrinsic energy-dependent time lag
  caused by the unknown emission mechanism of GRBs. Here we propose, for the first time, that the contributions of both the intrinsic time lag and the LIV effects can result in a lag behavior with a transition from positive lags to negative lags. Due to the fact that the dominant fraction of GRB light curves shows positive lags (e.g., Minaev et al. 2014; Shao et al. 2016), we suggest that there is a positive correlation between the intrinsic time lag and the energy. As the LIV effect takes the lead at the high energy scales, this positive correlation trends in an opposite way.
3.1. The Intrinsic Energy-dependent Time Lag
In the observer frame, we assume the intrinsic positive time lag (between the lowest energy band and any other high-energy bands) increases with the energy E in the form of an approximate power-law function:
with  and
and  , where
  is the median value of the fixed lowest energy band (10–12 keV). The coefficient τ and the index α are free parameters, which must be optimized simultaneously with the QG energy scale
  (more on this below). We emphasize that a positive lag corresponds to an earlier arrival time for the higher energy emission in this study.
3.2. The Time Delay Induced by the LIV Effect
In QG scenarios, the LIV induced modifications to the photon dispersion relation can be expressed by the leading term of the Taylor expansion as

which corresponds to a photon propagation speed

where  denotes the QG energy scale, the nth order expansion of the leading term corresponds to the linear (n = 1) or quadratic (n = 2 order), and
  is the "sign" of the LIV effect (
 or
or  stands for a decrease or an increase in photon velocity with an increasing photon energy). In the case of
  , photons with higher energies would travel slower than those with lower energies in a vacuum. This predicts a negative spectral lag due to LIV, so we consider the
  case in the following.
Because of the energy dependence of the photon speed, two photons with different energies (denoted by E and E0, where  ) emitted simultaneously from the same source would arrive on Earth at different times. Taking into account the cosmological expansion, the LIV induced time delay is given by (Jacob & Piran 2008; Zhang & Ma 2015)
where  and
and  are the arrival times of the low-energy photon and the high-energy photon, respectively. Here we use the cosmological parameters determined by the
  observations (Planck Collaboration et al. 2014):
  km
km  ,
,  , and
, and  .
.
3.3. Results
With the 37 lag-energy measurements (see Table 1 and Figure 2), from Equations (1), (2), and (5), we perform a global fitting to determine the free parameters (τ, α, and  ) simultaneously using the Monte Carlo (MC) approach. A fitting engine (McFit) has been developed, which employs a Bayesian MC fitting technique to realistically fit free parameters that are constrained by the observed data even when other parameters are unconstrained. With the help of this technique, the best-fit parameters and their uncertainties can be reliably determined by the converged MC chains (Zhang et al. 2015, 2016b).
We first fit the observed lag-energy data with the linear LIV case (i.e., n = 1). The resulting constraints on τ, α, and  are shown in Figure 3. These contours show that at the
  level, the best-fit parameter values are
  ,
,  , and
, and  , with a
  .
.
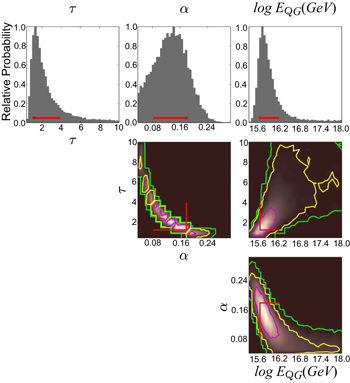
Figure 3. Parameter constraints of the linear (n = 1) LIV case fitting for the lag-energy data. Histograms and contours display the likelihood map of the parameter-constraint outputs by our McFit package. Red crosses indicate the best-fit values and their  error bars.
Download figure:
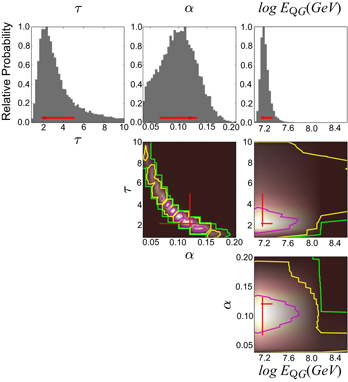
Standard image High-resolution imageNext, we consider the quadratic LIV case (i.e., n = 2) to fit the observed lag-energy data. The parameter constraints are displayed in Figure 4. We see here that the best-fit corresponds to  ,
,  , and
, and  . With
  degrees of freedom, we have
  .
.
Figure 4. Same as Figure 3, except now for the quadratic (n = 2) LIV case.
Download figure:
Standard image High-resolution image
The best-fitting theoretical curves for the linear LIV case (solid line; with  ,
,  , and
, and  ) and for the quadratic LIV case (dashed line; with
  ,
,  , and
, and  ) are shown in Figure 2. This reveals that both cases are adequate for representing the data.
With the best-fit values of  and
and  as well as their
  error bars, the
  confidence-level lower limit on LIV is

for the linear (n = 1) LIV case, and

for the quadratic (n = 2) LIV case.
3.4. Other Possible LIV Tests
There are some observations (e.g., the ultrahigh-energy cosmic rays and the TeV photons) with energies above an expected threshold (pion production or pair creation) that can be considered "threshold anomalies." It has been proposed that LIV could be the origin of the threshold anomalies (Amelino-Camelia & Piran 2001). That is, the LIV scenario could be tested not only by the study of spectral lags but also by analysis of data on such threshold anomalies. The limits on LIV from the threshold anomalies are at a level well beyond the sensitivity of the analysis reported in this paper (see Mattingly 2005; Amelino-Camelia 2013, and references therein). On the other hand, it is well known that threshold anomalies do not apply to the DSR scenario (see Mattingly 2005; Amelino-Camelia 2013). These results on threshold anomalies would imply that the analysis of spectral lags reported in this paper would not carry much weight on the debate concerning LIV (since more stringent limits may be established via the threshold anomalies), instead serving as a more valuable contribution to the debate on the DSR scenario.
4. Summary and Discussion
The observed spectral lags of GRBs have been widely used to constrain the energy scales of LIV. The key issue in the idea of searching for spectral lags, however, is distinguishing the possible time delay induced by the LIV effect from any source-intrinsic time lag in the emission of photons at different energies. In order to overcome the intrinsic time lag problem, Ellis et al. (2006) proposed a data fitting procedure to test the LIV effect, and an unknown constant was assumed to be the intrinsic time lag in the linear fitting function, furthermore assuming that all GRBs have the same intrinsic time lag.
Here, instead of assuming an unknown constant for the intrinsic time lag, we argue that the intrinsic lag has a positive dependence on the photon energy. On the other hand, the LIV effects that are expected at high energy scales would make high-energy photons travel in a vacuum slower than low-energy photons, so we suggest that the positive correlation between the lag and the energy will gradually become an anti-correlation at high energy scales. In this work, we successfully fit the evolving behavior of the spectral lags of GRB 160625B (i.e., the existence of a transition from positive lags to negative lags) by considering the contributions of both the intrinsic time lag and the lag from the LIV effect. This is the first time, to our knowledge, that it has been possible to give both a reasonable formulation of the intrinsic energy-dependent time lags and robust limits on LIV through direct fitting of the spectral lag data of a GRB.
Our limit on the linear LIV case ( GeV) obtained here from the spectral lags is comparable to the limit found from Ellis et al. (2006) with an unknown constant for the intrinsic time lag, being less than three orders of magnitude below the Planck energy scale. Our limit on the quadratic LIV case (
 GeV) is four orders of magnitude below the current best limit from the single GeV photon of GRB 090510 (Abdo et al. 2009b; Vasileiou et al. 2013). While the spectral lags of GRB 160625B do not currently have the best sensitivity to LIV constraints, there is nonetheless merit to the result. First, the true spectral time lags of broad light curves in different energy multi-photon bands are used to obtain reliable constraints on LIV, rather than the rough time lags obtained from a single GeV photon. Second, the analysis of the intrinsic time lag performed here is important for studying the flight time differences from the astronomical sources to test the LIV effect, since it impacts the reliability of the resulting constraints on LIV. Compared with previous works, the problems associated with the intrinsic time lags can be handled better with our new method. Furthermore, it is reasonable to expect that GRB 160625B is not the only burst where a transition from positive to negative lags can be determined, and the method presented here can be used for any burst with similar lag features. More stringent constraints on LIV can be expected as our method is applied to larger numbers of GRBs with higher temporal resolutions and more high-energy photons.
We thank the anonymous referee for constructive suggestions. This work is supported by the "973" Program of China (2014CB845800), the National Natural Science Foundation of China (grant Nos. 11322328, 11433009, 11673068, 11603076, and 11103083), the Youth Innovation Promotion Association (2011231 and 2017366), the Key Research Program of Frontier Sciences (QYZDB-SSW-SYS005), the Strategic Priority Research Program "Multi-waveband gravitational wave Universe" (grant No. XDB23000000) of the Chinese Academy of Sciences, the Natural Science Foundation of Jiangsu Province (grant No. BK20161096), and the Guangxi Key Laboratory for Relativistic Astrophysics. B.B.Z. acknowledges support from the Spanish Ministry Projects AYA 2012-39727-C03-01 and AYA2015-71718-R. L.S. acknowledges support from the Joint NSFC-ISF Research Program (No. 11361140349). P.M. acknowledges NASA NNX 13AH50G.
Footnotes
- 11
Note that here we adopted a LIV scenario with broken relativistic symmetries. This reflects the earlier incarnations of the relevant phenomenology on the QG side, although in recent years more attention has been given to a description of these QG effects in a doubly special relativity (DSR) scenario, in which relativistic symmetries are deformed rather than broken (e.g., Amelino-Camelia & Ahluwalia 2002; Amelino-Camelia 2002; Kowalski-Glikman & Nowak 2002; Magueijo & Smolin 2003).