


ABSTRACT
Ultra-diffuse galaxies (UDGs) have the sizes of giants but the luminosities of dwarfs. A key to understanding their origins comes from their total masses, but their low surface brightnesses ( 25.0) generally prohibit dynamical studies. Here, we report the first such measurements for a UDG (VCC 1287 in the Virgo cluster), based on its globular cluster system dynamics and size. From seven GCs we measure a mean systemic velocity vsys =
  km s−1, thereby confirming a Virgo cluster association. We measure a velocity dispersion of
  km s−1 within 8.1 kpc, corresponding to an enclosed mass of (4.5 ± 2.8) × 109M⊙ and a g-band mass-to-light ratio of
  within an effective radius. From the cumulative mass curve, along with the GC numbers, we estimate a virial mass of ∼8 × 10¹⁰M⊙, yielding a dark-to-stellar mass fraction of ∼3000. We show that this UDG is an outlier in Mstar–Mhalo relations, suggesting extreme stochasticity in relatively massive star-forming halos in clusters. Finally, we discuss how counting GCs offers an efficient route to determining virial masses for UDGs.
Export citation and abstract BibTeX RIS
1. INTRODUCTION
Deep imaging surveys of the Fornax (Muñoz et al. 2015), Virgo (Ferrarese et al. 2012; Mihos et al. 2015), Coma (van Dokkum et al. 2015a), and the Pisces-Perseus supercluster (Mártinez-Delgado et al. 2016) are revealing substantial populations of faint systems that were hidden from shallower surveys. Perhaps most startling have been the results in Coma. van Dokkum et al. (2015a) identified 47 "ultra-diffuse galaxies" (UDGs) consisting of seemingly quiescent stellar populations with characteristic luminosities, sizes, and central surface brightnesses (SBs) of Lg ∼ 0.1–2.5 × 10⁸L⊙, Re ∼1.5–4.6 kpc, and μg ∼ 25 mag arcsec−2. That is, these are galaxies with sizes similar to that of the Milky Way (∼2.15 kpc scale length, or ∼3.6 kpc Re; Bovy & Rix 2013), but stellar luminosities more akin to dwarfs. Koda et al. (2015) identified a further ∼1000 UDGs in Coma from deep Subaru imaging. The inference is that these galaxies may be only the tip of the iceberg of ultra-faint stellar systems in clusters.
There are several possible formation pathways for UDGs. They may be descendents of "normal" galaxies that have been altered within the cluster tidal field (Gnedin 2003). Alternatively, they may be "tidal dwarfs," systems that were formed during galaxy interactions and then lost to the cluster potential to exist in a transient, free-floating phase (Bournaud et al. 2007). A third possibility is that they are ancient, remnant systems, perhaps either a species of "peculiar dwarf" or "failed giant," depending upon their total masses. This last category could explain the survival of UDGs in cluster environments, but would also imply that they are among the most dark matter (DM) dominated galaxies in the universe, with mass-to-light ratios of >50 within only 2 Re (van Dokkum et al. 2015b).
Determining total masses for UDGs is clearly a priority for understanding their formation and evolutionary pathways. Unfortunately, due to their low SBs, obtaining galaxy-integrated spectra of sufficient signal-to-noise ratio (S/N) for robust stellar velocity dispersions is extremely challenging with current instrumentation.
Taking a different approach, in this Letter, we have obtained the first mass measurements of a UDG, via the dynamics and statistical properties of its globular cluster (GC) system.
2. DATA
2.1. Galaxy and GC Photometry
We identified UDG candidates in Virgo using deep images taken with a 10 cm apocromatic refractor and archival CFHT/MegaCam imaging. In particular, we selected one galaxy, VCC 1287, with all the characteristics of a UDG (Figures 1 and 2). We analyzed its photometry from 1 deg2 MegaCam images in five bands (u, g, r, i, z), from the Canadian Astronomy Data Center. All images had been reduced and calibrated using the Megapipe image stacking pipeline (Gwyn 2008).

Figure 1. Environment surrounding VCC 1287, observed with a 0.1 m aperture at f/5.7 Borg ED101 apocromatic refractor from the Antares Observatory in northeastern Switzerland. The subplot is a zoomed-in gri color-composite image of VCC 1287 from CFHT/MegaCam. GC candidates are circled in red. The green and orange boxes identify confirmed GCs and the confirmed nucleus of the galaxy, respectively. North is up, east is left.
Download figure:
Standard image High-resolution image
Figure 2. Relations between size (circularized Re), mean surface brightness, and absolute magnitude for hot stellar systems (after van Dokkum et al. 2015b). The gray points show distance-confirmed objects from the compilation of Brodie et al. (2011), with updates in http://sages.ucolick.org/spectral_database.html. Also included are UDGs from van Dokkum et al. (2015a) and Mihos et al. (2015). The red star marks VCC 1287.
Download figure:
Standard image High-resolution imageThe galaxy light was modeled using the software MegaMorph/GALFITM (Vika et al. 2013), which performs simultaneous multi-band 2D fitting. All five MegaCam bands were first rebinned to 0.364 arcsec pix−1 and then fitted using a single-Sérsic function. Magnitudes and Re were allowed to vary in different bands as a linear function of wavelength, whereas the Sérsic index n, the minor-to-major axis ratio b/a, and the position angle PA were constant in all images. From GALFITM, we obtained n = 0.8, b/a = 0.8, and PA = 36°.
We adopt a Virgo cluster distance modulus of m − M = 31.1 (Mei et al. 2007). We measure a mean, circularized Re across five photometric bands of Re = 30 2 ± 18 (2.4 ± 0.1 kpc) and obtain a mean SB of μ(g, 0) = 26.7 mag arcsec−2,
  , and Mg = –13.3. By comparison, the UDGs identified by van Dokkum et al. (2015a) have Re = 1.5–4.6 kpc,
  mag arcsec−2,
  , and
, and  (Figure 2). VCC 1287 has already been identified as a faint, extended system by Binggeli et al. (1985) in the Virgo Cluster Catalog (VCC), although no redshift has been published. Indeed, Binggeli et al. (1985, p. 1756) classified VCC 1287 as a dwarf irregular galaxy ".. of very large size and low surface brightness."
GCs were identified exploiting all five MegaCam bands. A catalog of sources was extracted using SExtractor (Bertin & Arnouts 1996). Only objects detected in all five bands were considered, selecting point sources by imposing the i-band class star parameter of SExtractor to be >0.5. This removes most extended objects from the catalog, owing to the excellent (06) seeing of the images. We selected as GC candidates all point sources within the following color ranges: 0.6 < (g − z) < 1.2, 1.1 < (u − g) < 1.8, and 0.7 < (g − i) < 1.0. We selected a fairly narrow color range in order to minimize contamination from background sources (in particular, red background galaxies). However, these color ranges are consistent with the distributions seen in other studies of Virgo dwarf galaxies (e.g., Beasley et al. 2006; Peng et al. 2006). In order to exclude ultra-compact galaxies, we also imposed a magnitude cut, i > 19.5 mag, equivalent to the magnitude of the Milky Way GC ω Cen at the distance of Virgo.
To determine the total number of GCs in VCC 1287, we constructed the surface density profile of the GC system and found it to extend to ∼175'' (∼13 kpc), beyond which is a constant background with 0.2 objects per arcmin2. Next, all point sources within 175'' of the galaxy center and that satisfy our selection criteria were flagged as GCs—returning 18 candidates. Star and galaxy contamination were calculated by the random placement of 1000 circles with 175'' radii in the 1 deg2 field surrounding VCC 1287. We found a mean of 6 objects expected within such a circle, with a standard deviation of 2.5 counts using our selection criteria, with no sky apertures with ≥18 objects. The identification of 18 GC candidates represents an overdensity with respect to the background level at ∼5σ significance. Subtracting this contamination rate left 11 GC candidates down to the GC turnover magnitude (i = 23.1, using I-band values of Kundu & Whitmore 2001 and an i-band transformation from Faifer et al. 2011).
Assuming that the GC luminosity function is bell-shaped (Harris et al. 2000), we doubled their number to obtain a total GC population of 22 ± 8 GCs, where the uncertainties come from the quadrature sum of the Poisson uncertainties and the background contribution.
This may not sound remarkable, but when normalized to the host galaxy magnitude using the "specific frequency" (SN; Harris & van den Bergh 1981), we find VCC 1287 has SN = 80 ± 29. This is a significant overabundance of GCs for VCC 1287's stellar luminosity (Figure 4).
2.2. GC Spectroscopy
GC candidates were selected for multi-object spectroscopy with the OSIRIS instrument on the Gran Telescopio de Canarias (GTC) in La Palma. We observed this spectroscopic mask of VCC 1287 centered on coordinates R.A. (J2000) = 12h 30m 23 65, decl. (J2000) = +13° 56m
  during the nights of 2015 June 19 and 20, under Director's Discretionary Time.
We placed slits (slit length typically 10'', slit width 12) on eight good candidates and the rest on lower-priority objects. The mask was observed for 4 hr in ∼08 seeing and clear conditions. We used a 2500I grating centered on the NIR calcium-triplet (CaT) region. To optimize sky subtraction, we nodded the objects along the slit in an A–B pattern.
Data were reduced with IRAF. Individual 2D spectra were cut from the CCD frame, bias-subtracted, and divided by dome flat-fields. Corresponding HgCdArXe arcs were cut out and a 2D wavelength calibration and distortion map were produced. Typical residuals were ∼0.05 Å. Difference spectra were produced by subtracting the observed spectra in an A–B, B–A pattern. These spectra were then wavelength calibrated, rectified in 2D, extracted, and combined as 1D spectra for analysis. The S/N of the spectra ranges from 7 to 25 Å−1. The spectral resolution is ∼5.5 Å (FWHM). Examples of the GC CaT spectra are shown in Figure 3.

Figure 3. Example CaT spectra of globular clusters around UDG VCC 1287. The top spectrum (GC16) has the highest S/N ∼ 25, the bottom spectrum (GC14) has one of the lowest (S/N ∼ 7). The positions of the CaT lines are indicated. The green lines show the best-fitting spectral model templates, as determined from cross-correlation, from the Vazdekis et al. (2003) CaT models. The spectra have been divided by a low-order polynomial fit to the continuum.
Download figure:
Standard image High-resolution imageVelocities were measured via Fourier cross-correlation against a wide range of model templates (Vazdekis et al. 2003), using FXCOR in IRAF. For robust velocities, we required a relative cross-correlation peak-height >3 and that at least two of the three CaT lines were visible in our spectra (Strader et al. 2011). We estimated velocity uncertainties using Monte Carlo simulations. We degraded high-S/N CaT models to the resolution and the range of S/N of our spectra and also mimicked sky-subtraction residuals by adding cosmic rays to the spectra with the FWHM corresponding to that of our spectral resolution. We generated 50 such spectra per S/N bin with a random seed and measured velocities with FXCOR. We took the standard deviation on the mean of these velocities as the typical velocity uncertainty for that S/N. For our spectroscopic sample, mean velocity uncertainties are ∼20 km s−1.
We identify seven objects with heliocentric velocities consistent with the Virgo cluster (cz = 1079 km s−1 ). For these objects, we measure a systemic velocity vsys =  km s−1 from a maximum likelihood estimator (Hargreaves et al. 1994). Six of seven objects are GCs associated with VCC 1287 (Table 1). We identify "N17" as the nucleus of the galaxy, being both centrally located and having a velocity (1066 ± 20 km s−1) close to the systemic velocity. We calculate the maximum likelihood line-of-sight velocity dispersion σlos of the GCs by excluding the nucleus,
  km s−1 within 8.1 kpc (the galactocentric radius of the outermost GC). Alternatively, if we include the nucleus we obtain vsys =
  km s−1,
  km s−1. Here, we assume that our measurement errors and the intrinsic system velocities have Gaussian distributions. The above uncertainties in the systemic velocity and velocity dispersion are equivalent to those from the marginalized probability distributions.
Table 1. Data for VCC 1287 GCs
| ID | R.A.(J2000) | Decl.(J2000) | u | g | r | i | z | R | RV |
|---|---|---|---|---|---|---|---|---|---|
| (degree) | (degree) | (AB mag) | (AB mag) | (AB mag) | (AB mag) | (AB mag) | ('') | (km s−1 ) | |
| GC10 | 187.6058982 | 13.9545477 | 25.34 ± 0.08 | 23.73 ± 0.04 | 23.28 ± 0.04 | 22.80 ± 0.04 | 22.57 ± 0.05 | 93.9 | 1071 ± 17 |
| GC11 | 187.5842242 | 13.9581670 | 23.97 ± 0.04 | 22.78 ± 0.02 | 22.23 ± 0.02 | 22.00 ± 0.02 | 21.75 ± 0.03 | 100.7 | 1030 ± 24 |
| GC14 | 187.5766787 | 13.9705079 | 24.17 ± 0.04 | 22.76 ± 0.02 | 22.10 ± 0.02 | 21.84 ± 0.02 | 21.68 ± 0.02 | 94.7 | 1035 ± 33 |
| GC15 | 187.6112049 | 13.9731678 | 24.28 ± 0.04 | 22.91 ± 0.02 | 22.33 ± 0.02 | 22.05 ± 0.02 | 21.95 ± 0.02 | 41.6 | 1040 ± 17 |
| GC16 | 187.5983017 | 13.9758545 | 23.51 ± 0.02 | 22.31 ± 0.01 | 21.79 ± 0.01 | 21.49 ± 0.01 | 21.37 ± 0.02 | 20.3 | 1088 ± 13 |
| N17a | 187.6018764 | 13.9803523 | 24.80 ± 0.06 | 23.13 ± 0.03 | 22.70 ± 0.03 | 22.47 ± 0.03 | 22.40 ± 0.05 | 0.17 | 1066 ± 20 |
| GC21 | 187.6034917 | 13.9959557 | 23.86 ± 0.03 | 22.57 ± 0.01 | 22.01 ± 0.02 | 21.75 ± 0.01 | 21.57 ± 0.02 | 56.6 | 1136 ± 13 |
| Star1 | 187.6339984 | 13.9077248 | 21.71 ± 0.01 | 20.67 ± 0.01 | 20.27 ± 0.01 | 20.16 ± 0.01 | 20.11 ± 0.01 | 284.5 | 197 ± 13 |
| Star2 | 187.6317882 | 13.9614617 | 24.45 ± 0.04 | 22.42 ± 0.01 | 21.40 ± 0.01 | 21.19 ± 0.01 | 20.98 ± 0.01 | 124.7 | 20 ± 15 |
| Star3 | 187.6353151 | 13.9254032 | 25.49 ± 0.08 | 23.01 ± 0.02 | 21.80 ± 20.01 | 20.84 ± 0.01 | 20.33 ± 0.01 | 229.7 | −51 ± 17 |
Note.
aNucleus of VC1287.Download table as: ASCIITypeset image
By comparison, the E + S0 galaxies in the Virgo cluster have σlos ∼ 590 km s−1, while dwarfs (dEs + dS0s) have σlos ∼ 649 km s−1 (Binggeli et al. 1985). Therefore, these GCs are not associated with the cluster potential, but rather belong to VCC 1287.
3. DYNAMICAL MASSES
We use two approaches to estimate the gravitating mass of VCC 1287, under the assumption that the GCs are in dynamical equilibrium. One is to assume that the velocity dispersion of the GCs is representative of the stars, allowing us to measure the mass of the system at the half-light radius of the galaxy. Specifically, we determine the "half-mass," M1/2, at one galaxy-light Re (Wolf et al. 2010):

This gives a mass of  M⊙ within 2.4 kpc. With Mg = −13.3, we calculate Lg = 2.3 × 10⁷ L⊙, yielding a mass-to-light ratio in the g-band,
  , within 1 Re.
The second approach is to determine the mass within the radius of the outermost GC. We use the "tracer mass estimator" (TME; Watkins et al. 2010), which requires as input the velocities of the tracers (vlos), the projected galactocentric radius (r) of the GCs to the outermost datum (rout), the slope of the gravitational potential (α), the GC orbital (an)isotropy (β), and the power-law slope of the GC density profile (γ):

where

and

with Γ(x) being the gamma function.
Here, we assume an isothermal potential (α = 0). DM-only numerical simulations suggest an inner mass distribution with α ≃ 0.5, whereas simulations that include baryons suggest α ≃ 1.0 (Schaller et al. 2015). Varying α based on these results changes the dynamical mass by a few percent. We assume isotropic orbits (β = 0). The assumption of isotropy in the presence of radial (β = 0.5) and tangential (β = −3.0) orbits causes mass over- and underestimates, respectively, of ∼10%. These uncertainties are smaller than the statistical uncertainties arising from the number of GC velocities measured.
We construct a surface density profile for the GC candidates identified from imaging (with six confirmed spectroscopically, excluding the nucleus). Fitting a power law ( ) to this profile in the radial range
  Re ≤ 3.6 gives γ = 1.2 ± 0.4.8
We also created a higher-S/N stacked density profile from 19 dwarf elliptical (dE) galaxies in the ACS Virgo Cluster Survey (Côté et al. 2004) selected to have independent distance measurements (Mei et al. 2007). Each profile was normalized by the respective galaxy's Re before stacking.
Re ≤ 3.6 gives γ = 1.2 ± 0.4.8
We also created a higher-S/N stacked density profile from 19 dwarf elliptical (dE) galaxies in the ACS Virgo Cluster Survey (Côté et al. 2004) selected to have independent distance measurements (Mei et al. 2007). Each profile was normalized by the respective galaxy's Re before stacking.
A power-law fit to this profile gives γ = 1.5 ± 0.1. Adopting this value in Equation (2) yields MTME = (4.5 ± 2.8) × 109M⊙ within 8.1 kpc. The mass from the TME yields  within 8.1 kpc. Note that the uncertainty in the slope of the surface density profile has a relatively small effect on the inferred masses. For example, using γ = 1.2 rather than γ = 1.5 in Equation (2) reduces the calculated mass by ∼10%.
The above results indicate that within both 1 Re and 8.1 kpc VCC 1287 has substantial DM. Using the relations of Zibetti et al. (2009), assuming a Kroupa initial mass function, we calculate a stellar mass, Mstar = (2.8 ± 0.4) × 107M⊙. Therefore, within 1 Re the DM fraction in VCC 1287 is ∼99%. Massive elliptical galaxies and Virgo dEs typically have DM fractions of <40% within 1 Re (Cappellari et al. 2006; Ryś et al. 2014; Tortora et al. 2016). Only the faintest dwarf systems in the Local Group are known to have similar or higher DM fractions (e.g., Wolf et al. 2010; McConnachie 2012)
4. THE VIRIAL MASS
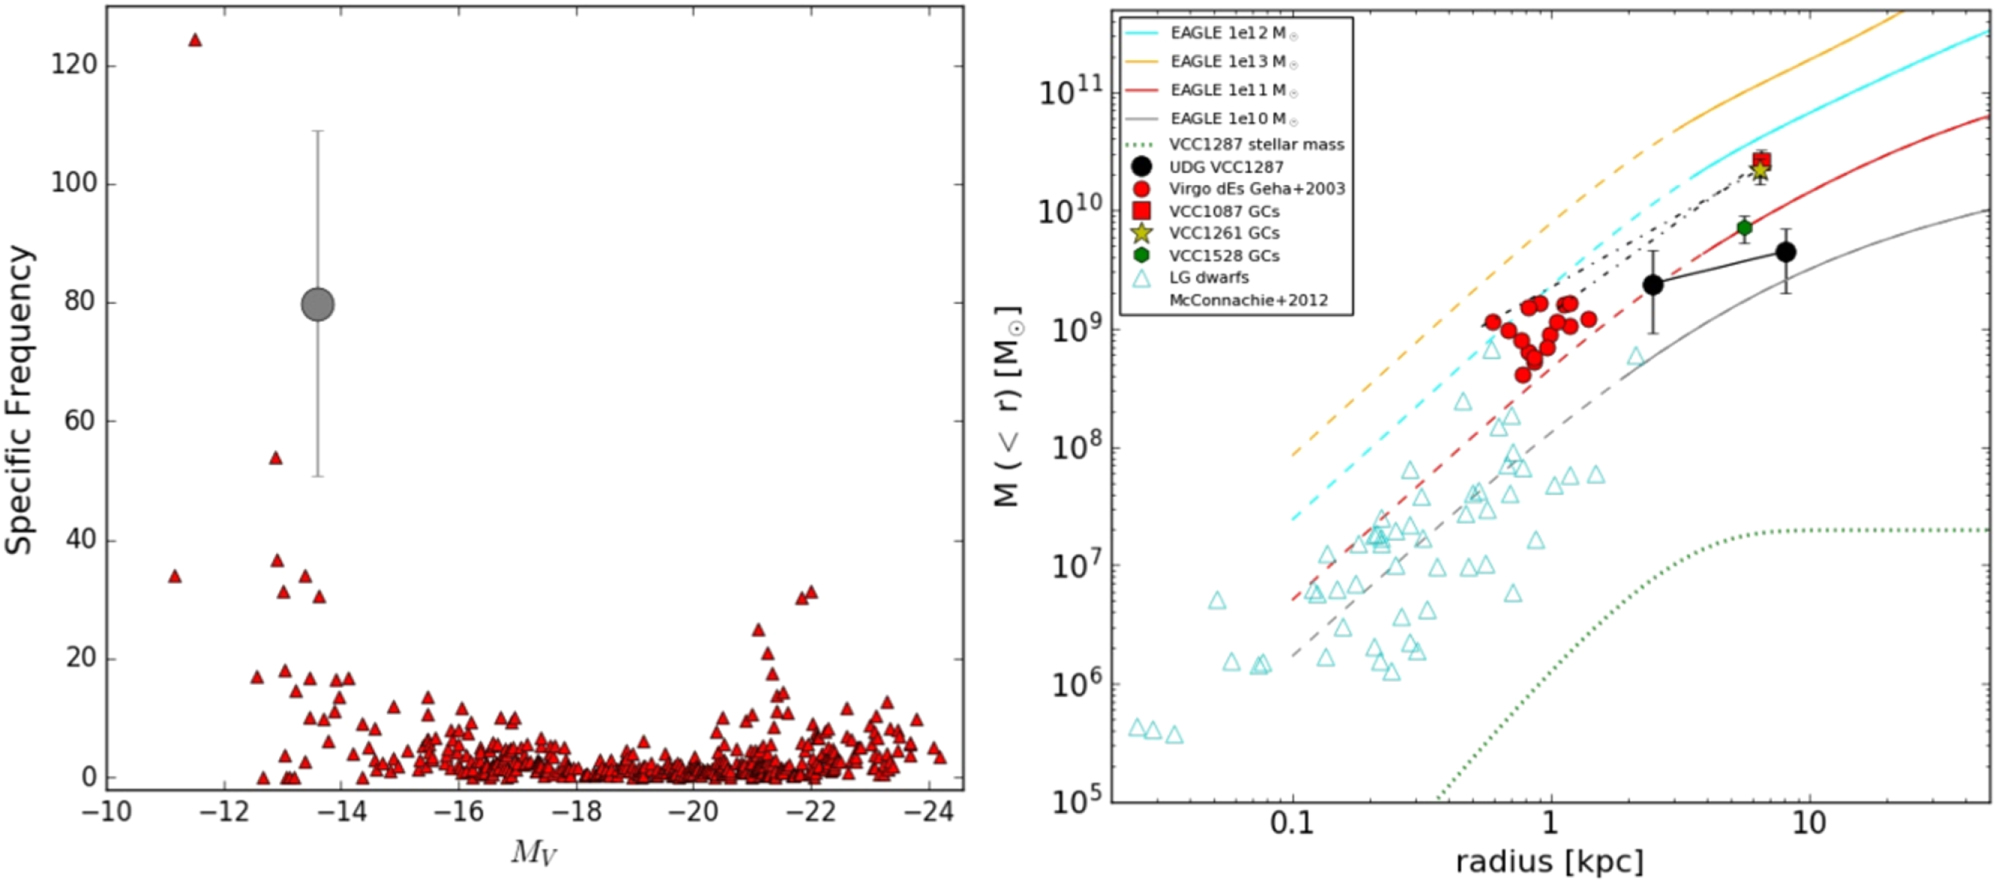
Determination of the total (virial) mass of the DM halo gives insight into whether we are dealing with a dwarf or giant galaxy. Since we cannot dynamically measure any mass beyond the radius of the outermost GC (Newton's theorem), we rely on numerical simulations to infer the halo mass of VCC 1287 using our observations as constraints. We use the EAGLE simulations (Crain et al. 2015; McAlpine et al. 2015; Schaller et al. 2015; Schaye et al. 2015) to determine the virial mass of the galaxy by comparing our mass measurements to cumulative mass profiles of the simulations (Figure 4). The EAGLE simulations include both DM and baryons, and therefore should give a realistic representation of inner mass distributions of halos within the DM paradigm. Using this approach, we obtain M200 = (8 ± 4) × 1010M⊙ from averaging the two mass measurements obtained from Figure 4. Here, M200 is the virial mass at the radius where the density is 200 times the critical density of the universe. This halo mass is similar to that reported for the Large Magellanic Cloud (van der Marel & Kallivayalil 2014).

Figure 4. Left panel: GC specific frequency of VCC 1287 compared to nearby galaxies (Harris et al. 2013). VCC 1287 is a clear outlier with a very large number of GCs for its luminosity. Right panel: mass of VCC 1287, Local Group dwarf galaxies (McConnachie 2012), and Virgo dEs (Geha et al. 2003) compared to the cumulative mass profiles from EAGLE simulations (Schaller et al. 2015). The measurements for VCC 1287 are not independent (see the text). The long-dashed curves indicate the convergence radius for that halo mass. Short-dashed curves connect inner and outer mass measurements obtained for two Virgo dEs obtained from the stars and GC systems, respectively (Beasley et al. 2009). The dotted curve shows the cumulative stellar mass profile for VCC 1287 from our surface photometry.
Download figure:
Standard image High-resolution imageTo check this approach, we also ran spherically symmetric, isotropic Jeans-mass models using DM-only mass distributions and obtained  M⊙, in good agreement with our estimates from the EAGLE simulations.
Inferring virial masses is model dependent, so we sought an additional, independent check of our mass determinations. Harris et al. (2013) obtained the remarkable result that the ratio of the total mass in GCs in a galaxy (MGCS) to the galaxy halo mass (Mhalo) is constant over ∼6 decades in galaxy luminosity, specifically, MGCS/Mhalo = 6 × 10⁻⁵. In other words, the virial mass of a galaxy can be determined by totaling the mass in its GC system. We have already seen that VCC 1287 possesses a very large number of GCs for its stellar luminosity (Figure 4). Using the relation of Harris et al. (2013), with 22 ± 8 GCs, we obtain Mhalo (GCs) = (7.3 ± 2.7) × 1010M⊙. This halo mass is in excellent agreement with our dynamical inference.
5. DISCUSSION
Much work in recent years has focused on the efficiency of star formation in DM halos of a given mass (e.g., Behroozi et al. 2013; Moster et al. 2013; Brook & Di Cintio 2015; Tollet et al. 2016). One way to quantify this is using the Mstar–Mhalo relation. This relation is shown in Figure 5 for our dynamically based M200 and for the counting GC-based Mhalo for VCC 1287 and selected galaxies.

Figure 5. Left panel: Mstar–Mhalo relation for VCC 1287 (gray circle with error bars) compared to nearby galaxies (Harris et al. 2013), with masses based on counting GCs. Stellar mass-to-light ratios were obtained from Zibetti et al. (2009), with B − V colors from HyperLeda (green triangles). Right panel: Mstar–M200 relation for VCC 1287 based on our dynamical masses compared to nearby galaxies (red triangles; Harris et al. 2013), dEs (yellow circles; Geha et al. 2003), and Local Group dwarfs (green stars; McConnachie 2012). Masses for all these galaxies have been derived using the same methodology for which we derived the VCC 1287 mass. The dwarf-galaxy regime is sparsely sampled since we only show galaxies within at least 50% of the EAGLE simulations convergence radius. Also shown are 2582 central galaxies from EAGLE (cyan squares).
Download figure:
Standard image High-resolution image
Figure 5 shows that VCC 1287 is an outlier independent of the method used to determine  . Its location with respect to "normal" galaxies suggests that its stellar mass is very low for its halo mass. In this context, VCC 1287 would need to have a stellar mass that is a factor of ∼100 larger (∼5 mag brighter) in order to be centered in these relations. We measure a stellar fraction (Mstar/Mhalo) of ∼3.5 × 10⁻⁴, whereas "normal" galaxies at this halo mass have Mstar/Mhalo ∼ 1 × 10⁻².
A halo-to-stellar mass ratio of ∼3000 is unprecedented for any galaxy besides a dwarf spheroidal. It suggests that galaxy formation is highly stochastic for halo masses of ∼1010–1011M⊙, with stellar masses varying by factors of 100 or more at fixed halo mass. This idea has been suggested as a solution to the problem of missing massive Milky Way satellites—the so-called "too big to fail" problem (Boylan-Kolchin et al. 2011). However, the stochastic solution has been generally rejected as implausible, with extreme stochasticity in simulations expected to set in at much lower masses (Brook & Di Cintio 2015; Sawala et al. 2015; Wheeler et al. 2015). The results for VCC 1287 raise the possibility that there are unidentified massive galaxies lurking at still lower SBs and that these DM halos are not too big to fail.
Key questions are what is the formation history of this system, and is this typical of all UDGs? We reject the idea that VCC 1287 is a tidal-dwarf system, as these are expected to have total DM fractions of less than 10% (Bournaud et al. 2007).
We cannot currently rule out that this is a tidally stripped system, but this interpretation is not favored by us. We see no obvious tidal features in our imaging. In addition, simulations suggest that in order to affect the stars and GCs, more than 90% of the DM must first be removed and that the more spatially extended GC system is affected before the stars (Smith et al. 2015). We have shown that VCC 1287 has an unusually rich system of GCs for its stellar mass, so any tidal mechanisms must preferentially remove stars over GCs. However, obtaining deeper imaging of this system in order to look for low surface brightness tidal features would be very useful.
In a general sense, this may be a "quenched" system (Boselli & Gavazzi 2014): perhaps a massive dwarf galaxy that had its star formation halted early due to gas starvation as it fell into the Virgo cluster and was therefore unable to grow in stellar mass as it has in DM. Assuming there are old (∼10 Gyr) stars in VCC 1287, then the galaxy colors suggest it has low metallicities, [Fe/H] ∼ −1.5 (Vazdekis et al. 2010). Such low metallicity is expected in mass–metallicity relations (e.g., Caldwell 2006) and could be consistent with the early quenching of a dwarf-mass system. However, we note that the galaxy might have a younger luminosity-weighted age, which we cannot rule out with our current photometry.
To address the question of whether VCC 1287 is typical of UDGs, total masses for more UDGs must be obtained. Determining stellar velocity dispersions for these faint systems is expensive (or impossible) for 10 m class telescopes. Here, we have demonstrated a more inexpensive route through the kinematics of GC systems, at least for UDGs out to Virgo cluster distances.
However, we suggest the most efficient approach comes from simply counting up the number of GCs in UDGs. We find excellent agreement between the halo masses inferred from dynamics and from counting GCs for VCC 1287, and this approach offers an inexpensive route to obtaining virial masses for UDG systems out to Coma distances (see also Mihos et al. 2015). For example, based on the calibrations of Harris et al. (2013), for "dwarf-mass" halos (Mhalo ≈ 1010 M⊙) we would expect ∼5 GCs in a UDG. For a quenched Milky-Way-like galaxy (Mhalo ≈ 1012 M⊙) we would expect ∼200 GCs.
Relatively shallow Hubble Space Telescope imaging (or deeper, multi-band ground-based imaging) of these systems will allow for estimates of the total GC populations of UDGs, hence Mhalo, and ultimately a better understanding of these galaxies.
We thank Giuseppina Battaglia for use of her maximum likelihood code, Claudio dalla Vecchia for assistance with the EAGLE simulations, and Jesus Falcón Barroso and Nacho Trujillo for useful discussions. M.A.B. and I.M.N. were supported by the Programa Nacional de Astronomía y Astrofísica from the Spanish Ministry of Economy and Competitiveness, under grants AYA2013-48226-C3-1-P, AYA2013-48226-C3-2-P, and AYA2013-48226-C3-3-P. M.B. acknowledges financial support from MINECO under the 2011 Severo Ochoa Program MINECO SEV-2011-018. A.J.R. was supported by NSF grant AST-1515084. D.M.D. acknowledges support by the Sonderforschungsbereich (SFB) 881 of the German Research Foundation (DFG). This article is based on observations made with the Gran Telescopio Canarias (GTC), installed in the Spanish Observatorio del Roque de los Muchachos of the Instituto de Astrofísica de Canarias, on the island of La Palma. We acknowledge the Virgo Consortium for making their simulation data available. The EAGLE simulations were performed using the DiRAC-2 facility at Durham, managed by the ICC, and the PRACE facility Curie based in France at TGCC, CEA, Bruyères-le-Châtel.
Footnotes
- 8
We measured the surface density profile, which goes into the TME prefactor as a volume density profile, i.e., γ + 1 in Equation (3).