


Abstract
The Presolar Grain Database (PGD) contains the vast majority of isotope data (published and unpublished) on presolar grains and was first released as a collection of spreadsheets in 2009. It has been a helpful tool used by many researchers in cosmochemistry and astrophysics. However, over the years, accumulated errors compromised major parts of the PGD. Here, we provide a fresh start, with the PGD for silicon carbide (SiC) grains rebuilt from the ground up. We also provide updated rules for SiC grain type classification to unify previous efforts, taking into account newly discovered grain types. We also define a new grain type D, which includes some grains previously classified as ungrouped. Future work will focus on rebuilding the PGD for other kinds of presolar grains: graphite, oxides, silicates, and rarer phases.
Export citation and abstract BibTeX RIS

Original content from this work may be used under the terms of the Creative Commons Attribution 4.0 licence. Any further distribution of this work must maintain attribution to the author(s) and the title of the work, journal citation and DOI.
1. Introduction
Ancient stardust grains, termed presolar grains, were first isolated from meteorites more than three decades ago (Bernatowicz et al. 1987; Lewis et al. 1987; Amari et al. 1990). Since then, many thousands of individual grains have been analyzed for their isotopic composition, often in an automated way to facilitate the identification of rare and exotic grains. The study of such grains allows analysis of the products of nucleosynthesis in individual stars directly in the laboratory, making astrophysical observations not with telescopes but with microscopes and/or mass spectrometers. Each of these stardust grains samples material from the winds or from the explosive ejecta that occur during the late stages of stellar evolution. Therefore, they are also often called circumstellar grains. The isotopic compositions of stardust grains constrain stellar nucleosynthesis models at a level of detail far beyond that achievable with telescopic observations.
In order to make isotope data of individual presolar grains more readily accessible to the broader astrophysical and cosmochemical communities, the Presolar Grain Database (PGD), containing the vast majority of isotope data (published and unpublished) on presolar grains, was first released in 2009 as a collection of spreadsheets (Hynes & Gyngard 2009). The PGD was initially compiled and maintained by students at Washington University in St. Louis and occasionally updated and corrected over the years. After some time, however, it became apparent that accumulated errors have compromised major parts of the PGD, and, at the Presolar Grains Workshop in Chicago in 2019, the future of the PGD was discussed. Since the PGD has become an indispensable tool for many researchers in cosmochemistry and astrophysics, we decided to rebuild the PGD from the ground up by (1) eliminating known errors; (2) searching for inconsistencies by comparing with publications, original data files, and/or personal compilations; and (3) updating and adding data that have been reevaluated and/or published. Many of the accumulated errors in the old PGD were the result of bad practices and sloppy handling of the database. It became apparent that the database had been resorted several times and some entries in columns of the spreadsheet had obviously shifted by one or a few cells in between. This led to incorrectly assigned data for some isotope systems, e.g., 14N/15N ratios, for many grains.
Our initial effort focused on silicon carbide (SiC) grains, which are by far the best-studied variety of presolar grains, and we put the first version of the new PGD for SiC grains online in 2019 December (Stephan et al. 2020).
In this paper, we review the current state of the PGD and future plans. Section 2 describes the data that have been included and how to use the database. Section 3 focuses on a new grain classification scheme used in the PGD, ambiguities in type definitions, and provides a general overview of possible stellar sources. Section 4 summarizes our findings and gives an outlook for future developments regarding the PGD.
2. The Presolar Grain Database
As of this writing, the PGD for SiC grains contains isotope records for 20,230 individual grains. The various fields for each record are described below in the same order as they appear in the new PGD spreadsheet.
2.1. PGD ID
In our evaluation of the old PGD, we found that many grains had multiple entries in the database, often because they had been analyzed in various measurement sessions, sometimes in different laboratories, and often using inconsistent grain labels. We therefore introduced a new specific label for each grain in the database called PGD ID, which is not meant to replace a grain label defined by the original authors, but to prevent confusion from inconsistent nomenclatures used. The PGD ID (e.g., SiC-2001-AMA-000001) consists of four sections separated by hyphens. The first section denotes the phase (e.g., SiC). The second part is the year data for the grain appeared for the first time in a publication (0000 for data not related to any publication). In general, we try to avoid citing conference abstracts and refer to refereed publications. However, there are some exceptions where data have never appeared in any refereed literature, so some extended abstracts had to be cited. In the third section, the first three letters of the first author's surname are given (e.g., AMA stands for Amari). Should the first author have a two-letter surname, the first letter of the first name is added after the surname. The fourth part is a six-digit number denoting the individual grain. If a first author has published more than one paper with grain data in one year, we skip numbers to the next 100,000 in the fourth part of the PGD ID (e.g., SiC-2001-AMA-100001 denotes the first grain of a series described by Amari et al. in a second paper from 2001). A specific ID will only be assigned once. If it turns out in the future that one grain has more than one ID, the data will be consolidated, and the obsolete IDs will be retired. A list of such obsolete PGD IDs will be provided as part of the PGD, and all changes to the PGD will be documented. PGD IDs will only be assigned and approved by the person managing the PGD (currently Thomas Stephan) and not by any researcher submitting data to be included in the PGD. We follow this rule strictly to avoid any confusion or use of unauthorized IDs.
2.2. PGD Type
SiC grains have been classified into many types, also referred to as populations or subgroups, such as mainstream, X, Y, Z, etc. (e.g., Anders & Zinner 1993; Davis 2011; Zinner 2014). However, over the last three decades, type definitions have changed, and new types have been discovered. We also came to the realization that different researchers have used slightly different definitions for the various types. Therefore, we tried to unify these different definitions and come up with an automated type assignment based on carbon, nitrogen, silicon, and aluminum isotope ratios. We call this the PGD Type as it should not be confused with the type assigned in the original study. Since there are many grains for which only partial data are available, we have also set rules about how to deal with missing data. The exact type definitions used and the probable stellar sources they are associated with are discussed in Section 3.
2.3. PGD Subtype
As will be discussed in Section 3, some types (X, AB, C) have been further subdivided into subtypes (e.g., X0, X1, and X2). Analogous to the PGD Type, we therefore also assign a PGD Subtype wherever possible. If no subtype is defined or cannot be determined from the available data, this field remains empty.
2.4. Type
The type, and in some cases subtype, assignments made in the original studies are given in the field labeled Type. For approximately 95% of all SiC grains in the PGD, the original type assignment agrees with the PGD Type. However, we encourage the community to use the PGD Type in future studies as it unifies previous, often inconsistent definitions, which were typically based on limited data sets.
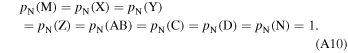
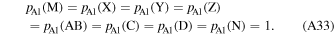
2.5. Probabilities p(M), p(X), p(Y), p(Z), p(AB), p(C), p(D), and p(N)
The probabilities that a grain is consistent with the definition of a given PGD Type, p(M), p(X), p(Y), p(Z), p(AB), p(C), p(D), and p(N), are provided in the PGD. They are calculated according to mathematical rules laid out in Section 3 and the Appendix.
It is important to mention that the probabilities for being consistent with the various types do not add up to 1, because these terms describe the probability of a grain being consistent with a specific grain type but not the probability of being of that grain type. A grain can be consistent with more than one grain type due to overlap in their definitions and uncertainties in the grain data.
2.6. Grain Label
The Grain Label is the name a grain was given in the original study or published article. In cases where different names have been given to the very same grain, all names are provided. While the grain label is usually the name a grain should be referred to when mentioning a grain from a specific study, these labels are in some cases not unique. Therefore, when grain data from different studies are discussed, the PGD ID can be used as a unique identifier.
2.7. Reference
Reference refers to the main publication where data for the grain has usually been reported for the first time. It is also the reference that has been used for parts two and three of the PGD ID. We provide in this field the reference in an abbreviated format. In addition, we provide a table where the full references are given as part of the PGD. In cases where additional isotope data have been provided in other publications, these are mentioned as part of the Notes (see Section 2.12).
2.8. Data Published
The field Data Published has three possible entries. Here, Full means that the complete data shown in the PGD for the specific grain have been published. No is used in the case where no tabulated grain data have been published. This could still mean that the data is associated with a specific publication, e.g., only used for a plot, but none of the individual grain data has been tabulated in the paper nor is any supplementary material available to the reader. Partial stands for the case where only part of the data, i.e., data only for some elements but not for others, have been published. Unpublished data were provided directly by the authors to the PGD as spreadsheets. Even where data are labeled Full, we often relied on data from unpublished spreadsheets, as they contain more digits than are available in the published literature. This became especially important in cases where only rounded numbers had been published, not providing all significant digits.
2.9. Source
Source usually names the meteorite the presolar grain was found in or extracted from. There are a few exceptions, e.g., for grains from the Hayabusa2 mission, for which the source is the asteroid Ryugu, and grains from interplanetary dust particles, given as IDP.
2.10. Technique
Technique names the laboratory or laboratories and instrument(s) where the data have been collected. In the main spreadsheet of the PGD, we use an abbreviated form, which is further explained in a separate spreadsheet also provided.
2.11. Size a and Size b
The size of a grain is given in micrometers in those cases where this information is available. This could be a single number, given as Size a, referring to the longest dimension or an average dimension. In some cases, two dimensions are given, Size a and Size b, which usually refer to the longest dimension and the dimension perpendicular to it. There is no real standard for how these were determined. Therefore, users of the PGD should exercise caution in using this information and refer to the original publication if needed.
2.12. Notes
The Notes give additional references if part of the data was published separately. Other additional information about any specific grain is also mentioned here, including information about typographical errors found in the literature.
2.13. Isotope Data
The following fields contain the Isotope Data for each grain. The number of SiC grains with isotope data for a specific element in the PGD are shown in Figure 1. Isotope data that have been measured on SiC bulk samples instead of single grains have not been included in the PGD. Some isotope data on single grains for elements like hafnium, tungsten, and europium have not been included as they have been measured only in very few grains, which showed in almost all cases no significant deviation from solar isotope ratios for these elements (Ávila et al. 2012, 2013).

Figure 1. A periodic table of the elements showing for each element the number of SiC grains with data in the PGD.
Download figure:
Standard image High-resolution imageFor 7Li/6Li, 11B/10B, 12C/13C, 14N/15N, 26Al/27Al, 44Ti/48Ti, and 51V/48Ti, data are provided as atomic ratios. For all other ratios, δ-values are used, giving the permil deviations of an isotope ratio i A/j A measured in a grain from that measured in a standard typically representing terrestrial isotope ratios:
While different terrestrial standards are used in different laboratories, isotopic variations among terrestrial materials are considered negligible when compared to isotopic anomalies in presolar grains and taking into account typical precisions in grain analysis. Therefore, grain data are not renormalized to compensate for any differences in standards.
Wherever original data were available, we did not round the data to any specific number of digits but provide all digits reported.
Errors are given as 1σ uncertainties as provided in the original studies, again with all digits reported. For carbon and nitrogen isotope ratios, we provide asymmetric errors σ+ and σ− if these are available. Such asymmetric uncertainties can include infinity, which occurs when the measured intensity of the denominator isotope is less than 1σ from zero. In such cases, we use 106 as the positive uncertainty and mention this in the notes. In some grains from two studies (Hoppe et al. 1996a, 1996b), zero counts were detected for 15N. In these cases, Hoppe et al. (1996b) assumed 0.69 counts for 15N, calculated the 14N/15N ratio, and reported uncertainties of zero (positive and negative). We reported these numbers as in the original studies but mentioned in the notes that zero counts were detected for 15N.
In some other cases, uncertainties were reported as zero in the original studies due to rounding the data to a certain number of digits. If a number reported with zero uncertainty is rounded to n digits behind the decimal point, we assumed an uncertainty of 0.5 × 10−n . For example, a 12C/13C ratio of 3.0 ± 0.0 reported for grain SiC-1993-ALE-000092 (grain C23 from Alexander 1993) is now listed as 3.0 ± 0.05, which can be taken as an upper limit for the uncertainty. This avoids mistakes that could arise from applying zero uncertainty, which would have no physical meaning in this context. However, to be fully transparent here, we also provide notes specifying how the errors were originally reported.
For some elements, currently silicon and molybdenum, error correlation coefficients for isotope δ-values are provided for some grains. These correlation coefficients, designated as rho (ρ) in the PGD, were typically not given in the original publication but could be retrieved from laboratory records. In the case of silicon, this error correlation typically stems from variations in instrumental mass fractionation leading to correlated errors. Molybdenum isotope ratios have substantial error correlation due to the normalization to 96Mo, whose uncertainty contributes significantly to the overall uncertainties of these ratios. Error correlation leads to error bars or error ellipses that are not parallel to the major axes of a three-isotope plot. The details of error correlation in three-isotope plots have been discussed by Stephan & Trappitsch (2023b).
Aluminum isotope data are inferred 26Al/27Al ratios, as there is no live 26Al (half-life 0.717 Ma) found in these grains. The 26Al concentration at the time the SiC grain formed is inferred from the concentration of its decay product 26Mg. There is usually a negligible amount of 24Mg and 25Mg in presolar SiC grains, and any detection of these isotopes is typically attributed to terrestrial or asteroidal contamination. Magnesium-26 is corrected for such contamination by assuming solar magnesium isotopic ratios for the contaminant. Large variations in 25Mg/24Mg have been reported in presolar silicates (Hoppe et al. 2022), but such variations have not been found in presolar SiC, for which contamination is the major source of magnesium. Another contaminant that could affect inferred 26Al/27Al ratios is stable 27Al, leading to underestimated 26Al/27Al ratios (Groopman et al. 2015). To minimize contributions from contamination, ion imaging and/or depth profiling can be used to avoid sampling any meteoritic or other material not part of the SiC grains (Groopman et al. 2015; Liu et al. 2021; Hoppe et al. 2023). To assess the role contamination could have played in calculating inferred 26Al/27Al ratios, users of the PGD are encouraged to consult the original literature, which could provide further information on data corrections applied. However, one major caveat remains, since, for calculating an inferred 26Al/27Al ratio, relative sensitivities between magnesium and aluminum have to be determined. This would ideally require measuring a SiC standard with a significant and known Mg/Al ratio. As such standards do not exist, and oxygen-rich standards are used instead, there remains significant uncertainty about the accuracy of reported 26Al/27Al ratios (Liu et al. 2021; Hoppe et al. 2023).
Similar to the case of 26Al measured as 26Mg, the presence of 44Ti (half-life 59.1 yr) in presolar grains is inferred from its stable decay product 44Ca and reported as 44Ti/48Ti ratios in the PGD.
Vanadium data are reported as 51V/48Ti ratios as the low-abundance isotope 50V has not been measured in such grains. The reported ratio might be helpful for assessing the presence of 49V (half-life 330 days) as a possible source of some 49Ti in some grains (Hoppe & Besmehn 2002; Lin et al. 2010; Liu et al. 2018a).
3. SiC Grain Types
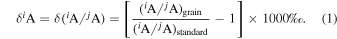
Grain type classification historically relies on carbon, nitrogen, and silicon isotopic, as well as inferred 26Al/27Al ratios (Zinner 2014), as these are the elements with the highest abundances in presolar SiC. Different grain types are typically defined by ranges in isotopic ratios specified by lower and/or upper limits for isotope ratios of a specific grain type. For silicon isotopes, these limits are lines in a three-isotope diagram, and different grain types populate different regions in this diagram, with the limits often not being parallel to the plot axes (e.g., Figure 2(b)).
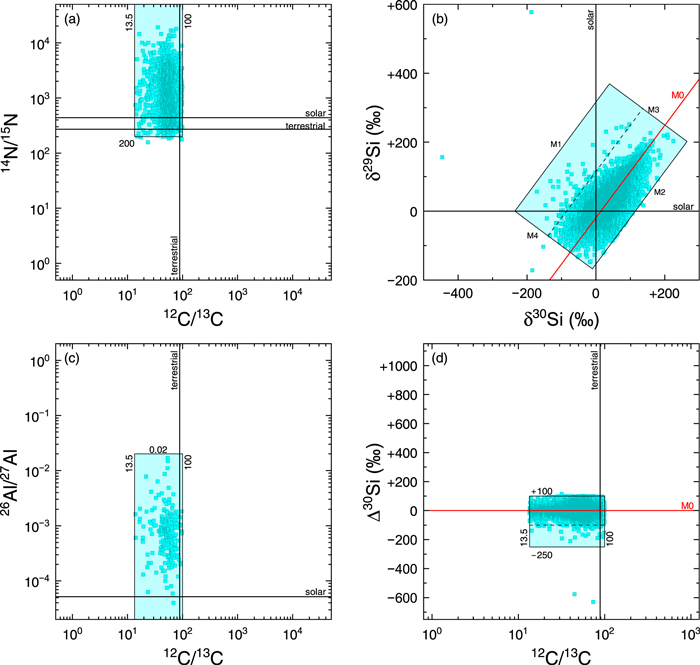
Figure 2. Carbon, nitrogen, silicon, and inferred aluminum isotope ratios of individual presolar SiC mainstream grains from the PGD. Horizontal and vertical solid lines show solar and terrestrial values for comparison. Colored areas show the ranges allowed for mainstream grains. Data points outside the colored areas have large uncertainties (not shown here) such that they are still consistent with being mainstream grains. Most mainstream grains plot in the silicon three-isotope plot (b) between the dashed line and the line marked M2 around the mainstream weighted regression line (M0) drawn in red. However, we extend the allowed area for mainstream grains to the line marked M1 to include the tail of the distribution. The horizontal line in panel (c), labeled solar, refers to the initial 26Al/27Al ratio of the solar system (5.2 × 10⁻⁵; Jacobsen et al. 2008). Shown in (d) is the horizontal distance from the mainstream line (Δ30Si) plotted against the carbon isotope ratio. Further details are given in the main text and the Appendix.
Download figure:
Standard image High-resolution imageIt should be emphasized here that grain type definitions are based on the isotopic compositions of the grains and not on models of stellar nucleosynthesis. It is through the comparison of grain data with models that models are constrained and the origins of different kinds of grains in different kinds of stars are inferred, but the models do not determine the classification.
The original definitions of grain types have often been based on a limited number of grains that were obvious outliers on isotope diagrams, but, as the database has grown, clear boundaries between many of the groups have disappeared. For this reason, the limits that delineate them are for the most part arbitrary and have changed over the years due to the increasing amount of grain data. Nevertheless, it seems clear that the different SiC grain types reflect differences in the nature of their parent stars. Moreover, recent cluster analysis studies of the SiC grain data have largely reproduced the previously defined grain types, while revealing some subtleties missed by manual analysis (Boujibar et al. 2021; Hystad et al. 2022). Here, we have applied limits based on the full data set of the PGD, while trying to maintain existing classification where possible and to eliminate inconsistencies of previous work.
In order to calculate the most probable grain type for a given SiC grain, we developed a series of mathematical rules defining allowed ranges for 12C/13C, 14N/15N, and inferred 26Al/27Al ratios, as well as areas in a silicon three-isotope plot for each grain type. We then calculated from the isotope ratios and their uncertainties the probability that a given grain is consistent with a specific type. The maximum probability found for any type then defines the PGD Type of a grain.
For example, the probability that a grain is consistent with the definition of a mainstream (M) grain calculates as

The factors pC(M), pN(M), pSi(M), and pAl(M) denote the probabilities that the grain data are within the allowed ranges for carbon, nitrogen, silicon, and aluminum isotope ratios for mainstream grains. To determine the individual probabilities, we use the cumulative normal distribution function to calculate the probability for a number, given its value and uncertainty, to be above or below a certain threshold number, defining the limits for a range of isotope ratios or δ-values for a specific grain type. The assumption that ratios or δ-values are normally distributed is not entirely correct but serves as a valid approximation in this context.
For example, as will be discussed in Section 3.2, 14N/15N ratios for X grains are below the terrestrial ratio of 272. Therefore, the probability for a grain to be consistent with that range is

with

where χ is the unitless distance between the limit λ and the measured isotope ratio or δ-value of a grain μ expressed as multiples of the 1σ measurement error:

In cases with asymmetric errors, we use σ+ if μ < λ and σ− if μ > λ.
The probability that a measured value is above a certain limit is

For silicon, data for all three isotopes 28Si, 29Si, and 30Si are available for most grains. Results are typically displayed as three-isotope diagrams with δ29Si plotted against δ30Si. Here, we use the short notation

As mentioned before, the different grain types populate different regions in this diagram, with the limits often not being parallel to the plot axes. Furthermore, the measurement errors are often correlated, leading to error ellipses around data points with ellipse axes not parallel to the major axes of the diagram. In such cases, one has to determine the Mahalanobis distance, which is the multidimensional generalization of the unitless distance between a data point and a multivariate distribution expressed as multiples of the standard deviation analogous to Equation (5). It is the same distance as used to calculate the mean squared weighted deviation (MSWD), also known as reduced χ2, describing the goodness of a fit between a regression line and the underlying data (Stephan & Trappitsch 2023b).
For a line defined by

the distance between that line and a data point (x, y) with uncertainties σx and σy , and an error correlated coefficient ρxy , becomes

The minus sign here ensures that the distance χ is positive if the data point lies below the line (y < a+ bx). This allows the use of Equation (4) to define the probability of a data point to be below a given line in the silicon three-isotope diagram:
The exact definition for each probability factor for each PGD Type is given in the Appendix. After calculating the total probability for each grain being consistent with each type using equations analogous to Equation (2), we search for the maximum total probability. If this maximum is <0.01, we classify the grain as type U (ungrouped or unknown). Type U is also assigned to grains for which neither carbon, nitrogen, nor silicon data are available. To prevent marginal differences in total probabilities from leading to different grain type identifications, we round the total probabilities to three digits after the decimal point. Should two or more total probabilities be the same for a given grain, we use the following order of precedence: M–AB–Y–Z–X–C–N–D, which means that, e.g., a grain is labeled as mainstream grain if p(M) is the maximum probability even if the same probability has been calculated for any other type. This sequence is guided by the relative abundances of grain types in unbiased samples (see Section 3.10).
Table 1 summarizes the changes between the original grain type assignments, made in the initial studies the data are taken from, and the PGD Type.
Table 1. Number of Grains Attributed to Each of the Different Types According to the Original Classification and to the PGD Type
| Original Type Assigned | |||||||||||
|---|---|---|---|---|---|---|---|---|---|---|---|
| M | X | Y | Z | AB | C | D | N | U | Sum a | ||
| PGD Type | M | 16,439 | 15 | 7 | 358 | 12 | 0 | 0 | 0 | 79 | 16,910 |
| X | 12 | 702 | 1 | 3 | 0 | 0 | 0 | 3 | 9 | 730 | |
| Y | 82 | 1 | 716 | 13 | 0 | 1 | 0 | 0 | 3 | 816 | |
| Z | 39 | 0 | 0 | 244 | 0 | 0 | 0 | 0 | 1 | 284 | |
| AB | 195 | 1 | 1 | 17 | 1082 | 0 | 0 | 11 | 5 | 1312 | |
| C | 1 | 0 | 1 | 0 | 0 | 17 | 0 | 0 | 4 | 23 | |
| D | 1 | 3 | 1 | 0 | 0 | 2 | 0 | 0 | 3 | 10 | |
| N | 0 | 0 | 0 | 4 | 4 | 1 | 0 | 16 | 0 | 25 | |
| U | 17 | 2 | 0 | 0 | 0 | 0 | 0 | 0 | 101 | 120 | |
| Sum b | 16,786 | 724 | 727 | 639 | 1098 | 21 | 0 | 30 | 205 | 20,230 | |
Notes.
a Number of grains in new classification. b Number of grains in original classification.Download table as: ASCIITypeset image
In the following, we give a more general description of the various PGD Types, how they are defined and briefly mention their possible stellar sources. For a more comprehensive discussion of stellar sources, the reader is referred to the literature (e.g., Zinner 2014 and references therein), although such literature is often based on a heavily compromised older version of the PGD.
3.1. Mainstream Grains
The vast majority of grains are so-called mainstream grains, labeled with M in the PGD. They are defined by having 12C/13C ratios between 13.5 and 100, 14N/15N ratios above 200, inferred 26Al/27Al ratios lower than 0.02, and silicon isotopes that fall along the so-called mainstream line in the silicon three-isotope plot. These areas and mainstream grain data are shown in Figure 2.
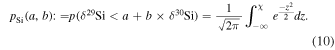
We chose a 12C/13C ratio of 13.5 to separate mainstream grains from AB grains since it represents a minimum in a histogram of 12C/13C ratios of mainstream, AB, and Y grains (Figure 3). However, since the distribution of 12C/13C ratios is rather flat between 13.5 and 25 (Figure 3), grains with ratios up to 25 could still be classified as AB grains, if nitrogen or inferred aluminum isotope ratios exclude them from being identified as mainstream grains. The upper limit of 100 for the 12C/13C ratio, which separates mainstream grains from Y grains, cannot be inferred from the distribution shown in Figure 3 but was arbitrarily defined and has been used consistently throughout the literature (e.g., Hoppe & Ott 1997; Amari et al. 2001c; Nittler & Alexander 2003; Zinner 2014). As discussed in Section 3.3, there seems to be a more gradual difference between mainstream and Y grains. Adopting a value of 100, significantly above the terrestrial 12C/13C ratio of 89, ensures that mainstream grains compromised by terrestrial or meteoritic carbon contamination are not falsely classified as Y grains. Such contamination is probably responsible for the minor peak around the terrestrial value in Figure 3. While there is some indication that the solar 12C/13C ratio is slightly higher, ∼93.5, than the terrestrial value (Lyons et al. 2018), such subtle differences play no role here in the context of presolar grains. For the mainstream grains, we observe a maximum in the distribution of 12C/13C ratios at ∼52 (Figure 3).
Figure 3. Histogram showing the distribution of 12C/13C ratios for mainstream, AB, and Y grains.
Download figure:
Standard image High-resolution imageParameters for the mainstream line in the silicon three-isotope diagram have been determined iteratively, calculating the weighted regression line (Stephan & Trappitsch 2023b) through all grains initially classified as mainstream grains and then reclassifying the grains using the newly calculated regression line. After a few iteration steps, the line parameters converged to

which is based on data of 15,606 mainstream grains.
These parameters are in good agreement with previously reported values (Hoppe et al. 1994; Lugaro et al. 1999; Nittler & Alexander 2003; Zinner et al. 2007; Zinner 2014).
The MSWD value of the regression line is 2.433. An MSWD value significantly greater than 1 shows that silicon isotopes in mainstream grains do not form a simple line but might be interpreted as a band, with a certain width.
We define the distance in δ30Si from the mainstream regression line as

Most mainstream grains plot in a band defined by –100‰ < Δ30Si < +100‰ about the mainstream regression line (Figures 2(b) and 4). However, there are 58 grains with more negative Δ30Si values that we also include in our definition of mainstream grains, because they seem to be part of the distribution shown in Figure 4. We, therefore, define –250‰ < Δ30Si < +100‰ as the range for mainstream grains in Δ30Si. The corresponding borders are shown as lines M1 and M2 in Figure 2(b). Grains that plot to even more negative Δ30Si values are not considered part of the distribution and are classified as type D grains (see Section 3.8). The upper limit of Δ30Si < +100‰, which separates mainstream grains from Z grains (see Section 3.4), cannot be inferred from the distribution shown in Figure 4 but was arbitrarily defined. It ensures that a large fraction of grains previously classified as Z grains are still classified as such but also ensures that many grains whose classification as Z grains seemed questionable are now classified as mainstream grains.
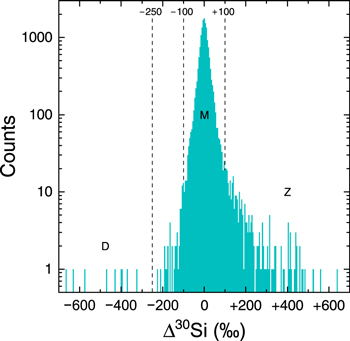
Figure 4. Histogram showing the distribution of Δ30Si for mainstream, D, and Z grains.
Download figure:
Standard image High-resolution imageThere are two lines perpendicular to the regression line that mark the lower and upper limits for mainstream grains along the band (Figure 2(b)). They cross the regression line (M0) at δ30Si = +200‰ (M3) and δ30Si = –75‰ (M4). Parameters for lines M0–M4 and details on how to calculate probabilities are given in the Appendix.
As discussed extensively in the literature, carbon, nitrogen, and inferred aluminum isotope ratios in mainstream grains can be roughly explained by an origin in low-mass, carbon-rich asymptotic giant branch (AGB) stars with approximately solar metallicity (e.g., Nittler & Alexander 2003; Zinner 2014). The silicon isotopic signature of mainstream grains, however, cannot be explained by nuclear processes in AGB stars (Zinner 2014). The spread along the mainstream line is therefore often explained by Galactic chemical evolution (Gallino et al. 1994; Clayton & Timmes 1997). Other explanations include mixing of different regions of the Galaxy (Clayton 1997), local heterogeneities in the Galaxy caused by contributions from Type Ia and Type II supernovae (Lugaro et al. 1999; Nittler 2005), and a merger of the Milky Way with a satellite galaxy (Clayton 2003).
Low-mass AGB star models predict 14N/15N ratios that are typically more than 10 times higher than the value of 200 (Palmerini et al. 2011) the lower limit adopted for mainstream grains in this work. While values <200 reported previously (e.g., Zinner 2014) were due to errors in earlier versions of the PGD, the corrected database suggests a lower limit of ∼200. One reason for low 14N/15N values is contamination with terrestrial or asteroidal nitrogen as demonstrated by Liu et al. (2021). However, this would not explain values below the terrestrial 14N/15N ratio of 272 as seen in Figure 2(a). Another scenario, suggested by Palmerini et al. (2011), involves contamination with 15N produced by cosmic-ray spallation.
3.2. Type X Grains
Type X grains (Figure 5) span a wide range in carbon isotopic ratios, and their 14N/15N ratios are typically significantly below the terrestrial ratio of 272. Using the terrestrial 14N/15N ratio as an upper limit ensures that nitrogen contamination could not lead to a misclassification of X grains. Inferred 26Al/27Al ratios are usually higher than 0.01. However, most diagnostic for X grains are their highly negative δ30Si and δ29Si values. Since there are other types, e.g., mainstream, Y, and AB grains, that could also show slightly negative δ30Si and δ29Si values, distinguishing these grains from some X grains can sometimes be difficult. In such cases, carbon, nitrogen, and aluminum isotopic information can be useful for a proper identification. To prevent grains from being misclassified as X grains, we lower their probability of being consistent with a classification as X grains if they plot in the region where they could also be identified as mainstream, Y, or AB grains (lighter colored area in Figure 5(b); for details, see the Appendix).

Figure 5. Carbon, nitrogen, silicon, and inferred aluminum isotope ratios of individual presolar SiC X grains from the PGD. Horizontal and vertical solid lines show solar and terrestrial values for comparison. Colored areas show the ranges allowed for X grains. Type X grains plot in the silicon three-isotope diagram (b) at negative δ30Si and δ29Si values, usually below the lower left border of the area for mainstream grains (M4). However, as there is some overlap with the region for mainstream grains, that part of the X grain region is shown in a lighter color, indicating the lower probability for grains that plot in that region to be consistent with X grains. Type X grains are usually subdivided into X0, X1, and X2 grains. Dashed lines in (b) indicate the borders between those subtypes. Inferred 26Al/27Al ratios are usually above 0.01, but this is not used as a strict limit as some grains could be affected by 27Al contamination lowering their 26Al/27Al ratios, hence the lighter colored area in (c). Further details are given in the main text and the Appendix.
Download figure:
Standard image High-resolution imageType X grains are attributed to core-collapse (Type II) supernovae (SN II; Amari et al. 1992; Hoppe et al. 1996c, 2000; Nittler et al. 1996).
Based on silicon isotopes, X grains have been subdivided into three subtypes (Lin et al. 2010). Most X grains (61%) plot along a line with a slope of ∼2/3 in the three-isotope plot and are called X1 grains. X0 grains (6%) plot significantly above and X2 grains (33%) significantly below that line. Strontium and barium isotopic analyses suggest that X1 and X2 grains represent two different populations among SN II grains, representing different timing and mixing conditions (Stephan et al. 2018; Ott et al. 2019).
For our classification, we used the following two lines (Figure 5(b)) as dividers between the subtypes:

Further details are given in the Appendix.
3.3. Type Y Grains
Type Y grains (Figure 6) are defined based on their high 12C/13C ratios and are separated from mainstream grains by having ratios above 100. In nitrogen and inferred aluminum isotopes, they are indistinguishable from mainstream grains. In the silicon three-isotope diagram, Y grains mostly plot within the area defined by the mainstream grains but also reach into the area below and to the right of the band for mainstream grains, which is mostly populated by Z grains (see Section 3.4). Therefore, the definition in silicon isotopes used for Y grains combines the areas of those two types. Further details are given in the Appendix.

Figure 6. Carbon, nitrogen, silicon, and inferred aluminum isotope ratios of individual presolar SiC Y grains from the PGD. Horizontal and vertical solid lines show solar and terrestrial values for comparison. Colored areas show the ranges allowed for Y grains. Type Y grains are characterized by having 12C/13C ratios (a) above 100. In the silicon three-isotope diagram (b), they plot in the same areas as mainstream and Z grains combined. The dashed, blue line in (b) is a weighted regression line through the Y grain data but is poorly defined (MSWD = 13.923). Further details are given in the main text and the Appendix.
Download figure:
Standard image High-resolution imageIt has been suggested that Y grains form their own correlation line with a smaller slope than the mainstream line: Hoppe et al. (1994) gave a slope of 0.35 and an intercept of −22.5 for a best fit through data from five Y grains, while Nittler & Alexander (2003) calculated a slope of 0.64 for 113 Y grains. Based on data from 759 Y grains currently available in the PGD, we calculate the following line:

which seems to be in good agreement with the number from Nittler & Alexander (2003). However, a high MSWD of 13.923 clearly indicates that the distribution of Y grains does not follow a simple regression line.
The exact 12C/13C ratio used as a divider between mainstream and Y grains has little influence on the parameters of the calculated regression line. A 12C/13C ratio of 100 is an arbitrary number, as there is no physical justification for it, but has long been used as a divider and was therefore also adopted for the PGD. It means that Y grains have clearly higher 12C/13C ratios than the terrestrial ratio, while mainstream grains usually have ratios that are lower than the terrestrial ratio. Contamination with terrestrial or asteroidal carbon, which has always to be considered when analyzing presolar grains, would move the 12C/13C ratio toward ∼89. However, the data clearly show that grains with higher 12C/13C ratios tend to form a distribution in the silicon three-isotope plot with a slope smaller than the one for the mainstream grains. Cluster analysis of PGD data also showed that there is not a clear separation between mainstream and Y grains (Boujibar et al. 2021). This should not come as a surprise if the prevailing model for Y grains is correct: they come from similar stellar sources (AGB stars) as mainstream grains but with lower metallicities (∼1/2 Z⊙; Amari et al. 2001c). A range in metallicities of their parent stars plausibly leads to a continuum in their isotopic properties.
3.4. Type Z Grains
Type Z grains (Figure 7) have 12C/13C ratios between 13.5 and 100, the same range as mainstream grains. In nitrogen and inferred aluminum isotopes, they are indistinguishable from mainstream and Y grains. In the silicon three-isotope plots, they populate a region that is below and to the right of the band for mainstream grains:

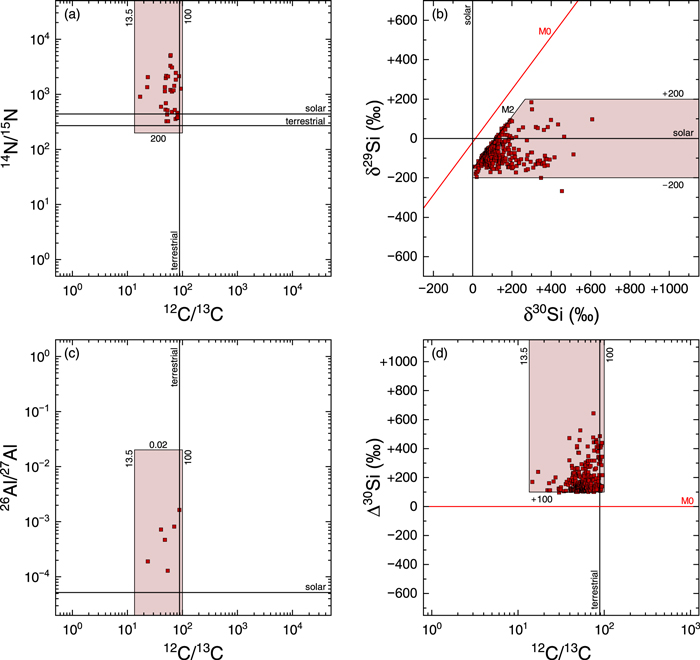
Figure 7. Carbon, nitrogen, silicon, and inferred aluminum isotope ratios of individual presolar SiC Z grains from the PGD. Horizontal and vertical solid lines show solar and terrestrial values for comparison. Colored areas show the ranges allowed for Z grains. Type Z grains have the same ranges for carbon, nitrogen, and inferred aluminum isotopes (a), (c) as mainstream grains. In the silicon three-isotope diagram (b), they plot in a region that is below and to the right of the band for mainstream grains with −200‰ < δ29Si < +200‰ and δ30Si > 0. Further details are given in the main text and the Appendix.
Download figure:
Standard image High-resolution imageIn addition, Z grains are confined by –200‰ < δ29Si < 200‰ and δ30Si > 0.
Previously, Z grains have typically been identified by their distance in units of σ from the mainstream regression line (e.g., Nittler & Alexander 2003), which leads to the issue that the classification of a grain as mainstream or Z grain depends more on the uncertainty and less on the actual value itself. This seems unsatisfactory, especially when keeping in mind that mainstream grains clearly do not lie on a simple line but form a band about the regression line, as can be seen from an MSWD value significantly greater than 1. The new grain type definition led to a reassignment of many grains previously classified as Z to other types, mainly mainstream grains, and only a few grains formerly classified as mainstream grains are now identified as Z grains. Therefore, the total number of Z grains in the PGD has decreased from 639 to 284 according to the new classification (Table 1).
Cluster analysis also showed that Z grains are not clearly separated from mainstream and Y grains (Boujibar et al. 2021), which probably reflects the gradual differences in metallicity among the parent stars of these types of grains. Type Z grains are argued to have originated in the winds of low-mass AGB stars with even lower metallicity (∼1/3 Z⊙) than Y grains (Hoppe et al. 1997).
3.5. Type AB Grains
Type AB grains (Figure 8) have low 12C/13C and were originally defined as two different types, A and B, based on carbon isotopes, with (12C/13C)A < 3.5 < (12C/13C)B < 10, where a dividing value of 3.5 was chosen based on it being the equilibrium composition of CNO-cycle H burning in low-mass stars (Hoppe et al. 1994). Later, the two types were combined into one type AB (e.g., Amari et al. 2001b). More recently, Liu et al. (2017a, 2017b, 2018b) suggested redividing AB grains into two subtypes based on their nitrogen isotopes: AB1 with low 14N/15N and AB2 with high 14N/15N ratios, using the solar value of 14N/15N = 441 (Marty et al. 2011) as a divider.

Figure 8. Carbon, nitrogen, silicon, and inferred aluminum isotope ratios of individual presolar SiC AB grains from the PGD. Horizontal and vertical solid lines show solar and terrestrial values for comparison. Colored areas show the ranges allowed for AB grains. Type AB grains are characterized by having 12C/13C ratios (a) below 13.5, but grains with ratios up to 25 (lighter colored area) could still be classified as AB grains, if nitrogen or inferred aluminum isotope ratios exclude other types. In the silicon three-isotope plot (b), they populate the same region as mainstream grains but plot along a line (AB) with a slightly steeper slope than the mainstream line (M0). Further details are given in the main text and the Appendix.
Download figure:
Standard image High-resolution imageCluster analysis showed that AB grains consist of two clusters, which can be described as one with relatively low 12C/13C and 14N/15N ratios and the other with relatively high 12C/13C and 14N/15N ratios (Boujibar et al. 2021), confirming earlier observations that AB grains with lower 12C/13C ratios tend to have lower 14N/15N ratios (Amari et al. 2001b). However, these clusters show significant overlap, especially in nitrogen isotope ratios, and the solar 14N/15N ratio seems poorly suited as a divider (Boujibar et al. 2021).
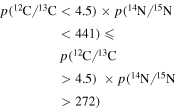
From our assessment of the data (see Section 3.1 and Figure 3), we adopt a value 12C/13C = 13.5 as the cutoff value between AB and mainstream or Z grains, but grains with ratios up to 25 could still be classified as AB grains, if nitrogen or inferred aluminum isotope ratios exclude those other types. Furthermore, we define the two subtypes AB1 and AB2, using 12C/13C < 4.5 and 14N/15N < 441 (solar value) as upper limits for AB1, and 12C/13C > 4.5 and 14N/15N > 272 (terrestrial value) as lower limits for AB2 grains. AB grains that do not match the definition of subtypes AB1 or AB2 are simply designated as AB grains.
Inferred aluminum isotope ratios cannot be used to identify AB grains or their subtypes, as they cover a wide range, but can be useful for excluding other grain types. However, AB1 grains have on average higher inferred 26Al/27Al ratios than AB2 grains, a trend that has been reported earlier (Amari et al. 2001b), but there is no clear separation.
In silicon isotopes, AB grains lie within the area defined by the mainstream grains. However, they form their own line in the silicon three-isotope plot with a slightly steeper slope than mainstream grains,

and an MSWD of 3.895 based on data from 1229 AB grains. Such a steeper slope for AB than for mainstream grains has also been previously reported by Nittler & Alexander (2003).
Among the proposed stellar origins of AB grains are J-type carbon stars (Abia & Isern 2000; Liu et al. 2017b), born-again AGB stars (Asplund et al. 1999; Herwig et al. 2011), and SN II (Liu et al. 2017a; Hoppe et al. 2019).
3.6. Type C Grains
Type C grains (Figure 9) are very rare and characterized by high δ29Si and δ30Si values, substantially higher than those in other types of grains. We use lower limits of δ29Si > +200‰ and δ30Si > +200‰ to separate C grains from other grain types. In carbon, nitrogen, and inferred aluminum isotopes, they cover the same areas as X grains.
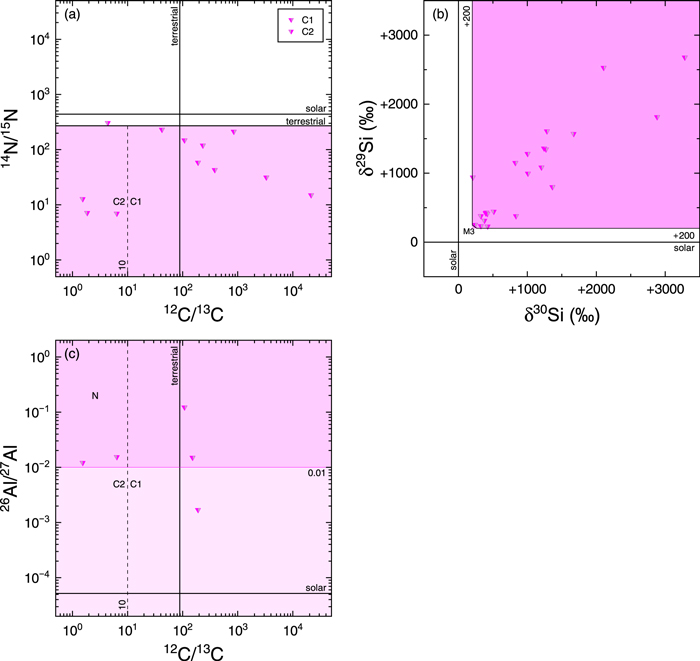
Figure 9. Carbon, nitrogen, silicon, and inferred aluminum isotope ratios of individual presolar SiC C grains from the PGD. Horizontal and vertical solid lines show solar and terrestrial values for comparison. Colored areas show the ranges allowed for C grains. Type C grains have the same ranges for carbon, nitrogen, and inferred aluminum isotopes (a), (c) as X grains. In the silicon three-isotope diagram (b) they plot in the upper right of the diagram at δ29Si > +200‰ and δ30Si > +200‰. Further details are given in the main text and the Appendix.
Download figure:
Standard image High-resolution imageLiu et al. (2016) introduced a distinct subtype C2, characterized by 12C/13C < 10, which are clearly separated from other C grains, now named C1, that have much higher 12C/13C ratios. We adopted the same subtype assignment using 12C/13C < 10 as the upper limit for C2 grains.
Type C grains have been suggested to form in SN II (Croat et al. 2010; Zinner 2014).
3.7. Type N Grains
A few grains, often called putative nova grains, have been attributed to a possible origin in novae (Amari et al. 2001a) and are labeled with N in the PGD (Figure 10). They are defined by having 12C/13C < 13.5 like AB grains, and, as for the AB grains, we also allow for ratios up to 25. The main distinction between AB and N grains is that, in silicon three-isotope diagrams, the latter populate a region that is below and to the right of the band for mainstream and AB grains, following Equation (15) like Z grains. Like Z grains, N grains are confined by δ29Si < +200‰ and δ30Si > 0 but have no lower limit in δ29Si. As for X grains, 14N/15N ratios are significantly below the terrestrial ratio of 272 for N grains, and inferred 26Al/27Al ratios are higher than 0.01. Details are provided in the Appendix.
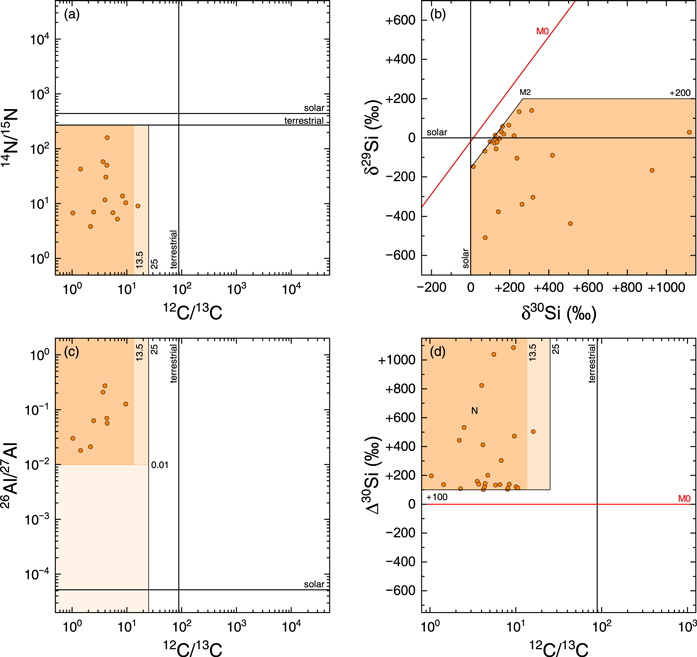
Figure 10. Carbon, nitrogen, silicon, and inferred aluminum isotope ratios of individual presolar SiC N grains from the PGD. Horizontal and vertical solid lines show solar and terrestrial values for comparison. Colored areas show the ranges allowed for N grains. Type N grains are characterized by having 12C/13C ratios (a) below 13.5, with a reduced probability up to a ratio of 25 like AB grains, and inferred 26Al/27Al ratios above 0.01. In the silicon three-isotope plot (b), N grains plot below and to the right of the band for mainstream grains and are limited by δ29Si < +200‰ and δ30Si > 0. Further details are given in the main text and the Appendix.
Download figure:
Standard image High-resolution imageWhether all N grains are really connected to novae or rather some originated in SN II is still debated (Nittler & Hoppe 2005; José & Hernanz 2007; Liu et al. 2016; Hoppe et al. 2018). Schulte et al. (2021), who also favored an origin in SN II, suggested renaming this type to D grains in order to disassociate them from a proposed origin in novae. However, this seemed not to have been widely accepted in the literature, and we continue to refer to these grains as N grains. To avoid confusion when referring to two decades of literature, where these grains are called N grains, nova grains, or putative nova grains, we strongly advise against using the term D grains for these grains.
3.8. Type D Grains
Instead, we use "D" to define a new type of SiC grain, of which there are currently only 10, that populate a region in the silicon three-isotope diagram mostly to the left and above the band for mainstream and AB grains and are indistinguishable from X grains in nitrogen and inferred aluminum isotopes (Figure 11):

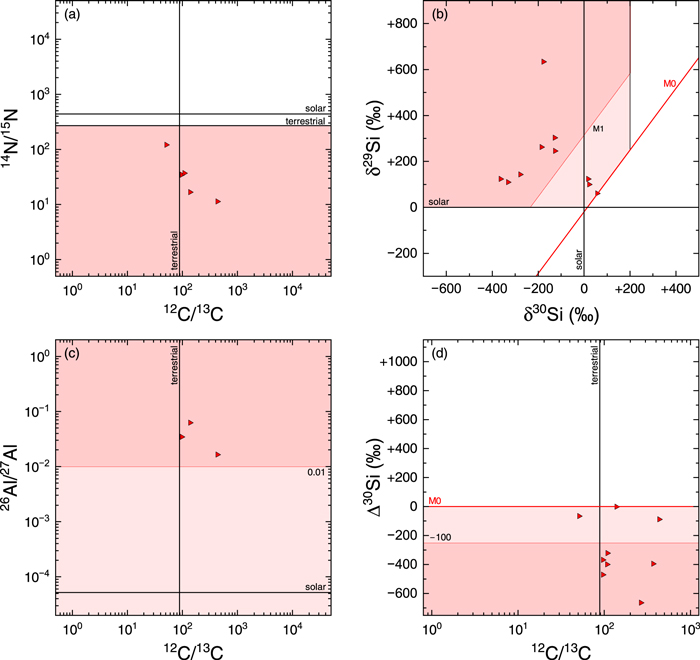
Figure 11. Carbon, nitrogen, silicon, and inferred aluminum isotope ratios of individual presolar SiC D grains from the PGD. Horizontal and vertical solid lines show solar and terrestrial values for comparison. Colored areas show the ranges allowed for D grains. Type D grains have the same ranges for carbon, nitrogen, and inferred aluminum isotopes (a), (c) as X grains. In the silicon three-isotope diagram (b) they plot in the upper left of the band for mainstream grains and at δ29Si > 0 and δ30Si < +200‰. Further details are given in the main text and the Appendix.
Download figure:
Standard image High-resolution imageGrains that are below the upper border of the mainstream band but still above the mainstream regression line can also classified as D grains if nitrogen or inferred aluminum isotope ratios exclude other grain types. In addition, D grains are confined to δ29Si > 0 and δ30Si < +200‰. Details are given in the Appendix.
From their similarities in nitrogen and inferred aluminum isotope ratios with X and C grains, we suggest that D grains also form in SN II.
3.9. Type U Grains
Grains that do not fit into other types have been named U grains, which could stand for ungrouped, unknown, unique, or unusual. With our introduction of the new type D, all grains for which either carbon, nitrogen, or silicon data are available can now be assigned to a specific type.
All grains currently shown as U grains in the PGD are grains for which neither carbon, nitrogen, nor silicon isotope data are available. Some U grains had been initially classified as mainstream or X grains based on isotopic data of trace elements. However, as we base our PGD Type assignments solely on carbon, nitrogen, aluminum, and silicon data, the lack of such data consequently leads to classifying them as U grains.
3.10. Relative Abundances
While Table 1 provides absolute numbers of grains for a given grain type in the PGD, this is not an unbiased sample, as many studies contributed data focused on specific grain types. However, there are several studies that have performed unbiased surveys of large numbers of grains, allowing determination of relative abundances of grain types in primitive solar system material (Alexander 1993; Hoppe et al. 1994, 1996b, 2010, 2012, 2018; Huss et al. 1997; Nittler & Alexander 2003; Nittler & Hoppe 2005; Orthous-Daunay et al. 2012; Xu et al. 2015; Gyngard et al. 2018; Nguyen et al. 2018). Based on data for 17,529 grains from these unbiased studies, we calculated the relative abundances given in Table 2.
Table 2. Presolar SiC Grain Types: Isotopic Signatures, Stellar Sources, and Relative Abundances
| Type | Silicon a | Carbon a | Nitrogen a | Aluminum a | Likely Stellar Sources | Abundance b |
|---|---|---|---|---|---|---|
| Mainstream (M) | Within the M band | 13.5 < 12C/13C < 100 | 14N/15N > 200 | 26Al/27Al < 0.02 | AGB stars with ∼Z⊙ | 88.4% |
| X | δ29Si < 0, δ30Si < 0 | ⋯ | 14N/15N < 272 | 26Al/27Al > 0.01 | SN II | 1.3% |
| Y | Within the M band or below like Z grains | 12C/13C > 100 | 14N/15N > 200 | 26Al/27Al < 0.02 | AGB stars with ∼1/2 Z⊙ | 3.9% |
| Z | Below the M band, −200‰ < δ29Si < +200‰, δ30Si > 0 | 13.5 < 12C/13C < 100 | 14N/15N > 200 | 26Al/27Al < 0.02 | AGB stars with ∼1/3 Z⊙ | 1.4% |
| AB | Within the M band | 12C/13C < 13.5 | ⋯ | ⋯ | J-type carbon stars, born-again AGB stars, SN II | 4.8% |
| C | δ29Si > +200‰, δ30Si > +200‰ | ⋯ | 14N/15N < 272 | 26Al/27Al > 0.01 | SN II | 0.10% |
| D | Above the M band, δ29Si > 0, δ30Si < +200‰ | ⋯ | 14N/15N < 272 | 26Al/27Al > 0.01 | SN II | 0.02% |
| N | Below the M band, δ29Si < +200‰, δ30Si > 0 | 12C/13C < 13.5 | 14N/15N < 272 | 26Al/27Al > 0.01 | Novae, SN II | 0.07% |
Notes.
a For a detailed description of the isotopic signatures and the associated mathematical rules, please refer to the main text and the Appendix. b Relative abundance by number.Download table as: ASCIITypeset image
4. Discussion and Outlook
We hope that the new PGD for SiC, which is now, as far as we know, free from compromised data, proves to be a helpful tool for researchers in cosmochemistry and astrophysics.
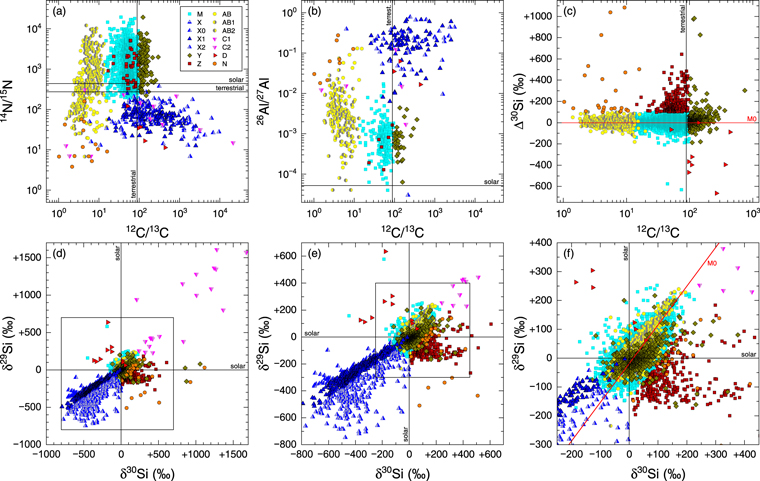
Unified type assignments should help to avoid inconsistencies in grain classification. This, however, does not mean that type classification should remain static for all time. New analytical results as well as new stellar models might help to better divide SiC grains into different types and subtypes in the future. Such consensus new type definitions will be adopted in future versions of the PGD but will have to be adequately justified. For the time being, however, we recommend using the definitions laid out in this work. Table 2 summarizes the isotopic signatures, proposed stellar sources, and unbiased relative abundances of the various grain types. Figure 12 shows data from the PGD for all presolar SiC grains together, summarizing Figures 2 and 5–11 for a better comparison of the various grain types.
Figure 12. Carbon, nitrogen, silicon, and inferred aluminum isotope ratios of all individual presolar SiC grains from the PGD. Horizontal and vertical solid lines show solar and terrestrial values for comparison. Panels (a)–(c) show 14N/15N, inferred 26Al/27Al, and Δ30Si, respectively, plotted vs. 12C/13C. Panels (d)–(f) show δ30Si vs. δ30Si at various scales, zooming into the central region where >96% of all grains plot. The red line labeled M0 in (c) and (f) refers to the mainstream weighted regression line.
Download figure:
Standard image High-resolution image
To guarantee its availability to the community for the foreseeable future, the PGD is archived in the Astromaterials Data System (Astromat), 11 which is operated at the Lamont-Doherty Earth Observatory at Columbia University and is funded by NASA's Planetary Science Division.
The PGD itself exists as a Microsoft Excel (.xlsx) file and as a comma-separated ASCII (.csv) file of the main spreadsheet, with the file names containing the phase (e.g., SiC) and the release date of the specific version. The current versions are PGD_SiC_2023-10-30.xlsx and PGD_SiC_2023-10-30.csv, which are available on Astromat at doi:10.60520/IEDA/113069 (Stephan & Trappitsch 2023a). All versions since the restart of the PGD in 2019 can also be found at doi:10.5281/zenodo.8187219.
All calculations and diagrams in this paper are based on version PGD_SiC_2023-10-30.
In addition, the PGD continues to be available at https://presolar.physics.wustl.edu/presolar-grain-database/, where also old versions of the PGD for other kinds of grains can be found.
In addition, we are developing a suite of Python software tools named pgdtools, available at NASA's Planetary Science GitHub, 12 and, as an installable package, via the Python Package Index (PyPI) at https://pypi.org/project/pgdtools. Currently, pgdtools is under development and does not yet contain any functionality for users. Ultimately, pgdtools will facilitate extraction of data from the PGD using user-defined criteria for subsequent processing in user-defined Python scripts. The package will make the database available locally (offline) and allows for simple updates and version selection. Finally, pgdtools will include a grain classifier that can determine the type of a presolar grain based on the rules provided in this paper.
The PGD should not replace any original work, and we strongly encourage users of the PGD to give proper credit to the authors by also referencing the original papers.
We will continue to curate and expand the PGD in the coming years. Major tasks will be to rebuild the PGD for other kinds of grains, including graphite, oxides, silicates, and rarer phases. We will also keep the SiC data up to date, adding old data that have been overlooked so far, and adding data from newly analyzed grains when they become available.
We kindly ask the members of the presolar grain community to provide their new data, ideally as Excel spreadsheets or comma-separated ASCII files with unrounded numbers, to Thomas Stephan (tstephan@uchicago.edu). We prefer to receive these data at the time they are published or mentioned for the first time in the refereed literature. Preliminary numbers should not be provided to keep subsequent changes of existing data in the PGD at a minimum. Any mistakes or missing data should also be reported.
Acknowledgments
We thank two anonymous reviewers for their detailed and constructive comments. This work was supported by NASA (grants 80NSSC22K0511 to T.S. and 80NSSC21K0374 to A.M.D.).
Appendix
A.1. Carbon
The probability that the measured 12C/13C ratio is consistent with a given grain type is calculated using the following equations:

Types X, C, and D do not rely in their classification on carbon isotopes. Therefore,

When applying limits to the ranges of isotope ratios or δ-values for a given grain type, we distinguish between hard and soft limits. A hard limit in this context means that the rule has to be applied strictly as shown in Equations (4), (6), or (10). For soft limits, however, we weaken the criterion by applying a prefactor <1 and adding a minimum value to Equations (4), (6), or (10), simultaneously making sure that the probability cannot be >1. For example, while AB and N grains typically have a 12C/13C ratio below 13.5, we allow for somewhat higher numbers up to 25 if, e.g., nitrogen isotopes exclude the grain to be classified as a mainstream or Z grain. This is achieved by using coefficients of 0.8 and 0.2 in the definitions of  and
and  according to Equation (A3), making 12C/13C < 25 a hard limit and 12C/13C < 13.5 a soft limit for those grains. The limits of mainstream, Y, and Z grains, as defined in Equations (A1) and (A2), are hard.
Finally, we also had to take into account the case that no carbon isotope data are available for a grain. As identification of a grain as type Y, AB, or N mainly relies on carbon isotopes, we assume the following probabilities if no carbon data are available:


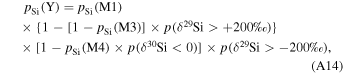
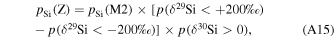
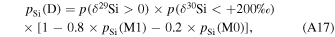
A.2. Nitrogen
The probability that a measured 14N/15N ratio is consistent with a given grain type is calculated using the following equations:


Type AB does not rely in its classification on nitrogen isotopes. Therefore,

Since no grain type identification relies mainly on nitrogen isotopes, we assume a probability of 1 for all types if no nitrogen data exist:
A.3. Silicon
For silicon isotopes, an area around the mainstream line (M0) has to be considered, which is defined by four lines M1–M4 with the parameters given in Table A1. As a shorthand for a given pair of parameters a and b from Table A1 applied to Equation (10), we use the following nomenclature:

Table A1. Parameters of Lines in Silicon Three-isotope Plots
| Line | a | b |
|---|---|---|
| M0 | −19.0‰ | 1.342 |
| M1 | −19.0‰ + 250‰ × 1.342 | 1.342 |
| M2 | −19.0‰ − 100‰ × 1.342 | 1.342 |
| M3 |

| −1/1.342 |
| M4 |

| −1/1.342 |
Download table as: ASCIITypeset image
With this, the probability that a grain is consistent with a given grain type based on silicon isotope ratios is calculated using the following equations:


For a proper grain type assignment, ideally, all three silicon isotopes should have been measured. However, for some grains, only one δ-value has been measured. If only δ29Si data exist, we use the following equations:


Similarly, if only δ30Si data exist, we use the following equations:


Finally, if no silicon data exist, we apply the following equations:


Identification of grain types Z, C, D, and N mainly relies on the measurement of all three silicon isotopes. If no or only partial silicon data exist, we therefore assign 0 probability for these types. For type X, partial silicon data could be used for identification, and we use a probability of 0.2 if no silicon data is available, as they might be still identifiable by their distinctively low 14N/15N or high inferred 26Al/27Al ratios.
A.4. Aluminum
Inferred 26Al/27Al ratios can also be useful for the identification of some grain types:


While mainstream, Y, and Z grains have inferred 26Al/27Al ratios <0.02, X, C, D, and N grains usually have ratios >0.01. However, we account for the possibility that 27Al contamination might have compromised the grains by slightly softening the limit for X, C, D, and N grains. For AB grains, inferred 26Al/27Al ratios are not indicative.
We assume a probability of 1 for all types if no aluminum data exist:
A.5. Subtypes
For X grains, we use subtype assignments X0, X1, and X2 according to Table A2.
Table A2. X Grain Subtype Assignment
| Subtype | Condition |
|---|---|
| X0 |
|
| X1 |
|
| X2 |

|
| No subtype | δ29Si or δ30Si data do not exist |
Download table as: ASCIITypeset image
For AB grains, we use subtype assignments AB1 and AB2 according to Table A3.
Table A3. AB Grain Subtype Assignment
| Subtype | Condition |
|---|---|
| AB1 |
 and and 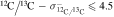 and and 
|
| AB2 |
 and and  and and 
|
| No subtype | Nitrogen data do not exist or conditions for AB1 and AB2 are not met |
Download table as: ASCIITypeset image
For C grains, we use subtype assignment C1 and C2 according to Table A4.
Table A4. C Grain Subtype Assignment
| Subtype | Condition |
|---|---|
| C1 | 12C/13C ≥ 10 |
| C2 | 12C/13C < 10 |
| No subtype | No carbon data exist |
Download table as: ASCIITypeset image