


Abstract
Massive stars have a strong impact on their local environments. However, how stellar feedback regulates star formation is still under debate. In this context, we studied the chemical properties of 80 dense cores in the Orion molecular cloud complex composed of the Orion A (39 cores), B (26 cores), and λ Orionis (15 cores) clouds using multiple molecular line data taken with the Korean Very Long Baseline Interferometry Network 21 m telescopes. The λ Orionis cloud has an H ii bubble surrounding the O-type star λ Ori, and hence it is exposed to the ultraviolet (UV) radiation field of the massive star. The abundances of C2H and HCN, which are sensitive to UV radiation, appear to be higher in the cores in the λ Orionis cloud than in those in the Orion A and B clouds, while the HDCO to H2CO abundance ratios show the opposite trend, indicating warmer conditions in the λ Orionis cloud. The detection rates of dense gas tracers such as the N2H+, HCO+, and H13CO+ lines are also lower in the λ Orionis cloud. These chemical properties imply that the cores in the λ Orionis cloud are heated by UV photons from λ Ori. Furthermore, the cores in the λ Orionis cloud do not show any statistically significant excess in the infall signature of HCO+ (1–0), unlike those in the Orion A and B clouds. Our results support the idea that feedback from massive stars impacts star formation in a negative way by heating and evaporating dense materials, as in the λ Orionis cloud.
Export citation and abstract BibTeX RIS
1. Introduction
Stars are formed by the gravitational collapse of dense cores (n ≥ 105 cm−3) (Myers & Benson 1983; Shu et al. 1987; Bergin & Tafalla 2007). As a result, the physical and chemical properties of dense cores can provide clues to the initial conditions of star formation. Collapsing cores hosting central protostars are called "protostellar cores," while cores without any sign of star formation, such as embedded infrared sources or outflows/jets, are known as "starless cores."
Many recent observational studies have discovered a large number of dense cores in different star-forming environments (Yuan et al. 2016; Tatematsu et al. 2017; Liu et al. 2018; Tang et al. 2018; Yi et al. 2018; Eden et al. 2019). Some of these cores are exposed to the strong far-ultraviolet (FUV) and extreme-ultraviolet (EUV) radiation fields of massive stars. In such harsh environments the internal structure and chemical abundances of their natal clouds are modified. FUV radiation (6 eV ≤ h ν ≤ 13.6 eV) dissociates molecules in the surroundings and then produces different chemical species. This radiative feedback can reduce the amount of neutral molecular gas through ionization, heating, and photoevaporation, which can reduce the star formation rate (SFR) or the star formation efficiency (SFE) (Solomon et al. 1979; Murray 2011; Dale et al. 2012, 2013). The negative impact on star formation can eventually terminate star formation activity altogether (Mathieu 2008). Kruijssen et al. (2019) recently reported that stellar feedback can shorten the cloud lifetime and lower star formation efficiencies to about 2%–3%. Furthermore, radiative and mechanical feedback from the O-type massive stars can increase pressure (e.g., pressure by radiation, ionized gas, and stellar wind), and it can impact star formation in a negative way by decreasing SFR per unit area (McLeod et al. 2019). A number of theoretical studies have also predicted negative consequences from stellar feedback. Simulations by Dale et al. (2012, 2013) found that the overall effect of ionization feedback on molecular clouds scales was most likely negative, by lowering the SFE over a given timescale, resulting in fewer stars being born. In an idealized cloud, photoionization seems to increase the SFE at early times; however, at later times, the intense radiation depresses total star formation efficiency via the photoevaporation of dense gas (Shima et al. 2017).
In contrast, massive stars can trigger the formation of new generations of stars in surrounding material, when it is compressed by the expansion of an H ii region (Elmegreen & Lada 1977) or when pre-existing dense clumps in their strong FUV radiation field become gravitationally unstable (Sandford et al. 1982; Lefloch & Lazareff 1994). A large number of observational studies have reported the signposts of triggered star formation, e.g., the presence of young stellar objects (YSOs) at the edge of an H ii bubble and their age gradient (Deharveng et al. 2003, 2005; Sicilia-Aguilar et al. 2004; Zavagno et al. 2006; Koenig et al. 2008; Liu et al. 2012b; Lim et al. 2014; Xu et al. 2017). Recently, a subgroup of YSOs receding from ionizing sources was found in the young open cluster NGC 1893 (Lim et al. 2018). However, these signposts are still insufficient to fully explain the physical causality between ionizing sources and new generations of stars.
There are several challenges to validating the effects of stellar feedback on star formation. The objects formed by the feedback are spatially mixed with spontaneously formed objects, and thus it is difficult to distinguish them by observation (Dale et al. 2015). Dale et al. (2015) also demonstrated that variation in SFE may not be a proxy for triggered star formation because the measured gas mass is only a fraction of the cloud mass. High values of apparent SFE may occur in two different ways, either by efficient star formation or by the efficient removal of molecular gas by photoevaporation and stellar winds (Getman et al. 2012). For these reasons, the impact of stellar feedback on star formation is still under debate.
In this context, the Orion molecular cloud complex (OMC) is an ideal testbed to examine the effects of stellar feedback on surroundings and subsequent star formation. This star-forming complex is composed of three giant molecular clouds (diameter >30 pc), the Orion A, B, and λ Orionis clouds, located at similar distances of 350–450 pc (Kounkel et al. 2017; Getman et al. 2019; Zucker et al. 2019). The Orion A and B clouds are well-known active star-forming regions on a scale of 15 pc and contain a large number of low- and high-mass stars (Megeath et al. 2012) with a total mass greater than 2 × 10⁵ M☉ (Wilson et al. 2005). The λ Orionis cloud hosts one of the most prominent OB associations in the OMC and its total mass is about 1.4 × 10⁴ M☉ (Lang et al. 2000). The main ionizing source is the O8 III star λ Ori. The high UV energy from λ Ori created a giant H ii region Sh 2-264 with a radius of 34.5 pc (Maddalena & Morris 1987; Barrado & Navascués 2005). A ring structure surrounding the H ii region was shaped by a supernova explosion, which is considered to have been caused by a binary companion of λ Ori about several million years ago (Cunha & Smith 1996; Dolan & Mathieu 2002; Hernández et al. 2010; Kounkel et al. 2018). Lang et al. (2000) found a low level of star-forming activity along the inner ring of Sh 2-264 and concluded that the ring may not be a site of triggered star formation because only a small number of YSOs are associated with it. Mathieu (2008) argued that the supernova explosion terminated star formation in the λ Orionis cloud, and that the intense radiation from remaining massive stars destroys accretion disks around YSOs. Thus, the λ Orionis cloud appears to be a star-forming region dominated by negative stellar feedback, while the Orion A and B clouds are free from the negative effects of feedback, since they have different star formation histories.
In our previous paper (Yi et al. 2018, hereafter Paper I), the physical properties (size, column density, mass, and number density) of 119 cores in the OMC were studied using the 850 μm dust continuum image. We found evidence that core formation was suppressed in the λ Orionis cloud; specifically, the core formation efficiency (CFE) in the λ Orionis cloud (0.10) is lower than those in the Orion A (0.12) and B (0.20) clouds. Recently, the Nobeyama single-pointing survey observed 207 dense cores in five different environments (λ Orionis, Orion A, Orion B, the Galactic plane, and high latitudes) to study the initial conditions of star formation (Kim et al. 2020). The deuterium fractions of starless cores in the λ Orionis and Orion A and B clouds were not significantly different, suggesting that there is no systematic difference in the chemical properties among the three clouds (Kim et al. 2020). In this study, we aim to further investigate the chemical differences in the context of the negative effects of stellar feedback on 80 cores, using multiple molecular line data obtained with the Korean Very Long Baseline Interferometry Network (KVN) 21 m telescopes.
Spectral lines detected in cores are useful tools for probing different star-forming conditions. Deuterium fractions (D/H ratios) and the abundances of various molecules in the three clouds were compared to study the environmental effects on dense cores. In addition, we probed the signatures of ongoing star formation (jets driven by protostars and infall motions in cores). Sample selection and observations are described in Section 2. In Section 3, we present the detection rates, line widths, and abundance ratios of some molecules. In Section 4, we investigate the infall signature, which is another tracer of star formation activities, in each cloud. In Section 5 we discuss the results of this work and our previous study in terms of the effects of negative stellar feedback, and we summarize our main results in Section 6.
2. Data
2.1. Sample Selection
In Paper I, we identified a total of 119 cores using 850 μm dust continuum data. The list of cores was used to select targets of observation. The Orion A and B clouds are active star-forming regions and several cores are clustered within the filamentary clumps (Yi et al. 2018). We thus selected cores with separation larger than 32'' from the others considering the beam sizes of 21 m telescopes at about 90 GHz (Table 1). A total of 39, 26, and 15 cores are selected in the Orion A, B, and λ Orionis clouds, respectively. Our sample contains a total of 80 cores in the three clouds.
Table 1. Observed Transitions and Telescope Parameters
| Molecule | Rest Frequency a | Transition | HPBW a | ηmb | Tsys |
|---|---|---|---|---|---|
| (GHz) | (arcsec) | YS, US, TN | |||
| H2O | 22.23508 | 616–523 | 126 | 0.45, 0.49, 0.48 | 130 |
| SiO | 43.42379 | v = 0, J = 1–0 | 63 | 0.48, 0.46, 0.48 | 150 |
| CH3OH | 44.06943 | 70–61, A+ | 60 | 0.47, 0.45, 0.47 | 240 |
| H13CO+ | 86.75428 | J = 1−0 | 32 | 0.41, 0.44, 0.44 | 260 |
| C2H | 87.31689 | N = 1–0, J = 5/2–3/2, F = 2–1 | 31 | 0.40, 0.43, 0.43 | 190 |
| HCN | 88.63184 | J = 1−0 | 30 | 0.39, 0.41, 0.41 | 220 |
| HCO+ | 89.18852 | J = 1−0 | 30 | 0.38, 0.41, 0.41 | 230 |
| N2H+ | 93.17339 | J = 1−0 | 29 | 0.35, 0.37, 0.37 | 190 |
| HDCO | 128.81286 | 20,2–10,1 | 21 | 0.39, 0.36, 0.36 | 210 |
| H2 13CO | 137.44995 | 21,2–11,1 | 20 | 0.34, 0.32, 0.32 | 200 |
| H2CO | 140.83952 | 21,2–11,1 | 19 | 0.33, 0.30, 0.30 | 220 |
Notes. H2O and CH3OH are maser emission lines.
a The half-power beam widths of three single-dish telescopes at Yonsei (YS), Ulsan (US), and Tamna (TN) sites.Download table as: ASCIITypeset image
We divided these cores into two groups—protostellar and starless cores. The former has infrared sources that were classified using their spectral index (α) and bolometric temperature (Tbol) (see Section 3.3.3 of Paper I). The latter does not show any observational sign of star formation. There are 5 protostellar and 10 starless cores in the λ Orionis cloud. The sample for the Orion A cloud contains 13 protostellar cores and 26 starless cores. In the Orion B cloud, 7 protostellar cores and 19 starless cores were selected. The number ratios of protostellar to starless cores are 0.5 in the λ Orionis and Orion A clouds and roughly 0.4 in the Orion B cloud.
2.2. Observation and Data Reduction of KVN
We carried out single-dish observations with the KVN 21 m telescopes at the Yonsei, Ulsan, and Tamna stations (Kim et al. 2011; Lee et al. 2011). A multifrequency receiving system is attached to each telescope with the 22, 44, 86, and 129 GHz bands (Han et al. 2008). The observations were made from 2016 August to 2017 March using several receivers simultaneously. All the 80 cores were observed in single-pointing mode with the rms level of  lower than 0.1 K at a velocity of ∼0.1 km s−1 (channel width is 0.05 km s−1). The J = 1−0 transitions of five molecules (N2H+, HCO+, H13CO+, C2H, and HCN), including an SiO thermal line (v = 0, J = 1–0), two masers (CH3OH 70 → 61
A+ and H2O 616 → 523), and H2CO (21,2 → 11,1), H2
13CO (21,2 → 11,1), and HDCO (20,2 → 10,1) lines were observed in the position switching mode. We conducted multifrequency observations in four receivers with 64 MHz bandwidth and 4096 channels, which give a spectral channel width of 15.625 kHz. Table 1 lists the observed molecular lines, beam sizes, main-beam efficiencies (ηmb), and system temperatures. The observed antenna temperature,
lower than 0.1 K at a velocity of ∼0.1 km s−1 (channel width is 0.05 km s−1). The J = 1−0 transitions of five molecules (N2H+, HCO+, H13CO+, C2H, and HCN), including an SiO thermal line (v = 0, J = 1–0), two masers (CH3OH 70 → 61
A+ and H2O 616 → 523), and H2CO (21,2 → 11,1), H2
13CO (21,2 → 11,1), and HDCO (20,2 → 10,1) lines were observed in the position switching mode. We conducted multifrequency observations in four receivers with 64 MHz bandwidth and 4096 channels, which give a spectral channel width of 15.625 kHz. Table 1 lists the observed molecular lines, beam sizes, main-beam efficiencies (ηmb), and system temperatures. The observed antenna temperature,  , was converted to main-beam brightness temperature as
  /ηmb. The focus and pointing were checked every two to three hours by observing the strong SiO maser source Orion KL. All the spectra were reduced with the GILDAS/CLASS package. A first-order polynomial baseline subtraction was performed for the majority of the observed sources, except for some sources that need a higher order of polynomial baseline fitting. For these sources, we carried out a second-order polynomial baseline subtraction. A Hanning smoothing technique was then applied to the spectra to achieve a velocity resolution of 0.1 km s−1. To characterize the spectral features, we fit a Gaussian profile to each observed spectrum. The peak temperature at the
  scale, systemic velocity, and FWHM inferred by Gaussian fitting to each spectrum are listed in Tables 2 and 3.
Table 2. Properties of H13CO+, C2H, HCN, and HCO+ Lines
| Cloud | Core | H13CO+ | C2H | HCN | HCO+ | ||||||||
|---|---|---|---|---|---|---|---|---|---|---|---|---|---|
| Tpeak | VLSR | FWHM | Tpeak | VLSR | FWHM | Tpeak | VLSR | FWHM | Tpeak | VLSR | FWHM | ||
| (K) | (km s−1) | (K) | (km s−1) | (K) | (km s−1) | (K) | (km s−1) | ||||||
| λ Orionis | G190.15-13.75N | ⋯ | ⋯ | ⋯ | ⋯ | ⋯ | ⋯ | ⋯ | ⋯ | ⋯ | ⋯ | ⋯ | ⋯ |
| G190.15-13.75S | 0.23 | 1.32 | 0.51 | ⋯ | ⋯ | ⋯ | 0.10 | 1.61 | 1.52 | 0.88 | 1.27 | 0.97 | |
| G191.90-11.21N | ⋯ | ⋯ | ⋯ | ⋯ | ⋯ | ⋯ | 0.49 | 10.60 | 2.26 | 0.42 | 10.87 | 3.91 | |
| G191.90-11.21S | 0.20 | 10.55 | 0.87 | 0.27 | 10.57 | 0.46 | 0.19 | 10.50 | 0.35 | 0.65 | 10.51 | 1.03 | |
| G192.12-10.90N | 0.43 | 9.96 | 0.67 | 0.54 | 9.85 | 0.76 | 0.52 | 9.87 | 0.94 | 0.66 | 9.61 | 1.48 | |
| G192.12-10.90S | ⋯ | ⋯ | ⋯ | 0.09 | 10.11 | 1.76 | 0.16 | 9.83 | 0.64 | ⋯ | ⋯ | ⋯ | |
| G192.12-11.10 | 0.47 | 10.22 | 0.65 | 0.27 | 10.12 | 0.96 | 0.25 | 10.10 | 0.68 | 0.26 | 10.29 | 1.49 | |
| G192.32-11.88N | 0.46 | 12.16 | 1.00 | 0.40 | 12.09 | 0.77 | 1.49 | 12.40 | 2.31 | 1.38 | 12.41 | 1.76 | |
| G192.32-11.88S | 0.48 | 12.10 | 0.85 | 0.46 | 12.02 | 0.80 | 1.33 | 12.10 | 1.22 | 1.34 | 12.23 | 1.36 | |
| G196.92-10.37 | 0.65 | 11.66 | 0.79 | 0.61 | 11.61 | 1.35 | 0.58 | 11.40 | 2.09 | 1.08 | 11.06 | 1.57 | |
| G198.69-09.12N1 | 0.42 | 11.07 | 0.73 | 0.10 | 10.90 | 0.72 | 0.67 | 11.10 | 1.17 | 0.99 | 10.91 | 1.25 | |
| G198.69-09.12N2 | ⋯ | ⋯ | ⋯ | 0.28 | 10.72 | 1.01 | 0.29 | 10.80 | 0.73 | 0.84 | 10.81 | 1.24 | |
| G198.69-09.12S | 0.40 | 11.10 | 1.07 | 0.41 | 11.04 | 0.87 | 2.05 | 10.80 | 0.87 | 1.43 | 11.03 | 1.04 | |
| G200.34-10.97N | 0.30 | 13.42 | 0.94 | 0.31 | 13.51 | 0.66 | 0.35 | 13.50 | 0.68 | 0.54 | 13.68 | 1.40 | |
| G200.34-10.97S | ⋯ | ⋯ | ⋯ | 0.38 | 13.68 | 0.56 | 0.15 | 13.80 | 0.67 | 0.37 | 14.31 | 1.25 | |
| Orion A | G207.36-19.82N1 | 0.31 | 10.68 | 2.31 | 0.53 | 10.80 | 1.03 | 2.01 | 10.70 | 1.59 | 1.76 | 10.68 | 1.35 |
| G207.36-19.82N2 | 0.59 | 11.06 | 0.98 | 0.40 | 10.93 | 1.10 | 1.33 | 10.80 | 1.46 | 2.23 | 10.75 | 1.16 | |
| G207.36-19.82N3 | 0.48 | 11.19 | 0.80 | 0.42 | 11.09 | 0.40 | 0.52 | 11.10 | 1.49 | 1.21 | 11.09 | 1.59 | |
| G207.36-19.82N4 | 0.38 | 11.17 | 1.21 | 0.19 | 10.99 | 2.18 | 0.47 | 11.20 | 1.34 | 1.33 | 11.18 | 1.46 | |
| G208.68-19.20N1 | 1.31 | 11.14 | 0.93 | 0.93 | 11.19 | 1.14 | 7.67 | 11.10 | 1.53 | 4.83 | 11.16 | 1.63 | |
| G208.68-19.20N2 | 1.63 | 11.15 | 0.92 | 0.88 | 11.03 | 1.36 | 3.95 | 11.00 | 2.04 | 2.92 | 11.13 | 1.99 | |
| G208.68-19.20N3 | 1.33 | 11.07 | 1.20 | 1.07 | 10.83 | 1.57 | 5.53 | 10.90 | 2.04 | 3.83 | 10.99 | 2.09 | |
| G208.68-19.20S | 0.60 | 10.61 | 1.59 | 0.77 | 10.77 | 1.14 | 4.60 | 10.80 | 1.98 | 3.51 | 10.82 | 1.95 | |
| G209.55-19.68N1 | 0.47 | 7.32 | 0.97 | 0.23 | 7.72 | 2.02 | 2.12 | 6.97 | 1.39 | 2.08 | 7.03 | 1.48 | |
| G209.55-19.68N2 | 0.29 | 8.15 | 0.55 | ⋯ | ⋯ | ⋯ | 0.40 | 8.36 | 2.52 | 0.54 | 8.04 | 3.49 | |
| G209.55-19.68N3 | 0.53 | 8.16 | 0.73 | 0.38 | 8.06 | 0.46 | 0.24 | 7.94 | 1.16 | 0.80 | 7.75 | 1.45 | |
| G209.55-19.68S1 | 0.38 | 7.49 | 1.08 | 0.24 | 7.56 | 0.90 | 0.37 | 8.08 | 3.05 | 0.97 | 7.42 | 3.15 | |
| G209.55-19.68S2 | 0.62 | 8.03 | 0.66 | 0.21 | 8.19 | 1.25 | 0.24 | 8.32 | 1.34 | 1.26 | 7.89 | 1.26 | |
| G209.77-19.40E1 | 0.31 | 8.02 | 0.50 | 0.48 | 8.19 | 1.12 | 0.43 | 8.16 | 1.03 | 0.77 | 8.18 | 1.57 | |
| G209.77-19.40E2 | 0.35 | 8.07 | 0.56 | 0.46 | 8.18 | 1.16 | 0.43 | 8.29 | 0.99 | 0.76 | 8.29 | 1.56 | |
| G209.77-19.40E3 | 0.30 | 7.94 | 0.71 | 0.49 | 8.32 | 1.40 | 0.55 | 8.18 | 1.28 | 0.79 | 8.16 | 1.75 | |
| G209.77-19.40W | 0.18 | 8.31 | 0.33 | 0.29 | 8.28 | 1.43 | 0.29 | 8.16 | 0.98 | 0.45 | 8.36 | 1.63 | |
| G209.77-19.61E | 0.35 | 8.06 | 0.62 | 0.12 | 8.40 | 1.98 | 0.22 | 8.31 | 2.17 | 0.79 | 7.95 | 0.75 | |
| G209.77-19.61W | 0.15 | 7.19 | 0.59 | ⋯ | ⋯ | ⋯ | 1.06 | 7.49 | 1.81 | 1.73 | 7.20 | 0.80 | |
| G209.79-19.80E | 0.43 | 5.45 | 0.49 | 0.41 | 5.50 | 0.38 | 0.93 | 5.43 | 0.66 | 1.41 | 5.52 | 0.85 | |
| G209.79-19.80W | 0.56 | 5.89 | 0.99 | 0.43 | 5.98 | 1.11 | 1.52 | 5.91 | 1.31 | 1.56 | 5.86 | 1.53 | |
| G209.94-19.52N | 0.45 | 7.95 | 0.83 | 0.52 | 8.01 | 0.91 | 1.31 | 7.73 | 0.72 | 1.51 | 7.77 | 0.75 | |
| G209.94-19.52S1 | 0.43 | 8.09 | 0.93 | 0.30 | 8.14 | 2.12 | 0.38 | 8.20 | 1.33 | 0.75 | 8.29 | 2.14 | |
| G209.94-19.52S2 | 0.27 | 7.70 | 1.05 | 0.28 | 7.69 | 1.59 | 2.63 | 7.73 | 1.62 | 1.64 | 7.76 | 1.62 | |
| G210.49-19.79E1 | 0.73 | 8.82 | 0.91 | 0.66 | 8.77 | 1.25 | 4.50 | 8.78 | 1.66 | 2.42 | 8.86 | 1.76 | |
| G210.49-19.79E2 | 0.95 | 10.22 | 0.91 | 0.68 | 10.23 | 0.94 | 0.89 | 9.45 | 2.74 | 1.98 | 9.52 | 3.14 | |
| G210.49-19.79W | 0.60 | 9.11 | 0.93 | 0.40 | 9.21 | 1.61 | 2.08 | 9.08 | 2.20 | 1.73 | 9.19 | 2.18 | |
| G210.97-19.33N | 0.15 | 3.91 | 0.84 | 0.26 | 3.76 | 0.63 | 0.16 | 5.48 | 4.04 | 0.87 | 3.59 | 1.59 | |
| G210.97-19.33S2 | 0.34 | 3.47 | 1.68 | 0.36 | 3.79 | 2.02 | 1.18 | 3.68 | 2.17 | 1.90 | 3.25 | 1.39 | |
| G211.16-19.33N1 | 0.48 | 3.27 | 0.80 | 0.45 | 3.33 | 0.83 | 0.29 | 3.16 | 0.51 | 0.97 | 3.04 | 0.76 | |
| G211.16-19.33N2 | 0.52 | 3.55 | 0.74 | 0.64 | 3.51 | 0.68 | 0.57 | 3.39 | 0.63 | 0.89 | 3.37 | 1.00 | |
| G211.16-19.33N3 | 0.61 | 3.30 | 0.59 | 0.56 | 3.35 | 0.47 | 0.39 | 3.33 | 0.35 | 1.31 | 3.36 | 0.89 | |
| G211.16-19.33N4 | 0.43 | 4.55 | 0.81 | 0.36 | 4.60 | 0.68 | 1.48 | 4.26 | 0.88 | 0.72 | 4.19 | 1.21 | |
| G211.16-19.33N5 | 0.34 | 4.48 | 1.02 | 0.30 | 4.49 | 1.15 | 0.27 | 4.49 | 0.79 | 1.36 | 3.38 | 0.96 | |
| G211.16-19.33S | 0.18 | 3.31 | 0.71 | ⋯ | ⋯ | ⋯ | 0.15 | 4.42 | 2.23 | 0.46 | 4.09 | 3.30 | |
| G215.44-16.38 | 0.19 | 11.38 | 0.44 | 0.32 | 11.39 | 0.47 | 1.59 | 11.20 | 0.45 | 0.70 | 11.31 | 0.43 | |
| G215.87-17.62N | 0.31 | 9.21 | 0.63 | 0.31 | 9.19 | 0.76 | 0.94 | 9.34 | 0.89 | 1.22 | 9.34 | 1.02 | |
| G215.87-17.62M | 0.25 | 9.02 | 0.78 | 0.41 | 8.95 | 0.45 | 0.22 | 9.03 | 0.74 | 0.28 | 9.00 | 1.35 | |
| G215.87-17.62S | ⋯ | ⋯ | ⋯ | ⋯ | ⋯ | ⋯ | 0.80 | 9.57 | 0.48 | 0.30 | 9.61 | 1.02 | |
| Orion B | G201.52-11.08 | ⋯ | ⋯ | ⋯ | 0.20 | 9.26 | 0.51 | 0.56 | 9.07 | 1.01 | 0.76 | 9.37 | 0.46 |
| G201.72-11.22 | ⋯ | ⋯ | ⋯ | 0.49 | 9.47 | 0.31 | 0.30 | 9.55 | 0.35 | 0.57 | 9.45 | 0.45 | |
| G203.21-11.20E1 | 0.48 | 10.22 | 1.22 | 0.29 | 10.25 | 1.16 | 0.20 | 9.88 | 0.37 | 0.46 | 9.62 | 0.19 | |
| G203.21-11.20E2 | 0.63 | 10.29 | 1.23 | 0.21 | 10.54 | 1.28 | 0.19 | 10.20 | 0.68 | 0.63 | 9.65 | 0.32 | |
| G203.21-11.20W1 | 0.47 | 10.46 | 1.13 | 0.21 | 10.41 | 1.51 | ⋯ | ⋯ | ⋯ | 0.59 | 9.64 | 0.38 | |
| G203.21-11.20W2 | 0.61 | 10.21 | 0.74 | 0.34 | 10.10 | 0.85 | ⋯ | ⋯ | ⋯ | 0.34 | 9.63 | 0.63 | |
| G204.4-11.3A2E | 0.64 | 1.56 | 0.63 | 0.91 | 1.60 | 0.59 | 0.72 | 1.67 | 0.42 | 1.43 | 1.77 | 0.79 | |
| G204.4-11.3A2W | 0.58 | 1.67 | 0.71 | 0.59 | 1.59 | 0.82 | 0.88 | 1.76 | 0.57 | 1.51 | 1.75 | 0.88 | |
| G205.46-14.56N2 | 0.73 | 9.84 | 1.04 | 0.69 | 9.76 | 1.20 | 4.20 | 9.92 | 1.42 | 4.28 | 9.86 | 1.51 | |
| G205.46-14.56N3 | 0.78 | 9.90 | 0.94 | 0.67 | 9.88 | 0.95 | 4.72 | 9.93 | 1.17 | 4.66 | 9.94 | 1.36 | |
| G205.46-14.56M1 | 0.73 | 10.02 | 0.93 | 0.42 | 9.97 | 0.89 | 4.23 | 10.00 | 1.13 | 4.40 | 10.06 | 1.40 | |
| G205.46-14.56S1 | 0.56 | 10.12 | 1.18 | 0.41 | 10.05 | 1.40 | 2.62 | 9.87 | 2.93 | 3.55 | 9.99 | 1.72 | |
| G205.46-14.56S2 | 0.67 | 10.42 | 0.65 | 0.71 | 10.47 | 0.83 | 1.05 | 10.40 | 1.37 | 2.16 | 10.54 | 2.04 | |
| G205.46-14.56S3 | 0.41 | 10.41 | 0.61 | 0.44 | 10.29 | 0.82 | 0.84 | 10.40 | 0.98 | 1.26 | 10.36 | 1.60 | |
| G206.12-15.76 | 0.41 | 8.51 | 0.64 | 0.49 | 8.39 | 0.45 | 0.39 | 7.95 | 2.57 | 0.58 | 8.51 | 0.96 | |
| G206.21-16.17N | 0.62 | 9.87 | 0.65 | 0.22 | 9.90 | 1.00 | 2.19 | 9.87 | 0.85 | 2.20 | 9.84 | 1.00 | |
| G206.21-16.17S | 0.43 | 9.53 | 0.33 | 0.23 | 9.51 | 0.49 | 0.32 | 9.62 | 0.35 | 1.33 | 9.55 | 0.77 | |
| G206.69-16.60N | 0.28 | 11.40 | 0.36 | 0.26 | 11.32 | 0.57 | 0.14 | 11.80 | 1.14 | 0.80 | 11.42 | 0.48 | |
| G206.69-16.60S | 0.51 | 12.03 | 0.80 | 0.29 | 11.99 | 0.73 | 2.37 | 12.10 | 0.89 | 2.62 | 12.12 | 0.94 | |
| G206.93-16.61E1 | 1.38 | 9.83 | 0.98 | 0.32 | 10.02 | 1.78 | 3.71 | 10.00 | 1.94 | 4.16 | 10.00 | 2.31 | |
| G206.93-16.61E2 | 0.79 | 9.71 | 0.85 | 0.48 | 9.84 | 1.02 | 2.69 | 9.77 | 1.79 | 3.68 | 9.67 | 1.90 | |
| G206.93-16.61W1 | 0.95 | 9.29 | 0.96 | 0.51 | 9.37 | 0.98 | 1.13 | 9.69 | 2.48 | 3.81 | 9.02 | 1.13 | |
| G206.93-16.61W3 | 0.54 | 9.64 | 1.70 | 0.56 | 9.57 | 0.04 | 0.60 | 9.80 | 2.50 | 1.49 | 9.39 | 2.65 | |
| G206.93-16.61W4 | 0.78 | 9.89 | 1.03 | 0.32 | 10.09 | 1.91 | 0.39 | 9.73 | 2.18 | 1.35 | 9.39 | 2.21 | |
| G206.93-16.61W5 | 0.55 | 9.40 | 1.79 | 0.28 | 9.85 | 1.27 | 0.58 | 9.54 | 2.31 | 1.89 | 9.33 | 2.58 | |
| G206.93-16.61W6 | 0.44 | 9.39 | 2.35 | 0.35 | 10.34 | 1.30 | 2.57 | 10.00 | 2.08 | 1.89 | 9.33 | 2.58 | |
Only a portion of this table is shown here to demonstrate its form and content. A machine-readable version of the full table is available.
Table 3. Properties of N2H+, HDCO, and H2CO Lines
| Cloud | Core | N2H+ | HDCO | H2CO | ||||||
|---|---|---|---|---|---|---|---|---|---|---|
| Tpeak | VLSR | FWHM | Tpeak | VLSR | FWHM | Tpeak | VLSR | FWHM | ||
| (K) | (km s−1) | (K) | (km s−1) | (K) | (km s−1) | |||||
| λ Orionis | G190.15-13.75N | ⋯ | ⋯ | ⋯ | ⋯ | ⋯ | ⋯ | ⋯ | ⋯ | ⋯ |
| G190.15-13.75S | ⋯ | ⋯ | ⋯ | 0.08 | 1.42 | 0.59 | 0.41 | 1.30 | 0.75 | |
| G191.90-11.21N | ⋯ | ⋯ | ⋯ | ⋯ | ⋯ | ⋯ | 0.74 | 11.00 | 2.68 | |
| G191.90-11.21S | 0.60 | 9.32 | 0.36 | 0.33 | 10.54 | 0.50 | 0.68 | 10.50 | 0.64 | |
| G192.12-10.90N | 0.46 | 8.68 | 0.52 | 0.23 | 10.06 | 0.31 | 0.61 | 9.85 | 1.03 | |
| G192.12-10.90S | ⋯ | ⋯ | ⋯ | ⋯ | ⋯ | ⋯ | 0.13 | 10.05 | 0.57 | |
| G192.12-11.10 | 0.28 | 8.97 | 0.86 | 0.21 | 10.19 | 0.79 | 0.49 | 10.18 | 0.98 | |
| G192.32-11.88N | 0.79 | 10.90 | 0.63 | 0.16 | 12.11 | 0.69 | 0.64 | 12.67 | 2.75 | |
| G192.32-11.88S | 0.77 | 10.80 | 0.53 | 0.23 | 12.61 | 0.69 | 0.68 | 12.08 | 1.31 | |
| G196.92-10.37 | 0.47 | 10.50 | 0.77 | 0.31 | 11.69 | 0.58 | 0.47 | 11.44 | 2.01 | |
| G198.69-09.12N1 | ⋯ | ⋯ | ⋯ | 0.16 | 11.10 | 0.52 | 0.65 | 11.15 | 1.04 | |
| G198.69-09.12N2 | 0.11 | 9.37 | 0.22 | ⋯ | ⋯ | ⋯ | 0.51 | 10.80 | 0.84 | |
| G198.69-09.12S | 0.27 | 9.76 | 0.59 | 0.13 | 11.08 | 1.00 | 0.67 | 11.03 | 1.23 | |
| G200.34-10.97N | 0.83 | 12.20 | 0.41 | 0.23 | 13.41 | 0.42 | 0.54 | 13.43 | 0.80 | |
| G200.34-10.97S | 0.37 | 12.50 | 0.36 | 0.13 | 13.72 | 0.27 | 0.22 | 13.82 | 0.73 | |
| Orion A | G207.36-19.82N1 | 0.95 | 9.48 | 0.93 | ⋯ | ⋯ | ⋯ | 0.84 | 10.85 | 1.15 |
| G207.36-19.82N2 | 1.34 | 9.84 | 0.72 | 0.35 | 11.22 | 0.41 | 0.63 | 10.97 | 1.28 | |
| G207.36-19.82N3 | 0.49 | 9.94 | 0.58 | 0.37 | 11.32 | 0.50 | 0.71 | 11.30 | 1.22 | |
| G207.36-19.82N4 | 0.69 | 9.86 | 0.55 | 0.26 | 11.15 | 0.78 | 0.63 | 11.07 | 1.64 | |
| G208.68-19.20N1 | 2.34 | 9.92 | 0.76 | 0.59 | 11.18 | 0.92 | 2.02 | 11.20 | 1.48 | |
| G208.68-19.20N2 | 1.96 | 9.94 | 0.55 | 0.47 | 11.20 | 0.42 | 1.63 | 11.09 | 1.48 | |
| G208.68-19.20N3 | 2.91 | 9.86 | 0.82 | 0.36 | 11.17 | 0.71 | 1.59 | 10.96 | 1.93 | |
| G208.68-19.20S | 2.24 | 9.45 | 1.37 | 0.21 | 10.32 | 1.44 | 1.29 | 10.74 | 1.75 | |
| G209.55-19.68N1 | 1.78 | 6.09 | 0.87 | ⋯ | ⋯ | ⋯ | 0.74 | 7.28 | 1.47 | |
| G209.55-19.68N2 | 0.89 | 6.98 | 0.31 | ⋯ | ⋯ | ⋯ | 0.37 | 8.20 | 1.22 | |
| G209.55-19.68N3 | 0.81 | 6.85 | 0.61 | 0.17 | 8.07 | 0.73 | 0.44 | 8.03 | 1.27 | |
| G209.55-19.68S1 | 0.81 | 6.09 | 0.76 | ⋯ | ⋯ | 0.80 | 0.31 | 7.59 | 2.29 | |
| G209.55-19.68S2 | 1.51 | 6.85 | 0.45 | 0.23 | 8.18 | 0.75 | 0.50 | 7.95 | 1.04 | |
| G209.77-19.40E1 | 1.14 | 6.80 | 0.36 | ⋯ | ⋯ | ⋯ | 0.54 | 8.09 | 0.82 | |
| G209.77-19.40E2 | 1.15 | 6.82 | 0.46 | 0.16 | 7.99 | 0.55 | 0.60 | 8.15 | 0.91 | |
| G209.77-19.40E3 | 0.65 | 6.76 | 0.69 | ⋯ | ⋯ | ⋯ | 0.72 | 7.90 | 0.80 | |
| G209.77-19.40W | 1.72 | 7.13 | 0.21 | ⋯ | ⋯ | ⋯ | 0.40 | 8.36 | 0.93 | |
| G209.77-19.61E | 0.77 | 6.78 | 0.35 | ⋯ | ⋯ | ⋯ | 0.27 | 8.20 | 1.53 | |
| G209.77-19.61W | 0.41 | 6.00 | 0.34 | ⋯ | ⋯ | ⋯ | 0.44 | 7.18 | 0.61 | |
| G209.79-19.80E | 0.21 | 4.24 | 0.36 | ⋯ | ⋯ | ⋯ | 0.54 | 5.50 | 0.59 | |
| G209.79-19.80W | 0.70 | 4.56 | 0.68 | 0.18 | 5.96 | 1.18 | 0.64 | 6.00 | 1.41 | |
| G209.94-19.52N | 0.80 | 6.76 | 0.55 | 0.30 | 7.97 | 0.54 | 0.74 | 7.88 | 0.86 | |
| G209.94-19.52S1 | 1.28 | 6.78 | 0.96 | 0.29 | 8.14 | 0.53 | 0.60 | 8.21 | 1.41 | |
| G209.94-19.52S2 | 0.57 | 6.15 | 0.62 | ⋯ | ⋯ | ⋯ | 0.66 | 7.73 | 1.35 | |
| G210.49-19.79E1 | 1.56 | 7.54 | 0.84 | 0.28 | 8.83 | 0.55 | 1.01 | 8.89 | 1.50 | |
| G210.49-19.79E2 | 1.14 | 8.96 | 0.72 | 0.35 | 10.30 | 0.69 | 1.10 | 10.11 | 1.69 | |
| G210.49-19.79W | 0.77 | 7.90 | 0.72 | 0.25 | 9.11 | 0.57 | 0.70 | 9.32 | 1.99 | |
| G210.97-19.33N | ⋯ | ⋯ | ⋯ | ⋯ | ⋯ | ⋯ | 0.19 | 3.72 | 1.48 | |
| G210.97-19.33S2 | 0.18 | 2.07 | 0.75 | ⋯ | ⋯ | ⋯ | 0.42 | 3.44 | 1.79 | |
| G211.16-19.33N1 | 0.90 | 2.13 | 0.40 | ⋯ | ⋯ | ⋯ | 0.49 | 3.18 | 0.67 | |
| G211.16-19.33N2 | 0.67 | 2.32 | 0.44 | ⋯ | ⋯ | ⋯ | 0.60 | 3.58 | 0.69 | |
| G211.16-19.33N3 | 0.91 | 2.16 | 0.43 | 0.37 | 14.39 | 0.28 | 0.61 | 3.33 | 0.66 | |
| G211.16-19.33N4 | 0.35 | 3.40 | 0.59 | ⋯ | ⋯ | ⋯ | 0.61 | 4.51 | 0.85 | |
| G211.16-19.33N5 | 0.93 | 3.17 | 0.58 | ⋯ | ⋯ | ⋯ | 0.63 | 4.55 | 1.03 | |
| G211.16-19.33S | ⋯ | ⋯ | ⋯ | ⋯ | ⋯ | ⋯ | 0.17 | 4.92 | 2.92 | |
| G215.44-16.38 | 0.37 | 10.30 | 0.32 | ⋯ | ⋯ | ⋯ | 0.22 | 11.38 | 0.58 | |
| G215.87-17.62N | 0.14 | 8.05 | 0.46 | ⋯ | ⋯ | ⋯ | 0.38 | 9.34 | 0.72 | |
| G215.87-17.62M | ⋯ | ⋯ | ⋯ | ⋯ | ⋯ | ⋯ | 0.44 | 9.03 | 0.85 | |
| G215.87-17.62S | ⋯ | ⋯ | ⋯ | ⋯ | ⋯ | ⋯ | 0.19 | 9.96 | 0.45 | |
| Orion B | G201.52-11.08 | ⋯ | ⋯ | ⋯ | ⋯ | ⋯ | ⋯ | 0.29 | 9.16 | 0.56 |
| G201.72-11.22 | 1.42 | 8.25 | 0.29 | 0.15 | 9.46 | 0.45 | 0.34 | 9.59 | 0.52 | |
| G203.21-11.20E1 | 0.35 | 9.20 | 0.75 | 0.29 | 10.66 | 0.30 | 0.37 | 10.17 | 1.30 | |
| G203.21-11.20E2 | 0.72 | 9.02 | 0.72 | 0.24 | 10.40 | 0.84 | 0.45 | 10.29 | 1.61 | |
| G203.21-11.20W1 | 0.72 | 9.38 | 0.59 | 0.25 | 10.67 | 0.81 | 0.52 | 9.82 | 0.42 | |
| G203.21-11.20W2 | 0.55 | 8.97 | 0.60 | 0.24 | 10.16 | 0.51 | 0.19 | 10.19 | 1.79 | |
| G204.4-11.3A2E | 1.09 | 0.31 | 0.49 | 0.31 | 1.75 | 0.42 | 0.56 | 1.60 | 1.37 | |
| G204.4-11.3A2W | 0.60 | 0.33 | 0.97 | 0.25 | 1.78 | 0.74 | 0.59 | 1.77 | 0.83 | |
| G205.46-14.56N2 | 1.02 | 8.79 | 0.89 | ⋯ | ⋯ | ⋯ | 1.46 | 9.94 | 1.34 | |
| G205.46-14.56N3 | 1.59 | 8.79 | 0.69 | 0.26 | 10.10 | 0.93 | 1.28 | 9.94 | 1.40 | |
| G205.46-14.56M1 | 1.32 | 8.88 | 0.82 | ⋯ | ⋯ | ⋯ | 1.01 | 10.02 | 1.32 | |
| G205.46-14.56S1 | 1.88 | 9.02 | 1.12 | ⋯ | ⋯ | ⋯ | 0.86 | 10.02 | 2.41 | |
| G205.46-14.56S2 | 1.82 | 9.21 | 0.51 | ⋯ | ⋯ | ⋯ | 0.53 | 10.60 | 2.14 | |
| G205.46-14.56S3 | 1.79 | 9.18 | 0.58 | 0.18 | 10.53 | 0.65 | 0.47 | 10.29 | 1.59 | |
| G206.12-15.76 | 1.67 | 7.20 | 0.44 | 0.35 | 8.39 | 0.34 | 0.54 | 8.37 | 0.61 | |
| G206.21-16.17N | 1.94 | 8.59 | 0.37 | 0.14 | 9.88 | 0.47 | 0.63 | 9.83 | 0.63 | |
| G206.21-16.17S | 1.04 | 8.33 | 0.27 | 0.14 | 9.60 | 0.47 | 0.44 | 9.59 | 0.40 | |
| G206.69-16.60N | 0.74 | 10.10 | 0.36 | 0.23 | 11.36 | 0.30 | 0.41 | 11.37 | 0.48 | |
| G206.69-16.60S | 0.65 | 10.90 | 0.60 | 0.19 | 12.01 | 0.50 | 0.84 | 12.05 | 0.94 | |
| G206.93-16.61E1 | 2.00 | 8.62 | 0.76 | 0.22 | 9.84 | 0.75 | 1.16 | 9.98 | 1.29 | |
| G206.93-16.61E2 | 0.85 | 8.49 | 0.68 | 0.10 | 9.61 | 0.85 | 0.91 | 9.75 | 1.40 | |
| G206.93-16.61W1 | 1.26 | 8.14 | 0.79 | 0.22 | 9.38 | 0.68 | 0.71 | 9.37 | 1.44 | |
| G206.93-16.61W3 | 1.35 | 8.09 | 0.68 | 0.22 | 9.16 | 0.86 | 0.58 | 9.88 | 2.61 | |
| G206.93-16.61W4 | 0.63 | 8.72 | 1.13 | 0.23 | 10.07 | 0.73 | 0.49 | 9.66 | 2.04 | |
| G206.93-16.61W5 | 0.64 | 8.10 | 1.32 | 0.23 | 9.09 | 0.67 | 0.63 | 9.48 | 1.92 | |
| G206.93-16.61W6 | 0.72 | 8.80 | 1.35 | ⋯ | ⋯ | ⋯ | 0.89 | 9.63 | 2.01 | |
Note. H2 13CO was detected only in G207.36-19.82N3. Tpeak, VLSR, and FWHM of the detected H2 13CO line are 0.15 K, 11.25 km s−1, and 0.92 km s−1, respectively.
Only a portion of this table is shown here to demonstrate its form and content. A machine-readable version of the full table is available.
2.3. James Clerk Maxwell Telescope (JCMT/SCUBA-2)
As part of the legacy survey, the Submillimetre Common-User Bolometer Array 2 (SCUBA-2) Continuum Observations of Pre-protostellar Evolution (SCOPE) project observed dust continuum emission from about 1000 dense clumps (N(H2) > 5 × 1021 cm−2) at 850 μm (Liu et al. 2018; Eden et al. 2019). The list of clumps in this survey was taken from the catalog of the Planck Galactic Cold Clumps (PGCC), which contains all the cold dust clumps detected by the Planck mission, in combination with the IRAS 100 μm data (Planck Collaboration et al. 2016). From the SCOPE project, we obtained the 850 μm dust continuum emission maps to estimate column densities of H2 molecules toward the 80 cores in our sample. The main-beam size of SCUBA-2 at 850 μm is about 14''. To derive abundances of given molecules relative to molecular hydrogen (X(molecule) = N(molecule)/N(H2)), the 850 μm continuum maps were convolved to the same main-beam size as the KVN telescopes, ∼30'' for N2H+, HCO+, H13CO+, HCN, and C2H, and ∼20'' for H2CO and HDCO line data using the starlink kappa package. Detailed explanations for observations and data reduction of the original SCUBA-2 data can be found in Paper I.
2.4. Source Classification
In Paper I, we divided cores into starless and protostellar cores using the Wide-field Infrared Survey Explorer (WISE) photometric data provided by the AllWISE data release (Cutri et al. 2014), and then classified the evolutionary stages of the individual protostellar cores. Since the sensitivity and spatial resolution of the Herschel data are better than those of WISE, we used the Herschel Orion Protostar Survey (HOPS) catalog of cores in the Orion A and B clouds to confirm the previously classified protostellar and starless cores.
In the case of the λ Orionis cloud, the census of YSOs is somewhat incomplete due to the absence of mid-infrared data with high sensitivity and high spatial resolution. An SiO thermal emission line can be an alternative way to classify protostellar cores in the λ Orionis cloud because this emission line traces protostellar jets (Lee et al. 2017). The SiO emission line was detected only in two cores classified as starless in Paper I: G191.90-11.21N and G192.32-11.88N. These cores are located in the quiescent and isolated region of the cloud, and therefore there is no source of contamination that can drive SiO emission. Thus, G191.90-11.21N and G192.32-11.88N were reclassified as protostellar cores containing Class 0 YSOs (Appendix B.1).
In the Orion A and B clouds, there is no starless core that has been reclassified by the molecular line data because none of them showed SiO thermal or maser emission. Using the HOPS catalog, we reclassified four starless cores (G208.68-19.20N1, G208.68-19.20S, G209.55-19.68N1, and G210.97-19.33S2) as protostellar cores in the Orion A cloud because these cores host either Class 0 or Class I objects. In the case of the Orion B cloud, four starless cores (G205.46-14.56M1, G206.12-15.76, G206.93-16.61W3, and G206.93-16.61W6) were reclassified as protostellar cores with Class 0 YSOs.
In summary, a total of 10 starless cores were reclassified as protostellar cores in the λ Orionis (2), Orion A (4), and B (4) clouds. The ratio of protostellar cores to starless cores is 0.9 in the λ Orionis cloud, 0.8 in Orion A, and 0.7 in Orion B. These comparable core ratios allow us to perform an unbiased study of the chemical properties of cores. Table 4 summarizes the numbers of protostellar, starless, and total cores in the three clouds.
Table 4. Statistics of the Observed Cores
| Cloud | Protostellar Cores | Starless Cores | Total |
|---|---|---|---|
| λ Orionis | 7 | 8 | 15 |
| Orion A | 17 | 22 | 39 |
| Orion B | 11 | 15 | 26 |
Download table as: ASCIITypeset image
3. Results
We investigated various molecular tracers and abundance variations in cores within the three clouds to understand the chemical properties of the cores under different levels of stellar feedback. In this section, the detection rates, line widths, and abundance ratios of the observed molecules are presented.
3.1. Detection Rates
A total of 11 molecular spectral lines were observed for 80 dense cores in the OMC. We considered the line to be detected only when the signal-to-noise ratio (S/N) of a spectrum was greater than 3. The detection rate of a molecular line is defined by the number of cores with the line detection relative to the total number of cores (Ndetection/Ntotal). Figure 1 displays the detection rates of the individual lines in the three clouds (see also Table 5). Cores in the λ Orionis cloud tend to have lower detection rates than those in the other two clouds.

Figure 1. Detection rates of the observed molecular lines toward 15 cores in the λ Orionis cloud, 39 cores in Orion A, and 26 cores in Orion B. Different colors denote different regions (blue: λ Orionis cloud, magenta: Orion A cloud, green: Orion B cloud).
Download figure:
Standard image High-resolution imageTable 5. Detection Rates of the Observed Lines
| Molecule | Rest Frequency | λ Orionis | Orion A | Orion B |
|---|---|---|---|---|
| (GHz) | (15) | (39) | (26) | |
| H2O maser | 22.23508 | 1 (7%) | 1 (3%) | 1 (4%) |
| SiO | 43.42379 | 2 (13%) | 0 (0%) | 0 (0%) |
| CH3OH maser | 44.06943 | 0 (0%) | 0 (0%) | 1 (4%) |
| H13CO+ | 86.75428 | 10 (67%) | 38 (97%) | 24 (92%) |
| C2H | 87.31689 | 12 (80%) | 35 (90%) | 26 (100%) |
| HCN | 88.63184 | 14 (93%) | 39 (100%) | 24 (92%) |
| HCO+ | 89.18852 | 13 (87%) | 39 (100%) | 26 (100%) |
| N2H+ | 93.17339 | 10 (67%) | 35 (90%) | 25 (96%) |
| HDCO | 128.81286 | 11 (73%) | 17 (44%) | 20 (77%) |
| H2 13CO | 137.44995 | 0 (0%) | 1 (3%) | 0 (0%) |
| H2CO | 140.83952 | 14 (93%) | 39 (100%) | 26 (100%) |
Note. Detection rates toward 80 cores in the OMC. The numbers indicate the number of detected cores in each cloud and the percentage is in parentheses.
Download table as: ASCIITypeset image
HCO+, H13CO+, and N2H+ are well-known tracers of dense gas (Lee et al. 2004; Ikeda et al. 2007; Kauffmann et al. 2017; Pety et al. 2017). N2H+ in particular is not easily depleted at low temperature and high density. The mean H2 column density of cores in the λ Orionis cloud is lower than that of cores in the Orion A and B clouds (Paper I), and thus the detection rates of these molecular lines are also expected to be lower in the λ Orionis cloud. Their detection rates are indeed the lowest in the λ Orionis cloud (87%, 67%, and 67% for the HCO+, H13CO+, and N2H+ lines, respectively).
The two C2H and HCN lines have been used to trace photodissociation regions (PDRs) (Fuente et al. 1993; Watanabe et al. 2012; Cuadrado et al. 2015), where FUV photons govern the structure, dynamics, chemistry, and thermal balance of the cloud as well as the star formation (Tielens & Hollenbach 1985; Hollenbach et al. 1991; Hollenbach & Tielens 1999). Massive stars in the λ Orionis cloud emit high-energy UV photons, which can easily photoionize or photodissociate molecules. The detection rates of C2H and HCN lines are thus expected to be the highest in the λ Orionis cloud. However, the detection rate of the C2H emission line was found to be higher in the Orion A (90%) and B (100%) clouds than in the λ Orionis cloud (80%), while the detection rate for HCN was very high and comparable in all three clouds (λ Orionis: 93%, Orion A: 100%, Orion B: 92%). Recent studies have suggested that C2H and HCN are prevalent molecules in molecular clouds and dense interstellar medium (Liszt & Lucas 2001; Loison et al. 2014; Liszt et al. 2018). The ubiquity of these two molecules probably makes it difficult to find the origin of their emission. The abundances of C2H and HCN and their origins are discussed in Section 3.3.1.
H2CO is abundant in the general interstellar medium. The detection rates of this molecular line are about 93% in the λ Orionis and 100% in the Orion A and B clouds. The optically thin isotopologue line, H2 13CO 21,2–11,1 has been detected toward only one core. The derived H2 13CO column density of the core is 7.56 × 1011 cm−2. Given the detection limit of spectral lines (S/N > 3), all the non-detected cores may have H2 13CO column densities smaller than ∼5 × 1011 cm−2. The HDCO line, a deuterated species of H2CO, shows variations in detection rates among the three clouds. Its detection rates are 44% and 77% in the Orion A and B clouds, individually, and 73% in the λ Orionis cloud.
We detected H2O maser emission toward three cores (G196.92-10.37, G210.49-19.79W, and G205.46-14.56S) and CH3OH maser emission in one core (G205.46-14.56S). The 22 GHz H2O and 44 GHz Class I CH3OH masers are usually associated with inner jets and outflow lobes, respectively (e.g., Kurtz et al. 2004; Kim et al. 2018). The three H2O maser-emitting cores are located one in each of the three clouds, and the sole CH3OH maser-detected core, which also emits H2O maser emission, is located in the Orion B cloud. The SiO thermal line (v = 0, J = 1–0) was detected in two cores (G191.90-11.21N and G192.32-11.88N) within the λ Orionis cloud, while the line was not detected in either of the Orion A and B clouds. We discuss the detailed properties of these five cores in Appendix B.
3.2. Line Widths
Since the internal motion of gas broadens spectral lines, line width provides information about velocity dispersion caused by both thermal and nonthermal motions of gas in the cloud. Most molecular clouds have velocity dispersions greater than the predicted thermal velocity dispersion (σT) (Ward-Thompson & Whitworth 2011). This fact implies the presence of nonthermal motions related to turbulence and bulk motions within the cloud. In cores with specific radii (0.01 pc < Rcore < 0.1 pc), nonthermal velocity dispersion (σNT) is greater than σT (Ward-Thompson & Whitworth 2011). Most of the cores in our sample were smaller than 0.1 pc (Paper I), and the line widths may be governed by nonthermal motions.
The nonthermal velocity dispersion is calculated using the equation
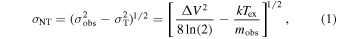
where ΔV, mobs, and Tex represent the FWHM of the molecular line profile, the molecular mass, and the excitation temperature of the gas, respectively. The line widths (FWHM) are obtained from the best-fit Gaussian profile and Tex is assumed to be equal to the dust temperature Td (see Appendix A). All cores have much larger σobs than σT, indicating that they have greater nonthermal motions than thermal motions, as shown by previous works (Liu et al. 2012a; Servajean et al. 2019; Teng & Hirano 2020). The median values of σNT and σT are summarized in Table 6.
Table 6. Median Values of the Nonthermal and Thermal Velocity Dispersions Derived for Seven Molecules
| Molecule | λ Orionis | Orion A | Orion B | |||
|---|---|---|---|---|---|---|
| σNT | σT | σNT | σT | σNT | σT | |
| (km s−1) | (km s−1) | (km s−1) | (km s−1) | (km s−1) | (km s−1) | |
| H13CO+ | 0.36 | 0.06 | 0.36 | 0.06 | 0.37 | 0.07 |
| C2H | 0.32 | 0.07 | 0.47 | 0.07 | 0.40 | 0.07 |
| HCN | 0.38 | 0.06 | 0.57 | 0.06 | 0.59 | 0.07 |
| HCO+ | 0.60 | 0.06 | 0.65 | 0.06 | 0.61 | 0.07 |
| N2H+ | 0.23 | 0.06 | 0.25 | 0.06 | 0.29 | 0.07 |
| HDCO | 0.22 | 0.06 | 0.30 | 0.06 | 0.27 | 0.06 |
| H2CO | 0.47 | 0.06 | 0.53 | 0.06 | 0.59 | 0.07 |
Download table as: ASCIITypeset image
Figure 2 displays the line widths (ΔV) of six frequently detected molecular lines (HCO+, H13CO+, C2H, HCN, H2CO, and HDCO) with respect to that of N2H+. ΔV of the HCO+, HCN, C2H, and H2CO lines shows large spreads, while that of H13CO+ and HDCO exhibits relatively small dispersions (Figure 2). We also present the median value of ΔV (ΔVmol, med) of the seven molecular lines for the three clouds in Table 7. The Orion A and B clouds show a larger ΔV than the λ Orionis cloud in four molecular lines (HCO+, C2H, HCN, and H2CO).
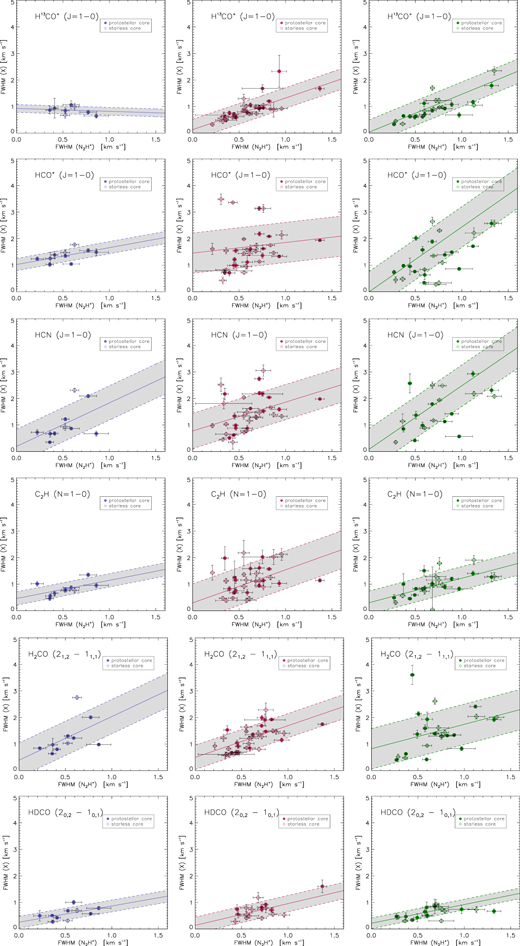
Figure 2. Relations between velocity dispersions of N2H+ and six different molecular lines. The relations obtained from cores in the λ Orionis, Orion A, and Orion B clouds are displayed from left to right. Filled circles and open diamonds represent protostellar cores and starless cores, respectively. The gray shaded region in each panel indicates the standard deviation ±(σwidth) of  for the molecular line.
Download figure:
Standard image High-resolution imageTable 7. Median Line Widths of Seven Molecules toward Cores within the Three Clouds
| Molecule | λ Orionis | Orion A | Orion B |
|---|---|---|---|
| (km s−1) | (km s−1) | (km s−1) | |
| H13CO+ | 0.8 | 0.8 | 0.9 |
| C2H | 0.8 | 1.1 | 1.0 |
| HCN | 0.9 | 1.3 | 1.4 |
| HCO+ | 1.1 | 1.5 | 1.3 |
| N2H+ | 0.5 | 0.6 | 0.7 |
| HDCO | 0.5 | 0.7 | 0.6 |
| H2CO | 1.0 | 1.2 | 1.4 |
Note. Median line widths of seven molecules that are frequently detected in the three clouds. The velocity resolution is 0.1 km s−1.
Download table as: ASCIITypeset image
The ΔVmol, med of HDCO (ΔVHDCO, med) and N2H+ ( ) are the same (0.5 km s−1) in the λ Orionis cloud (Table 7). The two values are indistinguishable in the Orion A and B clouds, as well, considering the velocity resolution of 0.1 km s−1. Figure 2 shows a tight correlation between the HDCO and N2H+ line widths in all three clouds. Since the N2H+ line traces cold and dense gas, the HDCO line also seems to trace the cold and dense core centers. Although
  is slightly larger than those of N2H+ and HDCO in each cloud, the
  among the three clouds did not show a significant difference. Thus, the H13CO+ line emission seems to be a good tracer for the dense part of cores (Onishi et al. 2002; Ikeda et al. 2007; Sanhueza et al. 2012; Yoo et al. 2018). In summary, N2H+, HDCO, and H13CO+ had similar line widths in the three clouds (Table 7), suggesting that these emission lines are less affected by turbulence and trace the densest part of cores.
ΔVmol, med of four other molecules (HCO+, HCN, C2H, and H2CO) was larger than that of N2H+ in all three clouds. This is probably because the four molecular lines are optically thick, and they trace different regions from N2H+. In particular, C2H molecules are abundant in PDRs because this molecule can form through the photodissociation of acetylene (C2H2): C2H2 + h ν → C2H + H (Fuente et al. 1993; Cuadrado et al. 2015). These observational results suggest that the C2H molecule traces a PDR or the outer regions of cores rather than the dense gas of core centers. The HCO+ and HCN emission lines are good tracers of star-forming activities (e.g., outflow or jet) (Rawlings et al. 2004; Riffel & Lüdke 2010; Walker-Smith et al. 2014; Michiyama et al. 2018). Star-forming activities can generate turbulence (Plunkett et al. 2015), and this can then increase ΔV of the two molecular lines, particularly in the Orion A and B clouds. The HCN line shows the largest difference in ΔVmed among the three clouds (Table 7). In addition, the H2CO emission line is considered to be a tracer of an outflow or jet (Bachiller & Pérez Gutiérrez 1997), and ΔVmed of H2CO is also larger in the Orion A and B clouds than in the λ Orionis cloud. These facts further support the idea that the star-forming activities contribute to the line broadening of HCO+ and HCN molecules. We will discuss more detailed properties of HCO+, H2CO, C2H, and HCN molecules in Section 5.
3.3. Chemical Abundances
The chemical abundances of cores and their evolution from starless to protostellar stages are greatly affected by the intense radiation field produced by massive stars. The FUV radiation forms PDRs in surrounding molecular clouds, where the gas is heated up via the photoelectric effect (Hollenbach & Tielens 1999). In order to study how UV radiation changes the chemical abundances of cores, we calculate the molecular abundances and abundance ratios of selected species.
3.3.1. Abundances of PDR Tracers
We focus on the effects of stellar FUV radiation on cores in each cloud in this section. In PDRs, the abundances of some specific molecules, such as C2H and HCN, are enhanced (Sternberg & Dalgarno 1995; Hasegawa & Kwok 2001) by photodissociation or dissociative recombination. To test whether the UV radiation induces abundance enhancements of those molecules, we compared the abundances of C2H (X(C2H)), HCN (X(HCN)), and HCO+ (X(HCO+)) in the λ Orionis cloud with those in the other two clouds. For the abundance calculations, the H2 column density was derived from the 850 μm dust continuum emission obtained from the JCMT/SCUBA-2 images (see Paper I for detail). The median and mean abundance of the observed molecules are summarized in Table 8.
Table 8. Statistics of Abundance Ratios of Seven Molecules toward the Three Clouds
| Cloud | X(N2H+) | X(HCO+) | X(H13CO+) | X(HCN) | X(C2H) | X(H2CO) | X(HDCO) | X(H2 13CO) |
|---|---|---|---|---|---|---|---|---|
| (10−10) | (10−10) | (10−10) | (10−10) | (10−8) | (10−10) | (10−10) | (10−10) | |
| Median | ||||||||
| λ Orionis | 0.96 | 4.31 | 0.87 | 7.64 | 4.51 | 7.89 | 0.25 | 0.13 |
| Orion A | 0.37 | 2.80 | 0.32 | 3.27 | 1.60 | 7.05 | 0.23 | 0.11 |
| Orion B | 0.27 | 3.81 | 0.39 | 3.97 | 1.48 | 5.21 | 0.24 | 0.09 |
| Mean | ||||||||
| λ Orionis | 2.88 | 3.78 | 0.88 | 21.34 | 6.13 | 14.82 | 0.48 | 0.24 |
| Orion A | 0.73 | 3.45 | 0.36 | 4.91 | 1.98 | 7.41 | 0.44 | 0.12 |
| Orion B | 0.75 | 4.12 | 0.45 | 28.47 | 2.23 | 6.17 | 0.24 | 0.10 |
Download table as: ASCIITypeset image
Several FUV-involved pathways are available for C2H formation. The final step in the formation of C2H can be either the photodissociation of C2H2 or dissociative recombination of  (
( + e− → C2H + H2) and
  (
( + e− → C2H + H) (Fuente et al. 1993; Nagy et al. 2015; Bergin et al. 2016). In any case, the FUV radiation plays a key role in providing photons and generating electrons. The median X(C2H) in the λ Orionis cloud is three times higher (4.5 × 10⁻⁸) than those in the Orion A (1.6 × 10⁻⁸) and B (1.5 × 10⁻⁸) clouds. Since the extinction of the UV radiation by H2 is expected to be less effective in the λ Orionis cloud (because of the lower H2 column density, Paper I), the high X(C2H) in the λ Orionis cloud is probably caused by the active photolysis of C2H2.
The HCN molecule can form in three ways—through dissociative recombination (HCNH+ + e− → HCN + H), charge transfer (HCN+ + H → HCN + H+), and neutral–neutral reaction (CH2 + N → HCN + H) (Sternberg & Dalgarno 1995; Hirota et al. 1998; Hasegawa et al. 2000; Boger & Sternberg 2005). In dissociative recombination, once HCNH+ is recombined with free electrons, then the HCN abundance rapidly increases. The sequence of HCN formation also depends on the abundance of "free carbon," either as C+ atomic ions or C atoms. The incident FUV field maintains an extended cloud layer where most of the carbon-bearing molecules are singly ionized. This layer extends deeper into the cloud than does the H i zone because of the effective self-shielding of hydrogen molecules. Thus, C+ atomic ions can exist in conditions where the hydrogen is fully molecular at cloud depths of AV = 0.7–1.7 mag (Sternberg & Dalgarno 1995). AV through the λ Orionis cloud is about 1.25 mag (Goldsmith et al. 2016), which means that the C+ atomic ion can exist throughout the cloud. The C+ ions also play an important role in the formation of HCN+ and CH2 (Boger & Sternberg 2005, see Sections 3.1 and 3.2), which are directly involved in the formation of HCN. The median values of X(HCN) are 7.6 × 10⁻¹⁰, 3.3 × 10⁻¹⁰, and 4.0 × 10⁻¹⁰ in the λ Orionis, Orion A, and B clouds, respectively. All these chemical reactions are possible explanations for the enhanced HCN abundance in the λ Orionis cloud. Another exothermic neutral–neutral reaction with an activation barrier of about 760 K accounts for 50%–70% of the total HCN production in PDRs: CN + H2 → HCN + H (Ea = 760 K) (Hasegawa et al. 2000). This process can drive a high abundance of HCN in the H ii region but is not valid in cores due to their low temperatures.
The cumulative distributions of X(C2H) and X(HCN) are plotted in Figure 3. The high abundances of C2H and HCN in the λ Orionis cloud are consistent with those anticipated from the active photodissociation and dissociative recombination processes. The correlation between the integrated intensities of the C2H and HCN lines can tell whether they have formed through a similar process. The HCN integrated intensity is obtained using the weakest F = 0 → 1 hyperfine component to avoid a self-absorption dip at the systemic velocity. Figure 4 shows a clear correlation between the two integrated intensities of the C2H and HCN lines, suggesting that UV radiation is involved in the formation of the two molecules.
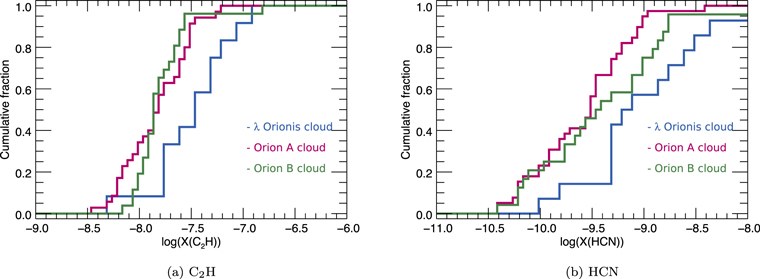
Figure 3. Cumulative distribution of the C2H (left panel) and HCN (right panel) abundances. Different colors denote different clouds. The abundances of C2H and HCN are higher in the λ Orionis cloud than in the Orion A and B clouds.
Download figure:
Standard image High-resolution image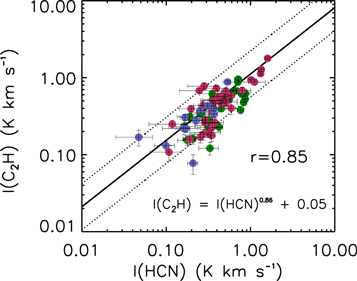
Figure 4. Integrated intensities of HCN vs. those of C2H for cores in the three molecular clouds. The black solid line indicates a least-squares fit to the all data points and the dotted lines indicate 1σ from the line. Different colors denote data points of different clouds (λ: blue, Orion A: magenta, Orion B: green). The Pearson correlation coefficient and relation (log value) are given in the lower right corner.
Download figure:
Standard image High-resolution imageAnother representative species of PDRs is HCO+ (Hasegawa et al. 2000; Hasegawa & Kwok 2001). However, the HCO+ abundance appears to be similar in the three clouds, unlike the C2H and HCN abundances (see Table 8). The HCO+ formation is initiated by singly ionized carbon and OH (Hasegawa et al. 2000). The main channels of formation and destruction of HCO+ are predicted to be


In the λ Orionis cloud, the destruction process of HCO+ could be dominated by photodissociation. Star-forming activities such as the jets/outflows of adjacent protostars can also increase HCO+ abundance, as was suggested in previous studies (Rawlings et al. 2004; Riffel & Lüdke 2010; Walker-Smith et al. 2014; Michiyama et al. 2018). In the Orion A and B clouds, the abundance of HCO+ is enhanced by the star-forming activities in the protostellar cores. The similarity of HCO+ abundance among three clouds implies that the HCO+ line is not a reliable tracer of PDRs, unlike the C2H and HCN molecular lines.
3.3.2. D/H Ratios of Protostellar and Starless Cores
In this section, we examine the deuterium fractions of H2CO in the three clouds. The H2CO molecule is already formed during the pre-collapse phase (n < 5 × 104 cm−3) (Aikawa et al. 2012). Deuterated H2CO (HDCO) molecules form in the ice mantles of dust grains via the hydrogenation of CO ice (Fontani et al. 2015; Walsh et al. 2015), and the deuterium fractions in the cores are mostly settled before their collapse begins (Turner 1990; Roberts et al. 2002; Aikawa et al. 2012). Thus, the [HDCO]/[H2CO] ratio is mostly maintained during the early evolutionary phase of cores, where the dust temperature is lower than the sublimation temperatures of the molecules (Codella et al. 2012). However, the UV photons from massive (proto)stars can also desorb molecules from dust grains via photodesorption (Tielens & Hagen 1982; Hasegawa et al. 1992; Walsh et al. 2010).
Other molecules, such as N2H+ and HNC, and their deuterated isotopologues (N2D+ and DNC) have also been used to measure the D/H ratio in massive star-forming regions (Fontani et al. 2015) and the Orion region (Kim et al. 2020). However, Kim et al. (2020) did not find significant differences in the D/H ratios of starless cores in the Orion region (the λ Orionis, Orion A, and B clouds). The N2D+ and DNC molecules can form in the gas phase, mainly from a route involving the H2D+ ion (Gerlich et al. 2002; Parise et al. 2009). However, the H2D+ ion can be destroyed by electrons and then dissociate into the H2 molecule and D atom (Datz et al. 1995; Lee et al. 2003). The deuterium atom (produced by the dissociative recombination of deuterated ions) then becomes frozen onto grain surfaces to form molecular ices, resulting in a high abundance of HDCO via grain-surface hydrogenation (Tielens 1983; Aikawa et al. 2012; Lee & Bergin 2015). Thus, the different formation processes of deuterated molecules can lead to relevant differences in their D/H ratios (Aikawa et al. 2012); the freezing of deuterium onto grain surfaces could reduce the efficiency of deuteration in a molecule in the gas phase (Lee & Bergin 2015).
We present the mean D/H ratio of H2CO in protostellar and starless cores in Table 9. The mean values in protostellar cores are similar in the three clouds. In starless cores, the mean D/H ratio is higher by a factor of 1.4 in the Orion A (0.079 ± 0.006) and B (0.081 ± 0.006) clouds than in the λ Orionis cloud (0.056 ± 0.005). The low D/H ratio of starless cores in the λ Orionis cloud indicates that they are probably warmer than the starless cores in the other two clouds.
Table 9. Mean fD [HDCO]/[H2CO] of Cores within the Three Clouds
| Cores | λ Orionis | Orion A | Orion B |
|---|---|---|---|
| Total cores | 0.046 ± 0.001 | 0.060 ± 0.004 | 0.064 ± 0.005 |
| Protostellar cores | 0.028 ± 0.005 | 0.020 ± 0.007 | 0.021 ± 0.004 |
| Starless cores | 0.056 ± 0.005 | 0.079 ± 0.006 | 0.081 ± 0.006 |
Download table as: ASCIITypeset image
Figure 5 shows the distributions of the D/H ratios of H2CO in each cloud. The ratios range from 0.01 to 0.26, which are consistent with values from 0.03 to 0.31 derived from the low-mass Class 0 protostars in the Orion A and B clouds (Kang et al. 2015). The red dotted lines represent a D/H ratio of 0.10; four starless cores exhibit D/H ratios >0.1 in each of the Orion A (G207.36-19.82N3, G209.55-19.68S2, G209.94-19.52S1, and G211.16-19.33N3) and B (G203.21-11.20E1, G203.21-11.20W1, G204.4-11.3A2W, and G206.69-16.60N) clouds, while none of the starless cores show a high ratio in the λ Orionis cloud. The fractions of cold starless cores with a D/H ratio greater than 0.1 are 0 (0/6), 0.36 (4/11), and 0.27 (4/15) in the λ Orionis, Orion A, and B clouds, respectively.
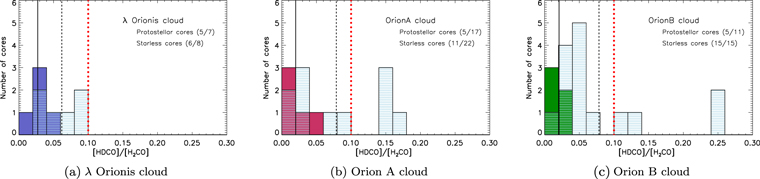
Figure 5. Distributions of [HDCO]/[H2CO] in three different clouds. The [HDCO]/[H2CO] distributions of protostellar and starless cores are shown as filled and shaded histograms, respectively. The numbers of detected protostellar and starless cores are presented in each panel. The black solid and dashed lines represent mean values of protostellar and starless cores, respectively. The red dotted line indicates the [HDCO]/[H2CO] ratio of 0.1.
Download figure:
Standard image High-resolution imageThe low D/H ratio of H2CO derived from the starless cores in the λ Orionis cloud is a result that is consistent with its higher temperature (16 K) compared to the temperatures (13–14 K) in the Orion A and B clouds (Paper I). This low D/H ratio, resulting from the warm conditions prior to the collapse phase, has been hinted at in hot molecular cores, where the molecules are sublimated thermally from the grain surfaces around massive young stars (Loinard et al. 2002).
3.3.3. Relation of D/H Ratios and Lbol, Tbol, and Mcore/Lbol
To examine the chemical evolutionary stages of protostellar cores, we investigated variations in D/H ratios with bolometric luminosity (Lbol), temperature (Tbol), and mass-to-luminosity ratio (Mcore/Lbol). CO molecules are highly depleted in the early evolutionary stage at low temperature. In the more evolved stage of protostellar cores, CO and H2CO are released from the dust grains by shocks and sublimation at T ≳ 17 K (Martín-Doménech et al. 2014). However, deuterium fractionation is not affected by shocks, mantle evaporation, or accretion after the Class 0 stage (Roberts et al. 2002; Lee et al. 2004).
Lbol is directly related to the accretion rate of a central protostar in the early embedded evolutionary stage. Since the accretion shocks heat the envelope, an anticorrelation is expected between the D/H ratios and Lbol. In contrast, the core mass decreases with time, so that the mass-to-luminosity ratio would decline as protostars evolve. Tbol is also a useful evolutionary indicator of young stellar objects. We have calculated the Pearson correlation coefficient to investigate the relation between the D/H ratio of H2CO and those physical parameters (Lbol, Tbol, and Mcore/Lbol).
Figure 6 shows the D/H ratios of H2CO for 15 protostellar cores in the three clouds with respect to Lbol, Tbol, and Mcore/Lbol. There is no clear correlation between the ratio and Tbol as suggested by Kang et al. (2015) and Roberts et al. (2002). The D/H ratio shows an anticorrelation with Lbol, while it reveals a linear correlation with Mcore/Lbol. Most of the detected cores follow the trends within a standard deviation of 0.01. If the mass-to-luminosity ratio is a good tracer of evolutionary stage, the D/H ratio seems to trace well the early stage of star formation. The protostellar cores in the λ Orionis cloud have larger Mcore/Lbol than those in the Orion A and B clouds. This indicates that the five protostellar cores in the λ Orionis cloud are likely in the early stage of star formation. Since the intense FUV photons heat up the molecular gas and dust particles, the transition of cores from prestellar to protostellar stage is impeded in the λ Orionis cloud. Therefore, the chemical timescales in the prestellar or protostellar stage in the λ Orionis cloud might differ from those in the Orion A and B clouds because of the different dynamical timescale, as well as the direct effect of the enhanced FUV radiation environment. We further explore the chemical timescale of cores in each cloud, depending on the FUV radiation field, in the next Section 3.3.4.

Figure 6. [HDCO]/[H2CO] ratios for protostellar cores in each cloud with respect to the bolometric luminosity (left), the temperature (middle), and the ratio of core mass to bolometric luminosity (right). Different colors indicate different regions as used in Figure 1. The gray shaded region corresponds to the standard deviation (0.01) of the D/H ratios from the linear least-squares fitting result. The Pearson correlation coefficient is shown in the bottom right corner of each panel.
Download figure:
Standard image High-resolution image3.3.4. N2H+ to HCO+ Ratios
To estimate the chemical ages of the cores, we probed the HCO+ and N2H+ abundances in the cores. The CO molecules are desorbed from grain mantles under high-temperature (>20 K) conditions. The CO desorption causes significant destruction of the N2H+ molecules, leading to the formation of HCO+ (Jørgensen et al. 2004; Lee et al. 2004). Several previous studies have suggested the N(N2H+)/N(HCO+) ratio as a chemical clock because the HCO+ abundance increases with respect to N2H+ as a core evolves to a warmer phase (Turner & Thaddeus 1977; Sanhueza et al. 2012; Ohashi et al. 2014). From this reaction, we expect a higher N(N2H+)/N(HCO+) ratio in the λ Orionis cloud because the timescale of the prestellar stage in the cloud is considered to be longer than those in the Orion A and B clouds.
Figure 7 shows the relation between the column densities of N2H+ and HCO+ in each cloud. The median values of the N(N2H+)/N(HCO+) ratio in the starless cores are 0.27, 0.17, and 0.13, and those in protostellar cores are 0.26, 0.14, and 0.04 in the λ Orionis, Orion A, and B clouds, respectively. The ratio in the protostellar cores of the λ Orionis cloud is higher than those in the Orion A and B clouds by factors of two and six, respectively. In the λ Orionis cloud, the difference between the median values in the starless and protostellar cores (0.01) is negligible, while the difference is significant (0.09) in the Orion B cloud. These results imply that the protostellar cores in the λ Orionis cloud might be chemically very young, not much different from the starless cores.
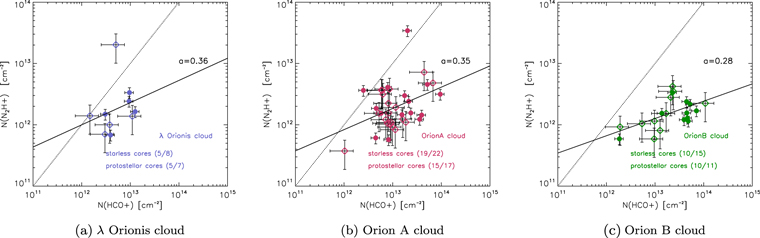
Figure 7. Column density of N2H+ with respect to the column density of HCO+. Filled circles and open diamonds represent protostellar and starless cores, respectively. The solid and dotted lines indicate least-squares fits to the total cores and the ratio of 1.0, respectively. The slope of the fitted relation is given in the upper right corner of each panel.
Download figure:
Standard image High-resolution imageWe also investigated the N(N2H+)/N(HCO+) ratios in protostellar cores harboring different evolutionary stages of YSOs. The median ratio for Class 0 objects (a total of 13 in the three clouds) is about 0.14, while Class I sources (11) and YSOs showing a flat spectrum (5) have slightly smaller values of 0.09. The median values suggest that the N(N2H+)/N(HCO+) ratios act as a chemical clock, decreasing with the evolution of cores. The results from this and other previous studies demonstrate that the N(N2H+)/N(HCO+) ratio is indeed a good tracer of chemical evolution, from prestellar to protostellar stages. This high N(N2H+)/N(HCO+) ratio in the λ Orionis cloud suggests that the lifetime of prestellar cores in the λ Orionis cloud is longer than those in the Orion A and B clouds. This longer timescale for the prestellar stage can result in enhanced abundances of nitrogen-bearing molecules via the reaction with N2 gas (Lee et al. 2003). The median abundance of N2H+ is the highest in the λ Orionis cloud (9.6 × 10⁻⁹, see Table 8), consistent with our scenario.
This scenario might also be supported by the different median line widths, which are affected by turbulence (Section 3.2). Turbulence can promote the evolution of cores and shorten the timescale of cores in the prestellar stage, because it can generate density and velocity fluctuations that develop instabilities and consequently contribute to the formation of filaments (Vázquez-Semadeni et al. 2019). The turbulent motions in the Orion A and B clouds appear to be larger than those measured in the λ Orionis cloud (see Table 7). In addition, most clumps and cores in the λ Orionis cloud are isolated and compact, while the clumps in the Orion A and B clouds are extended along filaments, and the cores are very clustered (Paper I). The mean column density of cores in the λ Orionis cloud is 0.9 × 1023 cm−2, which is two to four times lower than those in the Orion A (2.3 × 1023 cm−2) and B clouds (3.8 × 1023 cm−2, Paper I). The CFE is much lower in the λ Orionis cloud, as discussed further in Section 5. Consequently, prestellar cores in the λ Orionis cloud are less affected by turbulence, and thus have a longer timescale to reach the protostellar stage, resulting in more abundant nitrogen-bearing molecules.
In summary, according to the N(N2H+)/N(HCO+) ratios, the protostellar cores in the λ Orionis cloud are chemically younger than those in the Orion A and B clouds. This result is consistent with the fact that the formation and evolution of cores seem to be retarded by stellar feedback in the λ Orionis cloud, as discussed in Section 3.3.3. Thus, the relative abundance of N2H+ to HCO+ is the result of chemical evolution as well as the different star-forming environments, especially the FUV radiation.
4. Infall Motions in the Three Clouds
Gravitational collapse is one of the key signatures of ongoing star formation. According to the "inside-out" collapse model and observations of protostellar cores (Shu 1977; Myers et al. 1996; Evans 1999, 2003), an asymmetric double-peaked velocity profile with a higher peak intensity in the blueshifted part can be a tool to probe infall motions. To detect this signature in the three clouds, we used both optically thick HCO+ (J = 1−0) and optically thin H13CO+ (J = 1−0) lines. The HCO+ molecular line has been widely used to investigate infall motions (e.g., Fuller et al. 2005; Wu et al. 2007; Rygl et al. 2013; Yoo et al. 2018). A combination of HCO+ and H13CO+ molecular lines is, in general, employed to disentangle an asymmetric "blue profile." The HCN line is also a good tracer of gravitational inflow (Wu & Evans 2003; Jin et al. 2016), but this line was not used in this study because its optically thin isotope line (H13CN) was not observed in our KVN observations. The HCN line has hyperfine components that are strongly self-absorbed and blended, also making it difficult to use in our inflow analysis.
Line asymmetry can be measured by calculating a normalized velocity difference δV as in the following equation (Mardones et al. 1997):
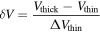
where Vthick, Vthin, and ΔVthin are the peak velocities of the optically thick and thin lines, and the FWHM of the optically thin line, respectively. The observed lines can be classified as either blue or red profile if the difference between Vthick and Vthin is greater than a quarter of ΔVthin. Mardones et al. (1997) established criteria for assessing the line asymmetry as follows: blue profile (B) for δV < −0.25, red profile (R) for δV > 0.25, and neutral profile (N) for −0.25 ≤ δ
V ≤0.25. We adopted these criteria to search for cores showing infall motions. The observed line parameters and derived δV are listed in Table 10. The resulting mean values of δV in each cloud are −0.09, −0.07, and −0.06 for the λ Orionis, Orion A, and B clouds, respectively. The distribution of δV shows the largest spread in the Orion A cloud (from −1.41 to +1.22), implying the diversity in the evolutionary stage of star-forming cores in the cloud. For the 19 infall candidates, the infall rate ( ) is roughly estimated using
  (López-Sepulcre et al. 2010), and their line profiles are presented in Figure 8. An infall velocity (
 ) is determined from
  –
–  , ρ = M/(4π
R3/3) is the core volume density, and R is the radius of the core. We have used R and M derived from the dust continuum emission at 850 μm of SCUBA-2 (Paper I).
, ρ = M/(4π
R3/3) is the core volume density, and R is the radius of the core. We have used R and M derived from the dust continuum emission at 850 μm of SCUBA-2 (Paper I).  is listed in the last column of Table 10. The mean
  is the highest in the Orion B cloud (5.0 × 10⁻⁵
M☉ yr−1), which is twice as high as that of the λ Orionis (2.5 × 10⁻⁵
M☉ yr−1) and Orion A clouds (2.2 × 10⁻⁵
M☉ yr−1).
is the highest in the Orion B cloud (5.0 × 10⁻⁵
M☉ yr−1), which is twice as high as that of the λ Orionis (2.5 × 10⁻⁵
M☉ yr−1) and Orion A clouds (2.2 × 10⁻⁵
M☉ yr−1).
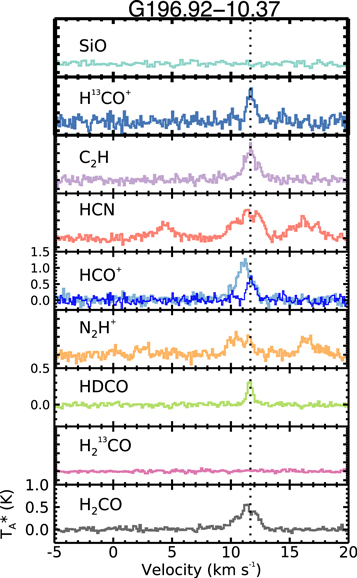
Figure 8.
Spectra of 80 cores observed with the KVN telescopes in nine molecular lines. The vertical dotted line indicates the systemic velocity of the core. The y-axis is 0–1 K in  scale as shown in the panel for H2CO except for some molecules such as HCO+ and HDCO. The blue thin line in the HCO+ panel represents the H13CO+ line emission. (The complete figure set (80 images) is available.)
Download figure:
Standard image High-resolution imageTable 10. Spectral Line Velocities, Line Asymmetry, and Infall Rate
| Cloud | Source Name | Vthick | Vthin | ΔVthin | δv | Profile |

|
|---|---|---|---|---|---|---|---|
| (km s−1) | (km s−1) | (km s−1) | (10−6 M☉ yr−1) | ||||
| λ Orionis | G190.15-13.75N | ⋯ | ⋯ | ⋯ | ⋯ | ⋯ | ⋯ |
| G190.15-13.75S | 1.27 | 1.32 | 0.45 | −0.11 | neutral | ⋯ | |
| G191.90-11.21N | 10.87 | ⋯ | ⋯ | ⋯ | ⋯ | ⋯ | |
| G191.90-11.21S | 10.51 | 10.55 | 0.87 | −0.05 | neutral | ⋯ | |
| G192.12-10.90N | 9.61 | 9.96 | 0.67 | −0.52 | blue | 5.78 | |
| G192.12-10.90S | ⋯ | ⋯ | ⋯ | ⋯ | ⋯ | ⋯ | |
| G192.12-11.10 | 10.29 | 10.22 | 0.65 | 0.12 | neutral | ⋯ | |
| G192.32-11.88N | 12.41 | 12.15 | 0.88 | 0.29 | red | ⋯ | |
| G192.32-11.88S | 12.23 | 12.10 | 0.85 | 0.15 | neutral | ⋯ | |
| G196.92-10.37 | 11.06 | 11.66 | 0.79 | −0.76 | blue | 45.23 | |
| G198.69-09.12N1 | 10.91 | 11.07 | 0.73 | −0.22 | neutral | ⋯ | |
| G198.69-09.12N2 | 10.81 | ⋯ | ⋯ | ⋯ | ⋯ | ⋯ | |
| G198.69-09.12S | 11.03 | 11.10 | 1.07 | −0.07 | neutral | ⋯ | |
| G200.34-10.97N | 13.68 | 13.42 | 0.91 | 0.28 | red | ⋯ | |
| G200.34-10.97S | 14.31 | ⋯ | ⋯ | ⋯ | ⋯ | ⋯ | |
| Orion A | G207.36-19.82N1 | 10.68 | 10.68 | 2.31 | 0.01 | neutral | ⋯ |
| G207.36-19.82N2 | 10.75 | 11.06 | 0.98 | −0.31 | blue | 10.45 | |
| G207.36-19.82N3 | 11.09 | 11.19 | 0.80 | −0.12 | neutral | ⋯ | |
| G207.36-19.82N4 | 11.18 | 11.17 | 1.21 | 0.01 | neutral | ⋯ | |
| G208.68-19.20N1 | 11.16 | 11.14 | 0.93 | 0.02 | neutral | ⋯ | |
| G208.68-19.20N2 | 11.13 | 11.15 | 0.92 | −0.02 | neutral | ⋯ | |
| G208.68-19.20N3 | 10.99 | 11.07 | 1.20 | −0.07 | neutral | ⋯ | |
| G208.68-19.20S | 10.82 | 10.61 | 1.59 | 0.13 | neutral | ⋯ | |
| G209.55-19.68N1 | 7.03 | 7.32 | 0.45 | −0.64 | blue | 4.11 | |
| G209.55-19.68N2 | 8.04 | 8.15 | 0.50 | −022 | neutral | ⋯ | |
| G209.55-19.68N3 | 7.75 | 8.16 | 0.71 | −0.58 | blue | 23.04 | |
| G209.55-19.68S1 | 7.42 | 7.49 | 1.08 | −0.07 | neutral | ⋯ | |
| G209.55-19.68S2 | 7.89 | 8.03 | 0.66 | −0.20 | blue | 6.12 | |
| G209.77-19.40E1 | 8.18 | 8.02 | 0.50 | 0.32 | red | ⋯ | |
| G209.77-19.40E2 | 8.29 | 8.07 | 0.56 | 0.39 | red | ⋯ | |
| G209.77-19.40E3 | 8.16 | 7.94 | 0.71 | 0.32 | red | ⋯ | |
| G209.77-19.40W | 8.36 | 8.31 | 0.33 | 0.16 | neutral | ⋯ | |
| G209.77-19.61E | 7.95 | 8.06 | 0.62 | −0.17 | neutral | ⋯ | |
| G209.77-19.61W | 7.20 | 7.19 | 0.59 | 0.02 | neutral | ⋯ | |
| G209.79-19.80E | 5.52 | 5.45 | 0.49 | 0.13 | neutral | ⋯ | |
| G209.79-19.80W | 5.86 | 5.89 | 0.99 | −0.02 | neutral | ⋯ | |
| G209.94-19.52N | 7.77 | 7.95 | 0.83 | −0.23 | neutral | ⋯ | |
| G209.94-19.52S1 | 8.29 | 8.09 | 0.93 | 0.21 | neutral | ⋯ | |
| G209.94-19.52S2 | 7.76 | 7.70 | 1.05 | 0.06 | neutral | ⋯ | |
| G210.49-19.79E1 | 8.86 | 8.82 | 0.91 | 0.04 | neutral | ⋯ | |
| G210.49-19.79E2 | 9.52 | 10.22 | 0.91 | −0.77 | blue | 138.95 | |
| G210.49-19.79W | 9.19 | 9.11 | 0.93 | 0.08 | neutral | ⋯ | |
| G210.97-19.33N | 3.59 | 3.91 | 0.84 | −0.39 | blue | 7.19 | |
| G210.97-19.33S2 | 3.25 | 3.47 | 1.68 | −0.13 | neutral | ⋯ | |
| G211.16-19.33N1 | 3.04 | 3.27 | 0.80 | −0.28 | blue | 5.06 | |
| G211.16-19.33N2 | 3.36 | 3.55 | 0.67 | −0.28 | blue | 2.91 | |
| G211.16-19.33N3 | 3.36 | 3.30 | 0.59 | 0.11 | neutral | ⋯ | |
| G211.16-19.33N4 | 4.19 | 4.55 | 0.81 | −0.45 | blue | 4.33 | |
| G211.16-19.33N5 | 3.38 | 4.48 | 1.02 | −1.09 | blue | 17.99 | |
| G211.16-19.33S | 4.09 | 3.31 | 0.71 | 1.10 | red | ⋯ | |
| G215.44-16.38 | 11.31 | 11.38 | 0.44 | −0.16 | neutral | ⋯ | |
| G215.87-17.62N | 9.34 | 9.21 | 0.63 | 0.20 | neutral | ⋯ | |
| G215.87-17.62M | 9.00 | 9.02 | 0.78 | −0.04 | neutral | ⋯ | |
| G215.87-17.62S | 9.61 | ⋯ | ⋯ | ⋯ | ⋯ | ⋯ | |
| Orion B | G201.52-11.08 | 9.37 | ⋯ | ⋯ | ⋯ | ⋯ | ⋯ |
| G201.72-11.22 | 9.94 | ⋯ | ⋯ | ⋯ | ⋯ | ⋯ | |
| G203.21-11.20E1 | 9.61 | 10.21 | 1.28 | −0.47 | blue | 38.32 | |
| G203.21-11.20E2 | 9.65 | 10.29 | 1.23 | −0.52 | blue | 43.44 | |
| G203.21-11.20W1 | 9.64 | 10.46 | 1.13 | −0.73 | blue | 58.87 | |
| G203.21-11.20W2 | 9.63 | 10.21 | 0.74 | −0.78 | blue | 44.63 | |
| G204.4-11.3A2E | 1.77 | 1.56 | 0.63 | 0.33 | red | ⋯ | |
| G204.4-11.3A2W | 1.75 | 1.67 | 0.71 | 0.10 | neutral | ⋯ | |
| G205.46-14.56N2 | 9.86 | 9.84 | 1.04 | 0.02 | neutral | ⋯ | |
| G205.46-14.56N3 | 9.94 | 9.90 | 0.94 | 0.04 | neutral | ⋯ | |
| G205.46-14.56M1 | 10.06 | 10.02 | 0.93 | 0.05 | neutral | ⋯ | |
| G205.46-14.56S1 | 9.99 | 10.12 | 1.18 | −0.11 | neutral | ⋯ | |
| G205.46-14.56S2 | 10.54 | 10.42 | 0.65 | 0.20 | neutral | ⋯ | |
| G205.46-14.56S3 | 10.36 | 10.41 | 0.61 | −0.09 | neutral | ⋯ | |
| G206.12-15.76 | 8.34 | 8.51 | 0.63 | −0.27 | blue | 14.37 | |
| G206.21-16.17N | 9.84 | 9.87 | 0.65 | −0.04 | neutral | ⋯ | |
| G206.21-16.17S | 9.55 | 9.53 | 0.33 | 0.06 | neutral | ⋯ | |
| G206.69-16.60N | 11.42 | 11.40 | 0.36 | 0.07 | neutral | ⋯ | |
| G206.69-16.60S | 12.12 | 12.03 | 0.80 | 0.11 | neutral | ⋯ | |
| G206.93-16.61E1 | 10.00 | 9.83 | 0.98 | 0.17 | neutral | ⋯ | |
| G206.93-16.61E2 | 9.67 | 9.71 | 0.85 | −0.05 | neutral | ⋯ | |
| G206.93-16.61W1 | 9.02 | 9.29 | 0.96 | −0.28 | blue | 16.04 | |
| G206.93-16.61W3 | 9.39 | 9.64 | 1.70 | −0.14 | neutral | ⋯ | |
| G206.93-16.61W4 | 9.39 | 9.89 | 1.03 | −0.49 | blue | 136.04 | |
| G206.93-16.61W5 | 9.33 | 9.40 | 1.79 | −0.04 | neutral | ⋯ | |
| G206.93-16.61W6 | 9.33 | 9.39 | 2.34 | −0.02 | neutral | ⋯ | |
Only a portion of this table is shown here to demonstrate its form and content. A machine-readable version of the full table is available.
To quantify the dominance of the blue profile, the blue excess (E) was measured using the following relation (Mardones et al. 1997):

where Nblue, Nred, and Ntotal represent the numbers of cores having blue and red profiles, and the total number of samples, respectively. We found the highest blue excess of E = 0.25 in the Orion B cloud and a less significant blue excess of E = 0.16 in the Orion A cloud. The estimated values in the Orion A and B clouds are comparable to the results in previous infall studies in active star-forming regions (e.g., Fuller et al. 2005; Wu et al. 2007; He et al. 2015; Yoo et al. 2018). On the other hand, we found no significant blue excess in the λ Orionis cloud (E = 0.00). The highest blue excess in the Orion B cloud indicates the dominance of the blue profile caused by infall motions, which is consistent with the fact that the Orion B cloud is the most active star-forming region among the three clouds, while the λ Orionis cloud is considered to be an inactive star-forming region. These results are summarized in Table 11. In summary, our results support the idea that UV radiation can heat the gas and suppress core formation in the λ Orionis cloud.
Table 11. Blue Excess (E) Statistics
| Cloud | Infall Tracer | NBlue | NRed | NTotal | E |
|---|---|---|---|---|---|
| λ Orionis | HCO+ | 2 | 2 | 10 | 0.0 |
| Orion A | HCO+ | 10 | 4 | 38 | 0.13 |
| Orion B | HCO+ | 7 | 2 | 25 | 0.20 |
Download table as: ASCIITypeset image
5. Discussion
Stars influence their local environment through various energetic processes, such as protostellar outflows, stellar winds, intense UV radiation, and supernova explosions. These processes usually occur around massive OB-type stars, and thus the stellar feedback from massive stars can trigger new star formation or otherwise destroy potential sites of star formation. Positive stellar feedback in the sense of triggered star formation has been steadily studied by simulations and observations (Thompson et al. 2004; Bisbas et al. 2011; Koenig et al. 2012; Lim et al. 2014, 2018). In contrast, in some cases, the stellar feedback can lower the integrated SFE, to a few percent, and eventually lead to the dissolution of molecular clouds after a dynamical time (10–30 Myr) (Lada & Lada 2003; Walch et al. 2012; Dale et al. 2013; Kruijssen et al. 2019). This process is usually referred to as negative feedback or suppressed star formation.
A supernova explosion plays an important role in shaping molecular clouds and regulating star formation (Preibisch & Zinnecker 2001; Smith 2004). According to several observations and simulations, the large-scale expansion of the λ Orionis cloud can be attributed to a supernova because of its high expansion velocity of 14–25 km s−1 (Maddalena & Morris 1987; Cunha & Smith 1996; Dolan & Mathieu 1999, 2002; Lang et al. 2000; Mathieu 2008; Kounkel et al. 2018). The resulting shock wave created the low-density cavity and aborted star formation in the central region near the massive star λ Ori (Mathieu 2008). A series of numerical simulations by Shima et al. (2017) compared the effects of star formation alone, photoionization by massive stars, and the feedback from supernovae as well as photoionization. Their result argues that a sudden thermal injection from a supernova is less effective than the continuous energy of UV radiation at preventing further fragmentation and reducing the accretion rates of forming protostars. Hence, the environmental effect on ongoing star formation in the λ Orionis cloud is likely dominated by the radiative feedback from λ Ori.
The intense UV radiation fields of massive stars can increase the dissociation and ionization of cloud material and affect the physical and chemical properties of cores. This study shows that FUV radiation modifies the relative molecular abundances in the λ Orionis cloud via the photolysis of molecules, as presented in Section 3. Furthermore, FUV absorption by dust grains can heat the grains themselves, or heat gas via photoelectric ejection (Draine 1978; Hollenbach & Tielens 1999). We found that the dust temperature of clumps is higher on average in the λ Orionis cloud than in the Orion A and B clouds. A decreasing gradient of dust temperature with projected distance from λ Ori was also found in the λ Orionis cloud (Figure 11 of Paper I). This suggests that the central star has a great influence on various scales, including cores, clumps, and even the entire molecular cloud.
The EUV photons (i.e., with energy greater than 13.6 eV) from λ Ori ionize atomic hydrogen and contribute to the formation of a giant H ii region (Sh 2-264, a radius of 34.5 pc) in the λ Orionis cloud (Maddalena & Morris 1987). The high-energy photons can photoevaporate the dense material, leading to the lowest dense gas fraction (0.1) in the λ Orionis cloud, which can be interpreted as a low CFE. Using the column-density power spectrum of 29 clouds, Federrath & Klessen (2013) measured the SFEs and found that the SFEs increase from zero in large-scale H i clouds and non-star-forming clouds to 1%–10% in typical star-forming molecular clouds, and to >10% in dense cores. This study suggests that the ratio of CFE to SFE eventually approaches 0.3–0.7. The CFE was lowest in the λ Orionis cloud, and thereby the SFE should also be lowest in the cloud.
On the other hand, the Orion B cloud with the highest CFE (0.2) is expected to have the highest SFE. The EUV photons can also hinder the further fragmentation of clumps. This leads to a lower multiplicity (the number of cores in one clump, see Section 4.3 in Paper I) in the λ Orionis cloud (1.8) than in the Orion A (3.2) and B (3.3) clouds. Among the three clouds, the cores in the λ Orionis cloud have the lowest median values of mass (0.77 M☉), size (0.09 pc), column density (8.2 × 1022 cm−2), and volume density (2.5 × 105 cm−3). These physical properties suggest that since the supernova explosion, the remnant of the cloud has been continuously affected by UV radiation; dense gas became deficient, and thus core formation was suppressed in the λ Orionis cloud.
Morphological differences are also found between clouds or substructures with similar scales (see Figures 1–5 in Paper I). The entire molecular clouds of Orion A and B have filamentary structures, while the λ Orionis cloud has a ring-shaped structure. One difference among the observed substructures is the shape of clumps and the number of cores within those clumps. The clumps in the Orion A and B clouds follow the filamentary shapes of their natal clouds, while those in the λ Orionis cloud are compact and spatially isolated. The elongated and complex filaments can be explained by a cascade of turbulent motions (e.g., Mac Low & Klessen 2004; Hennebelle & Falgarone 2012), which is supported by the large line widths of HCO+, C2H, HCN, and H2CO (see Section 3.2). Furthermore, the cores within filaments appear to contain more gas at very high density (n(H2) > 106 cm−3, see Table 5 in Paper I) and to be more highly clumped than those cores without filaments in the λ Orionis cloud. The fragmentation of clumps might be enhanced by turbulence in the Orion A and B clouds, which results in the high multiplicity in the two clouds.
We have examined the effects of stellar feedback on cores in the OMC, focusing on chemical processes. This study is the first finding of observational support for negative stellar feedback on core formation and evolution. We found that prior formation of massive stars suppressed further star formation in the λ Orionis cloud due to the radiative feedback from λ Ori. In the majority of studies of prior star formation, positive stellar feedback has mainly been considered. As presented in this study, however, negative feedback could be more significant in the star formation process than positive feedback in some cases. Therefore, not only the positive aspects but also the negative effects of stellar feedback should be carefully considered for a detailed understanding of star formation.
6. Summary
We performed single-point molecular line observations toward 80 cores in the λ Orionis, Orion A, and B clouds to investigate the chemical properties of cores in different star-forming environments. Eleven molecular lines, including two maser lines (Figures 8 and 9), were observed using the KVN 21 m telescopes. The results from this work, combined with our previous study (Paper I), provide many observational features of suppressed star formation in the λ Orionis cloud as follows.
- 1.The detection rates of dense gas tracers such as N2H+, HCO+, and H13CO+ lines were the lowest in the λ Orionis cloud among the three clouds. This result supports our scenario that high-energy photons from the massive star (λ Ori) can photoevaporate dense dust and gas, leading to the low detection rates toward cores in the λ Orionis cloud.
- 2.The significant variation in deuterium fractionation [HDCO]/[H2CO] from 0.01 to 0.26 indicates that cores have formed in diverse conditions of temperature and density. High deuterium fractionations in excess of 0.1 were found in the eight starless cores of the Orion A and B clouds, while none of the starless cores in the λ Orionis cloud showed such a high ratio. The low D/H ratio in the λ Orionis cloud is likely due to the FUV radiation from the massive OB stars. FUV radiation heats the entire cloud, hindering the deuteration of H2CO on the grain surfaces.
- 3.The fractional abundance N(N2H+)/N(HCO+) can be used as a chemical clock. This ratio was the highest in the λ Orionis cloud (0.26). The Orion A and B clouds had moderate (0.16) and the lowest (0.10) values, respectively. The highest ratio in the λ Orionis cloud implies that the cores in that cloud stayed longer in the prestellar stage than those in the Orion A and B clouds. The formation and evolution of cores seems to have been delayed by stellar feedback in the λ Orionis cloud.
- 4.The mean abundances of PDR tracers, C2H and HCN, were about three and two times higher in the λ Orionis cloud (4.5 × 10⁻⁸ and 7.6 × 10⁻¹⁰) than in the Orion A (1.6 × 10⁻⁸ and 3.3 × 10⁻¹⁰) and B (1.5 × 10⁻⁸ and 4.0 × 10⁻¹⁰) clouds, respectively. Photodissociation and dissociative recombination processes that were active due to the intense UV radiation from λ Ori significantly impacted the chemistry of the cores.
- 5.The blue excess (E) in the HCO+ (1–0) line was the highest in cores in the Orion B cloud (E = 0.2), which indicates that the most active star formation is occurring in the Orion B cloud among the three clouds. On the other hand, we could not find any sign of blue excess (E = 0) in the λ Orionis cloud, implying suppressed star-forming activity.
Our findings support the idea that feedback from massive stars can control star formation in a negative way. A more detailed study of the kinematics and temperature distribution within the molecular cores with mapping observations at higher spatial resolution is necessary to interpret negative feedback on star formation properly.
This work was supported by the Basic Science Research Program through the National Research Foundation of Korea (grant No. NRF-2018R1A2B6003423) and the Korea Astronomy and Space Science Institute under the R&D program supervised by the Ministry of Science, ICT and Future Planning. We are grateful to the staff of the KVN who helped to operate the array and to correlate the data. The KVN is a facility operated by the KASI (Korea Astronomy and Space Science Institute). The KVN observations and correlations are supported through the high-speed network connections among the KVN sites provided by the KREONET (Korea Research Environment Open NETwork), which is managed and operated by the KISTI (Korea Institute of Science and Technology Information). Tie Liu acknowledges the support from the international partnership program of Chinese Academy of Sciences through grant No.114231KYSB20200009, National Natural Science Foundation of China (NSFC) through grant NSFC No.12073061, and Shanghai Pujiang Program 20PJ1415500. B.L. acknowledges the support of the NRF grant funded by the Korea government (MSIT) (grant No. NRF-2019R1C1C1005224). K.T. was supported by JSPS KAKENHI grant No. 20H05645.
Appendix A: Column Densities of Cores
We calculated column densities of seven molecules (HCO+, H13CO+, H2CO, HDCO, N2H+, C2H, and HCN). These lines are assumed to be optically thin, except HCO+. Since the core sizes are similar to the main-beam sizes, the beam filling factor (ηf ) was treated as 1. Under the consideration that the gas and dust are well coupled in cores with high densities (n > 105 cm−3) via collisions (Goldreich & Kwan 1974), the dust temperatures (Td) are almost the same as the excitation temperatures (Tex) (Galli et al. 2002). The resulting column densities of seven molecules are given in Table 12. Figure 8 shows the spectra of nine molecular emission lines including SiO and H2 13CO for 80 cores.
Table 12. Column Densities of Seven Molecules and H2 toward Three Molecular Clouds
| Cloud | Core | Associated YSO | N2H+ | HCO+ | H13CO+ | HCN | C2H | H2CO | HDCO | H2 (30'') a | H2 (20'') b |
|---|---|---|---|---|---|---|---|---|---|---|---|
| (1012 cm−2) | (1012 cm−2) | (1012 cm−2) | (1012 cm−2) | (1014 cm−2) | (1013 cm−2) | (1012 cm−2) | (1022 cm−2) | (1022 cm−2) | |||
| λ Orionis | G190.15-13.75N | ⋯ | ⋯ | ⋯ | ⋯ | ⋯ | ⋯ | ⋯ | ⋯ | 1.51 | 5.79 |
| G190.15-13.75S | ⋯ | ⋯ | 3.43 | 0.42 | 9.54 | ⋯ | 1.53 | 0.49 | 1.71 | 4.83 | |
| G191.90-11.21N | Class 0 | ⋯ | 7.58 | ⋯ | 28.21 | ⋯ | 12.49 | ⋯ | 1.56 | 1.47 | |
| G191.90-11.21S | ⋯ | 0.70 | 3.01 | 0.69 | 78.64 | 12.40 | 3.17 | 3.11 | 0.64 | 3.13 | |
| G192.12-10.90N | ⋯ | 1.00 | 3.77 | 1.23 | 10.49 | 10.20 | 4.03 | 3.18 | 0.74 | 1.78 | |
| G192.12-10.90S | flat | ⋯ | ⋯ | ⋯ | 11.97 | 1.75 | 0.43 | ⋯ | 0.26 | 1.22 | |
| G192.12-11.10 | ⋯ | ⋯ | 1.48 | 1.22 | 18.79 | 1.95 | 4.20 | 3.32 | 3.69 | 9.46 | |
| G192.32-11.88N | Class 0 | 1.64 | 12.57 | 2.17 | 45.33 | 8.97 | 11.38 | 2.50 | 1.69 | 4.71 | |
| G192.32-11.88S | ⋯ | 1.38 | 11.04 | 2.05 | 46.87 | 13.17 | 5.88 | 2.10 | 1.43 | 3.97 | |
| G196.92-10.37 | Class 0 | 3.35 | 9.61 | 2.22 | 3.57 | 18.40 | 7.76 | 1.84 | 3.54 | 7.73 | |
| G198.69-09.12N1 | ⋯ | ⋯ | 5.37 | 1.21 | 6.81 | 2.24 | 2.25 | 1.00 | 1.25 | 3.98 | |
| G198.69-09.12N2 | ⋯ | 20.22 | 5.05 | ⋯ | 8.86 | 2.82 | 3.08 | ⋯ | 1.08 | 4.11 | |
| G198.69-09.12S | Class I | 2.42 | 9.44 | 1.53 | 6.57 | 7.17 | 5.79 | 1.66 | 4.03 | 10.68 | |
| G200.34-10.97N | Class 0 | 0.68 | 3.93 | 1.39 | 9.13 | 6.90 | 3.36 | 0.71 | 1.81 | 4.06 | |
| G200.34-10.97S | flat | 1.49 | 3.05 | ⋯ | 13.10 | 6.63 | 1.27 | 0.67 | 1.86 | 4.20 | |
| Orion A | G207.36-19.82N1 | ⋯ | 1.24 | 19.87 | ⋯ | 4.75 | 7.04 | 7.28 | ⋯ | 4.24 | 10.30 |
| G207.36-19.82N2 | ⋯ | 1.10 | 23.84 | 2.08 | 5.01 | 5.34 | 6.99 | 1.98 | 4.69 | 8.85 | |
| G207.36-19.82N3 | ⋯ | 1.02 | 10.44 | 1.49 | 5.99 | 4.79 | 6.77 | 7.26 | 3.00 | 8.19 | |
| G207.36-19.82N4 | ⋯ | 1.09 | 10.84 | 2.06 | 7.47 | 6.52 | 8.31 | 0.38 | 2.29 | 6.52 | |
| G208.68-19.20N1 | Class 0 | 3.15 | 165.17 | 6.15 | 16.44 | 27.30 | 28.75 | 11.56 | 28.40 | 50.17 | |
| G208.68-19.20N2 | ⋯ | 7.20 | 53.55 | 7.08 | 16.74 | 25.87 | 23.22 | 9.03 | 23.57 | 51.76 | |
| G208.68-19.20N3 | ⋯ | 4.81 | 86.57 | 7.83 | 16.44 | 31.09 | 28.40 | 5.56 | 23.99 | 47.32 | |
| G208.68-19.20S | Class I | 4.55 | 64.48 | 5.08 | 16.44 | 18.23 | 26.26 | 1.32 | 12.23 | 24.60 | |
| G209.55-19.68N1 | Class 0 | 1.56 | 28.82 | 1.68 | 14.29 | 7.02 | 9.16 | ⋯ | 10.29 | 14.37 | |
| G209.55-19.68N2 | ⋯ | 1.06 | 8.91 | 0.64 | 15.14 | ⋯ | 3.56 | ⋯ | 1.90 | 4.69 | |
| G209.55-19.68N3 | Class I | 4.08 | 9.12 | 1.50 | 20.38 | 3.91 | 6.22 | ⋯ | 5.39 | 8.74 | |
| G209.55-19.68S1 | Class I | 2.99 | 20.36 | 1.56 | 17.31 | 2.10 | 7.27 | ⋯ | 3.15 | 6.11 | |
| G209.55-19.68S2 | ⋯ | 1.92 | 13.57 | 1.61 | 24.02 | 3.61 | 4.15 | 6.09 | 6.34 | 10.30 | |
| G209.77-19.40E1 | Class I | 1.54 | 6.65 | 0.64 | 21.95 | 11.94 | 3.41 | ⋯ | 6.71 | 10.83 | |
| G209.77-19.40E2 | ⋯ | 1.54 | 6.03 | 0.83 | 18.73 | 11.57 | 5.50 | 0.61 | 6.05 | 10.51 | |
| G209.77-19.40E3 | ⋯ | 1.21 | 8.29 | 0.90 | 15.61 | 14.67 | 4.56 | ⋯ | 4.58 | 9.09 | |
| G209.77-19.40W | ⋯ | 0.37 | 1.17 | 0.24 | 20.55 | 4.45 | 3.25 | ⋯ | 1.75 | 3.98 | |
| G209.77-19.61E | flat | 0.61 | 5.16 | 0.86 | 21.54 | 4.63 | 3.32 | ⋯ | 3.27 | 6.84 | |
| G209.77-19.61W | ⋯ | 1.56 | 9.83 | 0.44 | 16.53 | ⋯ | 3.26 | ⋯ | 1.73 | 4.39 | |
| G209.79-19.80E | Class I | 3.64 | 2.94 | 0.82 | 13.75 | 4.09 | 2.49 | ⋯ | 2.25 | 4.95 | |
| G209.79-19.80W | ⋯ | 3.83 | 10.21 | 2.13 | 12.40 | 5.77 | 7.12 | 2.89 | 7.19 | 10.09 | |
| G209.94-19.52N | ⋯ | 3.67 | 6.87 | 1.61 | 25.04 | 13.43 | 8.94 | 7.24 | 4.73 | 7.28 | |
| G209.94-19.52S1 | ⋯ | 2.24 | 9.33 | 1.70 | 42.64 | 10.97 | 7.24 | 10.73 | 4.14 | 7.54 | |
| G209.94-19.52S2 | flat | 1.46 | 18.15 | 1.27 | 22.69 | 13.30 | 7.49 | ⋯ | 2.08 | 3.77 | |
| G210.49-19.79E1 | flat | 1.23 | 54.09 | 2.44 | 8.74 | 12.86 | 11.42 | 1.26 | 11.67 | 12.92 | |
| G210.49-19.79E2 | Class I | 1.44 | 50.46 | 3.19 | 9.71 | 12.35 | 17.04 | 6.52 | 23.40 | 28.41 | |
| G210.49-19.79W | Class 0 | 2.41 | 26.39 | 2.10 | 8.89 | 13.03 | 10.62 | 0.76 | 20.65 | 24.02 | |
| G210.97-19.33N | flat | ⋯ | 9.13 | 0.44 | 4.19 | 8.78 | 2.64 | ⋯ | 2.61 | 7.86 | |
| G210.97-19.33S2 | Class 0 | 34.28 | 24.74 | 2.18 | 3.85 | 14.12 | 8.40 | ⋯ | 5.59 | 11.02 | |
| G211.16-19.33N1 | Class I | 0.57 | 9.58 | 1.35 | 9.04 | 8.84 | 4.20 | ⋯ | 2.58 | 6.43 | |
| G211.16-19.33N2 | Class 0 | 1.85 | 5.33 | 1.38 | 10.35 | 4.74 | 3.66 | ⋯ | 1.98 | 5.61 | |
| G211.16-19.33N3 | ⋯ | 0.92 | 11.69 | 1.33 | 64.10 | 4.77 | 4.25 | 7.07 | 1.47 | 4.51 | |
| G211.16-19.33N4 | ⋯ | 3.15 | 7.22 | 1.22 | 6.07 | 2.44 | 6.48 | ⋯ | 1.65 | 5.05 | |
| G211.16-19.33N5 | ⋯ | 0.83 | 13.41 | 1.29 | 19.56 | 7.65 | 7.01 | ⋯ | 2.11 | 6.05 | |
| G211.16-19.33S | Class I | ⋯ | 1.42 | 0.44 | 9.01 | ⋯ | 4.54 | ⋯ | 1.29 | 4.72 | |
| G215.44-16.38 | ⋯ | 1.71 | 6.56 | 0.28 | 2.67 | 4.03 | 0.95 | ⋯ | 0.69 | 2.70 | |
| G215.87-17.62N | ⋯ | 3.63 | 7.15 | 0.70 | 3.96 | 2.27 | 2.09 | ⋯ | 3.01 | 5.98 | |
| G215.87-17.62M | ⋯ | ⋯ | 1.30 | 0.70 | 7.22 | 0.85 | 4.21 | ⋯ | 2.29 | 6.61 | |
| G215.87-17.62S | ⋯ | ⋯ | 0.93 | 0.22 | 3.96 | ⋯ | 0.65 | ⋯ | 2.21 | 5.63 | |
| Orion B | G201.52-11.08 | Class 0 | 0.44 | 1.44 | ⋯ | 8.23 | 2.15 | 0.28 | ⋯ | 0.93 | 1.33 |
| G201.72-11.22 | ⋯ | 3.54 | 0.47 | ⋯ | 19.73 | 3.10 | 3.34 | 0.92 | 1.15 | 2.81 | |
| G203.21-11.20E1 | ⋯ | 1.00 | 0.42 | ⋯ | 3.78 | 5.48 | 4.07 | 5.02 | 5.25 | 14.56 | |
| G203.21-11.20E2 | ⋯ | 2.25 | 0.87 | 2.24 | 3.92 | 5.26 | 7.87 | 1.85 | 4.47 | 11.94 | |
| G203.21-11.20W1 | ⋯ | 3.03 | 0.97 | 1.80 | ⋯ | 6.43 | 2.02 | 5.07 | 4.41 | 13.99 | |
| G203.21-11.20W2 | ⋯ | 1.04 | 0.91 | 1.52 | ⋯ | 6.12 | 3.05 | 2.23 | 3.87 | 11.95 | |
| G204.4-11.3A2E | ⋯ | 1.15 | 5.39 | 1.19 | 37.32 | 10.45 | 9.64 | 4.16 | 7.22 | 18.17 | |
| G204.4-11.3A2W | ⋯ | 1.29 | 9.75 | 1.23 | 13.80 | 9.22 | 5.89 | 6.11 | 5.19 | 12.71 | |
| G205.46-14.56N2 | Class I | 1.15 | 46.42 | 2.68 | 6.01 | 16.45 | 18.64 | ⋯ | 9.32 | 22.68 | |
| G205.46-14.56N3 | Class I | 1.56 | 48.24 | 2.43 | 6.24 | 13.03 | 13.97 | 2.28 | 14.16 | 30.84 | |
| G205.46-14.56M1 | Class 0 | 2.39 | 45.03 | 2.42 | 6.47 | 7.89 | 10.60 | ⋯ | 5.44 | 13.93 | |
| G205.46-14.56S1 | Class 0 | 1.21 | 44.46 | 2.46 | 6.72 | 12.65 | 20.45 | ⋯ | 9.74 | 27.21 | |
| G205.46-14.56S2 | flat | 1.54 | 39.49 | 1.65 | 7.82 | 13.08 | 12.02 | ⋯ | 4.28 | 11.41 | |
| G205.46-14.56S3 | Class I | 0.59 | 13.79 | 1.03 | 8.26 | 8.31 | 9.59 | 3.53 | 3.68 | 10.43 | |
| G206.12-15.76 | Class 0 | 0.81 | 1.85 | 0.84 | 11.21 | 4.45 | 7.29 | 1.09 | 5.93 | 14.40 | |
| G206.21-16.17N | ⋯ | 0.59 | 12.70 | 1.52 | 48.36 | 3.92 | 3.30 | 1.27 | 3.27 | 9.02 | |
| G206.21-16.17S | ⋯ | 0.92 | 9.60 | 0.34 | 46.25 | 2.40 | 1.70 | 0.96 | 2.58 | 7.60 | |
| G206.69-16.60N | ⋯ | 1.53 | 1.91 | 0.26 | 109.46 | 3.32 | 1.69 | 1.81 | 0.20 | 5.58 | |
| G206.69-16.60S | ⋯ | 2.24 | 16.85 | 1.71 | 59.12 | 4.88 | 8.08 | 4.22 | 3.25 | 7.57 | |
| G206.93-16.61E1 | ⋯ | 1.69 | 108.33 | 5.24 | 39.85 | 13.04 | 12.75 | 1.27 | 10.09 | 26.10 | |
| G206.93-16.61E2 | Class I | 2.16 | 70.96 | 2.61 | 39.85 | 11.03 | 13.55 | 1.49 | 9.99 | 26.50 | |
| G206.93-16.61W1 | ⋯ | 3.51 | 52.47 | 3.68 | 43.25 | 11.17 | 9.47 | 3.12 | 4.18 | 11.33 | |
| G206.93-16.61W3 | Class 0 | 2.80 | 23.74 | 3.61 | 48.19 | 20.33 | 15.62 | 3.45 | 15.91 | 34.03 | |
| G206.93-16.61W4 | ⋯ | 4.23 | 21.03 | 3.23 | 59.95 | 13.96 | 8.54 | 3.29 | 4.72 | 11.95 | |
| G206.93-16.61W5 | ⋯ | 3.35 | 22.91 | 3.84 | 48.86 | 8.09 | 10.31 | 2.84 | 4.40 | 11.46 | |
| G206.93-16.61W6 | Class 0 | ⋯ | 22.91 | 4.08 | 39.85 | 10.14 | 15.24 | ⋯ | 4.75 | 12.92 |
Notes.
a The 850 μm dust continuum maps were smoothed to calculate the abundance ratios of N2H+, HCO+, H13CO+, HCN, and C2H molecules. b The 850 μm dust continuum maps were smoothed to calculate the abundance ratios of H2CO and HDCO molecules.Only a portion of this table is shown here to demonstrate its form and content. A machine-readable version of the full table is available.
A.1. Optically Thick Case: HCO+ Column Density
To estimate the total column density (Ntot) of a given molecule from its observed line, we use the previously derived equation of Scoville et al. (1986):
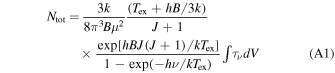
where h, k, ν, B, J, and μ represent Planck's constant, Boltzmann's constant, the frequency of the transition in GHz, the rotational constant, the quantum number for total rotational angular momentum, and the dipole moment, respectively. Tex is the excitation temperature. The total column density of HCO+ is calculated with dust temperatures (Td) from the PGCC catalog. The HCO+ line is optically thick, and therefore Equation (A1) becomes
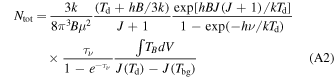
where J(T) and τν
denote an effective source radiation temperature ( ) and optical depth
 ![$(-\mathrm{ln}\left[1-\tfrac{{T}_{B}}{J({T}_{{\rm{d}}})-J({T}_{\mathrm{bg}})}\right])$](https://content.cld.iop.org/journals/0067-0049/254/1/14/revision2/apjsabec4aieqn22.gif) , respectively. Tbg is the background radiation temperature of 2.73 K.
, respectively. Tbg is the background radiation temperature of 2.73 K.
A.2. Optically Thin Cases
H2 CO and HDCO column density. H2CO molecules exist in the ortho or para form, according to the spin configurations of two hydrogen atoms. In this study, we only observed the transitions of ortho-H2CO, and therefore the H2CO column densities should be corrected by multiplying by the ortho to para ratio. The statistical ortho to para ratio of 3:1 (Minh et al. 1995; Guzmán et al. 2013) was adopted. The column density in a lower state (defined as energy level u → l = (J + 1) → J can be obtained from the following equation (Kang et al. 2015):
where Tex, g, Aul , ∫Tmb dv, and V represent the excitation temperature, the statistical weight, the Einstein coefficient in s−1, the integrated line intensity, and the velocity in km s−1, respectively.
The total column density of ortho-H2CO, Northo, is related to the column density, Nl = N(JKa,Kc ) in the lower state JKa,Kc by

where g(JKa,Kc ), E(JKaKc ), and Z are the statistical weight for the ortho-H2CO (3(2J + 1)), the energy of a JKaKc level, and the partition function, respectively. If the molecules follow the Boltzmann distribution of a single Tex, the partition function is expressed as

In the case of HDCO molecules, it is not necessary to correct the ortho-to-para ratio because there is no H-pair. Deuterated species are, in general, 10–100 times less abundant than the main species (Roberts & Millar 2000), and thus HDCO transitions are optically thin. The statistical weight g depends only on the rotational angular momentum as  . The total column density (Ntot) is related to the upper state of column density (N
u
) by
. The total column density (Ntot) is related to the upper state of column density (N
u
) by
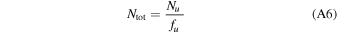
where f u is fractional population of an upper state defined as

where g
u
, E
u
, and Q(Tex) are the degeneracy of the upper state, the energy of the upper state, and the partition function. The partition function can be approximated as  (McDowell 1988). N
u
is the column density in the upper level of the transition (
(McDowell 1988). N
u
is the column density in the upper level of the transition ( ).
).
N2 H+ column density. The column density of the N2H+ molecule was calculated following the equation of Furuya et al. (2006):
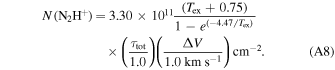
The optical depth τtot and line width ΔV are obtained from the hyperfine structure fitting to the N2H+ lines. Excitation temperature are substituted for dust temperature as described above.
H13 CO+, HCN, and C2 H column densities. Column densities for HCN and C2H molecules were calculated using the equation of Caselli et al. (2002):
where νul
, c, Aul
, gu
, Eu
, Tex, and ∫Tmb
dV are the transition frequency, the speed of light, the Einstein coefficient, the statistical weight, the energy of the upper level, the excitation temperature, and the integrated intensity. Q(Tex) is the partition function ( ).
).
Appendix B: Sources with SiO Thermal Lines and Masers
The SiO thermal line is considered to be the classical tracer of protostellar jets because this emission line is less contaminated by infalling envelopes or swept-up cavities, and traces regions close to protostars (Codella et al. 2013). The SiO thermal lines were detected in the two cores, G191.90-11.21N (G191N) and G192.32-11.88N (G192N), of the λ Orionis cloud. The 22 GHz H2O and 44 GHz Class I CH3OH masers are usually associated with inner jets and outflow lobes, respectively (e.g., Kurtz et al. 2004; Kim et al. 2018). Water masers were detected in three out of 80 cores, whereas a methanol maser was detected only in G205.46-14.56S1, which was one of the water maser-detected cores. Figure 9 presents the observed maser spectra in flux density (Jy) by multiplying by 13.3 Jy K−1 (Kim et al. 2018). We address the overall properties of the five cores and their neighboring cores in the following subsections.
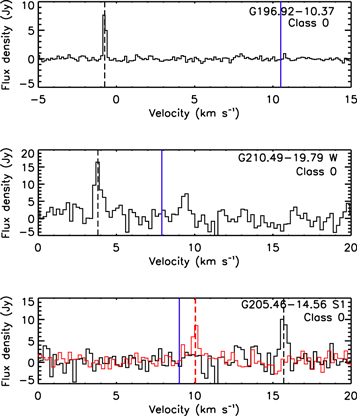
Figure 9. Detected H2O maser spectra. The name and evolutionary stage of a given central object are shown in the upper right corner. The vertical lines indicate the systemic velocity (blue solid line) and the maser peak velocity (black dashed line). For G205.46-14.56S1, the detected 44 GHz methanol maser spectrum is also presented in red and its peak velocity is marked by the red vertical line.
Download figure:
Standard image High-resolution image
B.1. G191.90-11.21N and G192.32-11.88N
The two cores G191N and G192N are of particular interest because they were classified as starless cores in Paper I. In our previous SCUBA-2 survey, the 850 μm dust continuum data revealed very weak emissions from G191N. The IR source associated with G191N was classified as a candidate star-forming galaxy (SFG) due to its low brightness in the 3.36 μm band of the WISE data (Paper I). The associated source is not an SFG, but a YSO, with a low Lbol (0.1 L☉) and Tbol (13 K), and a high mass-to-luminosity ratio (3.4). These values suggest that G191N could still be in the earliest stage of star formation. A more detailed investigation using interferometric observations is required to clarify the origin of the SiO thermal emission. Within a radius of 1', we could not identify any known YSO. The nearest YSO candidate is J053130.03+130016.9, separated 83'' from G191N, which makes it hard to consider it as the driving source of the thermal emission.
Liu et al. (2016) identified G192N as a young Class 0 source, more evolved than the first hydrostatic core. This source was not detected in either the Spitzer/Multiband Imaging Photometer (MIPS) 24 μm band or Infrared Array Camera (IRAC) bands, but it has a large envelope seen in the Spitzer/MIPS 70 μm and Submillimeter Array (SMA) 1.3 mm continuum observations (Liu et al. 2016). The 12CO (2–1) and 13CO (2–1) observations with SMA also revealed a well-collimated outflow. In the AllWISE catalog (Wright et al. 2010), no source was found within a radius of 10'', which implies that G192N is still deeply embedded in its dense envelope. The N2H+ to HCO+ abundance ratio of G192N is higher than that of other protostellar cores in the λ Orionis cloud, indicating that G192N is chemically younger.
B.2. G196.92-10.37
We detected the 22 GHz H2O masers toward the core G196.92-10.37 (G196) in the bright-rimmed cloud (BRC) 18 within the λ Orionis cloud. BRCs are the illuminated parts of molecular clouds usually found at the edge of H ii regions. A number of observational studies have found signposts of triggered star formation in BRCs. YSOs distributed in BRCs exhibit an age gradient, where younger sources are deeply embedded in the BRCs, and older ones are located in their outer regions or in the H ii regions (Lee et al. 2005; Ogura et al. 2007; Fukuda et al. 2013; Lim et al. 2014).
G196 is the only core detected in BRC 18 (Paper I). In Figure 1 of Paper I, G196 was found to be an isolated and compact source in the 850 μm continuum image. This core has the largest mass (5.4 M☉) and averaged column density (1.8 × 1023 cm−2) among the cores in the λ Orionis cloud, and harbors a Class 0 source with Lbol = 14.9 L☉ and Tbol = 68 K (Paper I).
Qin & Wu (2003) conducted 12CO (J = 1) observations toward BRC 18 and found a bipolar outflow near IRAS 05417+0907. The Class 0 YSO and IRAS 05417+0907 are considered to be the same source with an angular separation of 4'', and thus the YSO is regarded as the driving source of the H2O maser.
The luminosity of maser emission was estimated from the integrated flux density in Equations (1) and (2) of Kim et al. (2018). The luminosity of the water maser  is as low as 7.7 × 10⁻⁹
L☉. The low
is as low as 7.7 × 10⁻⁹
L☉. The low  and Tbol on the border of the criteria between Class 0 and Class I (70 K) imply that the maser driving source is entering a Class I evolutionary stage rather than staying in an embedded Class 0 stage.
Except for G196, we could not find any other cores in the vicinity of BRC 18. Thus, this BRC does not exhibit clear evidence that star formation has been triggered, even considering the higher mass and column density of G196. A critical ionizing photon flux, which can indicate the possibility of triggered star formation, can be calculated using ΦCRIT = 6 × 1013 cm−2 s−1 × (MCLOUD/M☉)−3 (Bisbas et al. 2011). When an ionizing photon flux exceeds ΦCRIT, the cloud is dispersed without any star formation being triggered. We measured the ionizing photon flux illuminating BRC 18 using Equation (1) of Morgan et al. (2004) and obtained Φ ∼ 2.3 × 1010 cm−2 s−1. This value is two orders of magnitude higher than ΦCRIT of BRC 18 (3.9 × 108 cm−2 s−1) if we adopt the minimum mass of BRC 18 as 115 M☉ (S. Neha et al., in preparation). These results support the idea that a new generation of stars would be hard to find in BRC 18.
B.3. G210.49-19.79
G210.49-10.79 is located in the Orion A cloud, and is divided into three cores, G210.49-19.79E1, G210.49-19.79E2, and G210.49-19.79W (hereafter G210W). We detected H2O maser emission in G210W. The luminosity  was about 4.43 × 10⁻⁸
L☉ as derived from Equation (1) of Kim et al. (2018). G210W contains two millimeter sources, HH 1-2 MMS 2 and MMS 3 (Chini et al. 1997, 2001), associated with HOPS 168 and 167, respectively. The position of HOPS 168 is consistent with the position of G210W, while HOPS 167 is 40'' away to the southeast of HOPS 168. HOPS 168 was classified as a Class 0 YSO with Lbol = 41.6 L☉ and Tbol = 51 K (Paper I), while HOPS 167 was classified as a flat-spectrum YSO with Lbol = 0.2 L☉ and Tbol = 568 K (Furlan et al. 2016). The former is supposed to be in an active state of mass infall (3 × 10⁻⁵
M☉ yr−1) and accretion (Fischer et al. 2010). Thus, HOPS 168 is probably the youngest and the most luminous YSO in G210.49-19.79, and drives the water maser emission.
was about 4.43 × 10⁻⁸
L☉ as derived from Equation (1) of Kim et al. (2018). G210W contains two millimeter sources, HH 1-2 MMS 2 and MMS 3 (Chini et al. 1997, 2001), associated with HOPS 168 and 167, respectively. The position of HOPS 168 is consistent with the position of G210W, while HOPS 167 is 40'' away to the southeast of HOPS 168. HOPS 168 was classified as a Class 0 YSO with Lbol = 41.6 L☉ and Tbol = 51 K (Paper I), while HOPS 167 was classified as a flat-spectrum YSO with Lbol = 0.2 L☉ and Tbol = 568 K (Furlan et al. 2016). The former is supposed to be in an active state of mass infall (3 × 10⁻⁵
M☉ yr−1) and accretion (Fischer et al. 2010). Thus, HOPS 168 is probably the youngest and the most luminous YSO in G210.49-19.79, and drives the water maser emission.
B.4. G205.46-14.56
G205.46-14.56 (G205.46) is located in the Orion B cloud. This clump shows a filamentary structure in the map of 850 μm dust continuum emission. We identified a total of nine cores in the northern (N1, N2, and N3), middle (M1, M2, and M3), and southern (S1, S2, and S3) parts of this clump (Paper I). Both water (22 GHz) and methanol (44 GHz) masers were detected in the G205.46S1 core for the first time in this work. A CH3OH Class I maser (36, 44, 84, and 95 GHz transitions) is, in general, emitted from the interface between outflows and the surrounding protostellar environment (Plambeck & Wright 1988; Plambeck & Menten 1990; Cyganowski et al. 2009; Voronkov et al. 2014), and therefore this maser emission traces star-forming activities.
In the southern part, G205.46S1 (also known as HH 25) is the brightest core in this field. Its peak intensity is about 1.8 Jy beam−1 at 850 μm dust continuum. The core mass is 11.4 M☉, which is the largest in the Orion B cloud (Paper I). Our observations found the first detection of a water maser toward G205.46S1. In Paper I, we identified one YSO (Class 0) within G205.46S1 using the AllWISE catalog. Furlan et al. (2016) found two YSOs (HOPS 316 and HOPS 358) in this core, separated from each other by 7''. This separation cannot be resolved with the KVN single-dish observations.
HOPS 358 was identified as a PACS bright red source (PBRS) with an observed 70 μm/24 μm color ratio greater than 1.65 (Stutz et al. 2013). A protostellar jet (HH 25) associated with a collimated molecular outflow was found in this field (Gibb & Davis 1998; Gibb et al. 2004), and HOPS 358 is spatially coincident with the position of HH 25. This source is also included in the high-velocity outflow catalog (Wu et al. 2004). HOPS 358 is thus the most probable driving source of the water and methanol masers. The estimated water and methanol maser luminosities are  and
and  , respectively. Lbol of HOPS 358 is 25.0 L☉ (Furlan et al. 2016). The other association (14
 1 away from the peak position of 850 μm continuum, HOPS 316) is classified as a Class 0 YSO (Furlan et al. 2016).
Appendix C: Correlation of H2CO Line with Star-forming Activity
The relationship between H2CO emission and star-forming activity has been suggested in several studies (Bernstein et al. 1995; Bachiller & Pérez Gutiérrez 1997), but an observational signature to ascertain it is still unclear. Here we indirectly suggest a relation between H2CO line widths and star-forming activities.
In our sample of 80 cores, ten cores showed broad H2CO line widths (ΔV > 2.0 km s−1) in the three clouds. In the λ Orionis cloud, three out of the 14 detected cores showed broad line widths (G191N, G192N, and G196). We found three cores (G210W, G209.55-19.68S2, and G211.16-19.33S) having large ΔV in the Orion A cloud and four (G205.46S1, G205.46S2, G206.12-15.76, and G206.93-16.61W3) in the Orion B cloud. Either an SiO emission or water/methanol maser was detected in five out of ten cores (see Appendix B), and therefore the large line widths are likely related to jets/outflows. The mean ΔV of the ten cores is 2.6 km s−1, which is almost three times larger than that of the other 70 cores (0.9 km s−1).
Among the ten cores with broad ΔV, the remaining five cores did not show SiO emission or a water/methanol maser. These five cores are G209.55-19.68S2, G211.16-19.33S, G205.46S2, G206.12-15.76, and G206.93-16.61W3. The former two cores and the latter three cores are located in the Orion A and B clouds, respectively. G209.55-19.68S2 was classified as a starless core in Paper I, and no YSO candidate was found in the HOPS catalog within a radius of 10''. However, Stutz et al. (2013) classified this core as a protostar candidate due to a strong 870 μm detection and the Spitzer/IRAC 24 μm emission, which traces material accreting from the core onto the central protostar. This protostar candidate may be a PBRS with high envelope densities and infall rates given its red spectral energy distribution and high luminosity at submillimeter wavelengths. This deeply embedded source may be attributed to the observed line width, but further observations are required to constrain the broadening source. A Class I YSO (HOPS 130) was identified in G211.16-19.33S (Paper I), but neither outflow nor jet emissions were detected toward this core. Further observations are needed to confirm the origin of line width broadening.
The bipolar outflow driven by HOPS 385 in G205.46S2 has been reported in previous studies (Gibb & Heaton 1993; Wu et al. 2004). G206.12-15.76 incubates a Class 0 YSO (HOPS 400) classified as a PBRS (Stutz et al. 2013). The IRAC image at 4.5 μm reveals an extended emission region around the YSO, which seems to be associated with its outflow. G206.93-16.61W3 contains a Class 0 YSO (HOPS 399) showing a molecular outflow (Sandell et al. 1999). Recently, a collimated outflow on a 0.2 pc scale was found toward the YSO (Tobin et al. 2016). The CO line emission from the strong outflow is highly redshifted up to +40 km s−1 from the systemic velocity of HOPS 399. A multi-epoch survey of 22 GHz H2O and 44 GHz Class I CH3OH maser lines was carried out with the KVN telescope, but no emission was detected in HOPS 399 (Bae et al. 2011). The nondetection of maser emission is consistent with our observational results.
According to the above studies, eight out of ten cores with large ΔV are associated with outflows. We thus propose that the large line widths of H2CO could indicate the presence of jet or molecular outflow in dense cores. The relation between H2CO line widths and star-forming activities needs to be further examined in different star-forming regions.