


Abstract
We present laboratory measurements of the phase functions and degree of linear polarization (DLP) curves of a selection of millimeter-sized cosmic dust analog particles. The set includes particles with similar sizes but diverse internal structure (compact and porous) and absorbing properties. The measured phase functions are found to be in all cases very different from those of micron-sized particles. They show a monotonic decrease with increasing phase angle from the back- to the side-scattering region, reaching a minimum at large phase angles before a steep increase of the forward peak. This is in stark contrast to the phase functions of micron-sized particles, which are rather flat at low and intermediate phase angles. The maximum of the DLP for millimeter-sized compact particles is shifted toward larger phase angles (∼130°) compared to that of micron-sized particles (∼90°). Porosity plays an important role in the measured DLP curves: the maximum significantly decreases for increasing porosity as a result of multiple scattering within the particle. Large porous particles with highly absorbing inclusions can reproduce both the OSIRIS/Rosetta phase functions and ground-based DLP observations of comet 67P/Churyumov–Gerasimenko.
Export citation and abstract BibTeX RIS

Original content from this work may be used under the terms of the Creative Commons Attribution 4.0 licence. Any further distribution of this work must maintain attribution to the author(s) and the title of the work, journal citation and DOI.
1. Introduction
The angular dependence of the brightness and degree of linear polarization (DLP) of stellar light scattered by cosmic dust clouds results primarily from the size, shape, and composition of the dust. Therefore, these physical properties may be retrieved from the analysis of photopolarimetric observations of the light scattered by clouds in different environments, such as circumstellar regions around young and evolved stars (Canovas et al. 2015; Milli et al. 2017; Ren et al. 2019), or planetary (McLean et al. 2017) and cometary atmospheres (Bertini et al. 2017; Rosenbush et al. 2017).
Computational characterization of irregular cosmic dust particles from the observed scattered light remains an extremely difficult task owing to their complicated morphology. Computations usually rely on simplified model particles and are constrained to limited size ranges (see, e.g., Min et al. 2003; Moreno et al. 2007; Merikallio et al. 2015; Pohl et al. 2016; Zubko et al. 2016; Escobar-Cerezo et al. 2017; Kolokolova et al. 2018). Thus, experimental scattering patterns of cosmic dust analogs of representative sizes, shapes, and compositions are a highly valuable alternative for interpreting astronomical observations.
Over the past 10 yr the IAA Cosmic Dust Laboratory (CoDuLab; Muñoz et al. 2010, 2011) has produced an important number of high-quality experimental phase functions and DLPs for clouds of randomly oriented cosmic dust analogs with radii ranging from submicron to up to 100 μm. The data are available in digital form in the Amsterdam–Granada light scattering database (www.iaa.es/scattering; Muñoz et al. 2012). However, the millimeter size range is still poorly studied. Dense clouds of millimeter-sized particles have been inferred in the so-called dust traps in the outer regions of young protoplanetary disks (van der Marel 2013; Casassus et al. 2015; Canovas et al. 2016; Walsh et al. 2016). It is in these regions where the initial phases of planet formation are believed to take place (see, e.g., Pinilla et al. 2012; Testi et al. 2014). The millimeter-sized regime seems to be of particular importance in protoplanetary disks, because it marks the end of the very efficient hit-and-stick regime (Zsom et al. 2010; Lorek et al. 2018).
Dust particles in the millimeter-sized range have also been detected in comet 67P/Churyumov–Gerasimenko (hereafter 67P), target of the European Space Agency Rosetta mission. Some of the instruments on board Rosetta (e.g., GIADA; Della Corte et al. 2014, 2019; Rotundi et al. 2015) indicate that the dominant scatterers in 67P might be significantly larger than initially expected. Based on the findings of the Giotto mission and experimental and ground-based observations of the DLP phase curves, cometary dust was understood to be a mixture of compact and aggregate particles in the micron-sized range (e.g., Moreno et al. 2007; Lasue et al. 2009; Kolokolova & Kimura 2010; Zubko et al. 2013; Muñoz & Hovenier 2015). In contrast, several instruments on board Rosetta indicate that the dominant scatterers in the optical and the near-infrared must be larger. Thus, MIDAS, the Micro-Imaging Dust Analysis System (Riedler et al. 2007), detected only a very small amount of micron-sized particles, much less than initially expected (Mannel et al. 2017). Also, VIRTIS-H (Filacchione et al. 2006) data can be explained with a size distribution of porous particles having a minimum size of 10 μm (Bockelée-Morvan et al. 2017a, 2017b). In addition, VIRTIS measurements of the phase variation of the dust color temperature (Bockelée-Morvan et al. 2019) can also be explained if the dominant particles are larger than 10 μm (Markkanen & Agarwal 2019). Further, pre-perihelion observations of the OSIRIS cameras indicate that dust optical scattering is dominated by 100 μm to millimeter-sized particles (Rotundi et al. 2015, Ott et al. 2017). The interpretation of the phase function measurements with OSIRIS (Bertini et al. 2017) also indicates the dominance of large particles (Markkanen et al. 2018; Moreno et al. 2018; Levasseur-Regourd et al. 2019). Finally, the interpretation of dust coma, tail, and trail images from the ground during several 67P orbits is compatible with size distributions of particles that always exceed 20 μm in size (Moreno et al. 2016, 2017). It should be mentioned that most of the dust mass ejected by comet 67P is in the pebble size range (Fulle et al. 2016; Blum et al. 2017; Ott et al. 2017).
Ground-based observations of the DLP of light scattered by cometary dust particles further constrain the properties of the dust envelope of 67P. Observations of 67P are limited to phase angles smaller than ∼35°. Different observations reported over the past three decades present a DLP curve with a negative polarization branch (NPB) at small phase angles and a maximum DLP (in the observed phase angle range) of ∼8% at a phase angle of 33° obtained after the 2015 perihelion (Myers & Nordsieck 1984; Chernova et al. 1993; Hadamcik et al. 2017; Rosenbush et al. 2017). Those polarimetric observations are consistent with a mixture of compact and aggregate particles in the micron-sized range (see, e.g., Kolokolova et al. 2015; Muñoz & Hovenier 2015). Clearly, conclusions based on the analysis of ground-based observations of the DLP need to be reconciled with the population of cometary particles observed in situ by Rosetta instruments.
CoDuLab was recently modified to measure the angular dependence of the flux scattered (phase function) by millimeter-sized cosmic dust particles in random orientation (Muñoz et al. 2017). Later, the optical train of CoDuLab has been further improved to measure also the DLP curves. In this work we present the experimental phase functions and DLP of a set of millimeter-sized cosmic dust analogs. The measurements are performed at 520 nm, spanning the phase angle range from 10° to 170°. The particles selected have similar sizes (diameter ∼5 mm) but different absorbing properties resulting from their compositions. The samples include a highly absorbing charcoal lump, a moderately absorbing Mg–Fe aluminiosilicate particle, and a low absorbing quartzite particle. Further, we study how porosity affects the measured phase function and DLP curves. In Section 2, we summarize the main concepts of light scattering and the description of the experimental apparatus. The performance of the experimental setup is tested in Section 3. The sample description is provided in Section 4. Measurements and discussion are presented in Sections 5 and 6, respectively. In an attempt to shed some light on the post-Rosetta particle size dilemma, in Section 7 our experimental data are compared to the phase functions obtained by OSIRIS (Bertini et al. 2017) and DLP ground-based observations of 67P (Myers & Nordsieck 1984; Chernova et al. 1993; Hadamcik et al. 2017; Rosenbush et al. 2017).
2. The IAA Cosmic Dust Laboratory: Experimental Procedure
A detailed description of the scattering matrix formalism, experimental apparatus, and data acquisition procedure is provided in Muñoz et al. (2010, 2011). The experimental apparatus has been recently adapted to measure the angular dependence of the flux scattered by single particles with sizes significantly larger than the wavelength of the incident light (Muñoz et al. 2017). In this work, the optical train has been further improved to measure not only the scattered flux but also all elements of the scattering matrix. A schematic overview of the experimental apparatus is presented in Figure 1. Briefly, we use a continuous-wave tunable argon–krypton laser tuned at 520 nm. The laser beam passes through a polarizer (P) and an electro-optic modulator (M). A spatial filter is located after the modulator to avoid spatial intensity variations in the modulated laser beam. In this way we ensure a homogeneous illumination over the entire particle. The homogeneous beam is collimated by a lens, L. We use a diaphragm, D, behind the lens to control the width of the beam so that only the particle of interest is illuminated and not the holder. The homogeneous modulated light beam is scattered by the particle of interest. The particle is located on a 2 mm conical-tip flat black holder mounted on an x − y rotating table. The light scattered by the particle passes through optional optics before being detected by the detector (a photomultiplier tube). The combination of electro-optic modulation of the incident beam with lock-in detection allows determining, per measurement run, three (combinations of) elements,  of the scattering matrix,
  , for a particular orientation, p, of the particle under study. The measurements cover the scattering angle range from 10° to 170°. In general,
  contains 16 nonvanishing elements (see, e.g., Hovenier et al. 2004):

The elements of  are dimensionless and depend on the physical properties of the particle (shape, porosity, size, and refractive index) and the direction of scattering, i.e., the direction from the particle to the detector. The direction of scattering is defined by the scattering angle, θ, the angle between the directions of propagation of the incident and the scattered beams with 0 ≤ θ ≤ π, and an azimuth angle, ϕ, that ranges from 0 to 2π. The scattering angle is related to the phase angle, α, as α = 180° − θ.

Figure 1. Schematic overview of the experimental light scattering apparatus as seen from above.
Download figure:
Standard image High-resolution imageIn the case of a particle in random orientation, all scattering planes are equivalent. Thus, the scattering direction is fully described by the scattering angle θ. Further, for a homogeneous sphere the scattering matrix has only four independent elements that are not equal to zero. In that case  and the scattering matrix, F, takes the form

For unpolarized incident light the first element of the scattering matrix, F11(θ), is proportional to the flux of the scattered light and is called the phase function. The  ratio is, for incident unpolarized light, equal to the DLP.
In this work we only present measurements of F11(θ) and  curves of our cosmic dust analogs. The measurement procedure with particles in random orientation conditions is as follows: The detector is moved along the ring in steps of 1° or 5°, covering the phase angle range from 10° to 170°. For each data point at a given phase angle, 800 measurements are conducted in about 1 s. Thus, one data point is an average of 800 distinct measurements. The error of one data point is the standard deviation of the series of 800 measurements. During the measurements, the particle is located on the rotating conical holder as shown in the right panel of Figure 2. To simulate random orientation, the Fxy(θ) is the result of averaging over 54
  , corresponding to 54 different orientations. First, the particle is located with its longest axis aligned with the holder (Figure 2, (A)). Starting with a given orientation, the
  and
and  are measured after each of 36 successive rotations in steps of 10° around the vertical axis (Z). Second, the position of the particle is rotated 90° toward the direction of the laser beam (Figure 2, (B)). Again, starting from that position, the scattering pattern of the particle is measured in each of 18 successive rotations in steps of 20° around the Z-axis. According to Mischenko & Yurkin (2017), a rigorous 3D orientation average could be obtained by a sufficient number of Euler rotations (Figure 2, left panel): (i) rotation around the vertical axis (δ), (ii) rotation around the x-axis (β), and (iii) rotation around the axis perpendicular to the base of the particle (γ), with δ and γ uniformly distributed, while β ought to follow a distribution proportional to sin(β). Such a procedure would involve a mechanical holder with two degrees of freedom, which would interfere with the intrinsic scattering pattern of the grain much more than the vertical stand we use in our experimental setup. Moreover, the realization of so many measurements would take up an inordinate time of experimental work. Instead, our procedure is a simplified implementation of the rigorous recipe in the particular case of only one value of β = 90°. As β must follow a sin(β) distribution (Mischenko & Yurkin 2017), this is the most convenient single rotation around the laser direction in order to optimize the average. Strictly speaking, a complete 3D random orientation average was not properly calculated, but our experimental procedure is a practical optimal compromise between a rigorous calculation and a feasible experimental practice.

Figure 2. Left panel: laboratory, XYZ, and auxiliary, xyz, reference frames. Right panel: (A) particle in its initial position on the holder; (B) particle after a rotation of β = 90°. Oxyz defines the laboratory reference frame. In both cases each orientation of the particle corresponds to a rotation around Z.
Download figure:
Standard image High-resolution image3. Test Measurements
The performance of the new optical train and holder is tested by comparing the measured phase function,  , and DLP,
  , of a calibration sphere to results of Lorenz–Mie calculations for the corresponding size and refractive index. Physical properties of the N-BK7 glass spheres (Edmund Optics) are presented in Table 1. The size of the calibration sphere has been chosen similar to that of our particles of interest.
Table 1. Properties of the Calibration Spheres and Cosmic Dust Particles
| Composition | Diameter (mm) | m = n+ki (520 nm) | Reference |
|---|---|---|---|
| N-BK7 | 5.0 | n = 1.5168, k = 9 × 10⁻⁹ | Edmund Optics Catalog |
| Charcoal | 4.3a | n = [1.8–2.3], k = [0.5–0.9] | Duley (1984) |
| Quartzite | 3.2a | n = 1.58, k = 2 × 10⁻⁵ | Dorschner et al. (1995) |
| MgFeAlSi | 5.45a | n = [1.6–1.7], k = [0.002–0.03] | Jäger et al. (1994) |
| Cotton | 5.0a | ⋯ |
Note.
aDiameter of the volume-equivalent sphere.Download table as: ASCIITypeset image
In Figure 3, we present the measured and calculated phase functions and DLP curves for the N-BK7 calibration sphere. The measured and calculated  are normalized to 1 at 150°. During the test measurements, the detector is moved along the ring in steps of 1°. The plotted values corresponding to Lorenz–Mie calculations are averaged over ±0
 25 according to the angular resolution of the experimental setup. As shown in Figure 3, the measured phase function and DLP as functions of the phase angle agree with the Lorenz–Mie computations over the entire angle range. Small differences might be caused by small inhomogeneities in the calibration sphere. Moreover, the measurements are strongly dependent on the exact position of the calibration sphere at the center of the measuring ring.

Figure 3. Comparison of measured (gray symbols) and computed (black lines) F11 and −F12/F11 curves for the N-BK7 calibration sphere. All F11 curves are normalized to unity at 150°.
Download figure:
Standard image High-resolution image4. Sample Description
In this work we study three millimeter-sized compact particles consisting of charcoal (vegetable origin), Mg–Fe aluminiosilicate (MgFeAlSi), and quartzite, respectively. Further, we study two highly porous particles consisting of a white cotton ball and a white cotton ball with charcoal submicron inclusions. In Figure 4 we present optical images of the three compact dust particles. The physical properties of all studied particles are summarized in Table 1.

Figure 4. Optical images of (a) charcoal, (b) MgFeAlSi, and (c) quartzite particles.
Download figure:
Standard image High-resolution imageThe charcoal particle has been artificially caved out of a piece of vegetable charcoal. First, the charcoal is cut rough to a flake-like shape. Second, the rough flake is gently sanded to produce macroscopically smooth surfaces with rounded edges (Figure 4(a)). By softening the particle shape, we can focus our study on the effect of absorption on the measured scattering matrix elements. In spite of the sanding process, at microscopic scale we can still distinguish the tubular wall cell structure (Figure 5) that evolves into a porous mosaic texture as we approach the particle edges (Figure 6). Charcoal is a highly absorbing material. Based on literature values (Duley 1984; Papoular et al. 1993; Stagg & Charalampopoulos 1993), we can assume that at visible wavelengths the real part of the refractive index lies between 1.8 and 2.3, while the imaginary part lies in the range of 0.5–0.9.

Figure 5. SEM images of the charcoal particle, central region. White bars denote (a) 500 μm and (b) 100 μm.
Download figure:
Standard image High-resolution image
Figure 6. SEM images of the charcoal particle, border region. White bars denote (a) 500 μm, (b) 100 μm, and (c) 50 μm.
Download figure:
Standard image High-resolution imageThe Mg–Fe aluminiosilicate (MgFeAlSi) particle is a natural stone that presents an ellipsoidal shape with surface roughness (Figure 4(b)). As shown in the scanning electron microscope (SEM) images (Figure 7), surface structures are of the order of a few micrometers. According to the experimental study presented by Mutschke et al. (1998), the UV/VIS/IR spectra of Mg–Fe aluminiosilicate are determined by the iron ions, with no finding of any significant effect on the aluminum content. Based on the data presented by Mutschke et al. (1998) and Jäger et al. (1994), we estimate the refractive index of the MgFeAlSi at 520 nm to be in the range n = [1.6–1.7], k = [0.002–0.03]. Therefore, it can be taken as a good representative example for moderate absorbing particles.
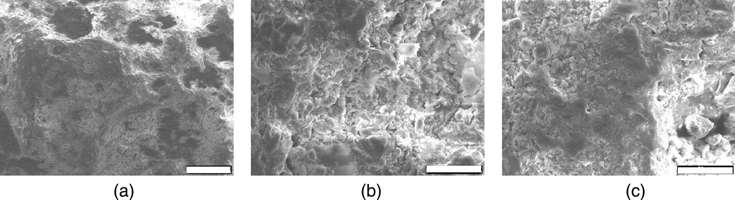
Figure 7. SEM images of the MgFeAlSi grain. White bars denote (a) 500 μm and (b, c) 50 μm.
Download figure:
Standard image High-resolution imageThe quartzite particle shows a rectangular-prism shape with naturally polished surfaces (Figure 4(c)). In Figure 8, we present SEM images for the quartzite particle. At microscopic scale we can hardly distinguish any surface roughness. Quartzite is a low absorbing material with a nearly zero imaginary part of the refractive index at visible wavelengths. As in the case of the charcoal chunk, the lack of surface roughness allows us to focus on the effect of absorption on the measured scattering matrix elements.
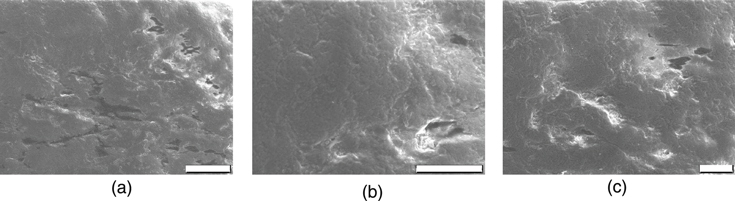
Figure 8. SEM images of the quartzite grain. White bars denote (a) 500 μm and (b, c) 100 μm.
Download figure:
Standard image High-resolution imageThe three particles described above present a compact internal structure. To study the effect of porosity on the measured scattering matrix elements, we also study the scattering pattern of a millimeter-sized cotton ball. Further, to study the effect of absorption on the measured scattering matrix elements, the white cotton ball has been doped with submicron-sized charcoal inclusions. In Figure 9, we present SEM images of the highly porous cotton ball. Keeping in mind that our porous particle cannot be strictly considered as a cosmic dust analog, it is fully relevant and useful to study how porosity may affect the measured scattering matrix elements. Large porous particles seem to be a good optical model for, e.g., the dust orbiting Fomalhaut (Acke et al. 2012). Large particles are needed for reproducing the observed phase function at side- and back-scattering regions in such environments (Min et al. 2010). In addition, they should present a porous structure to explain the far-infrared images.
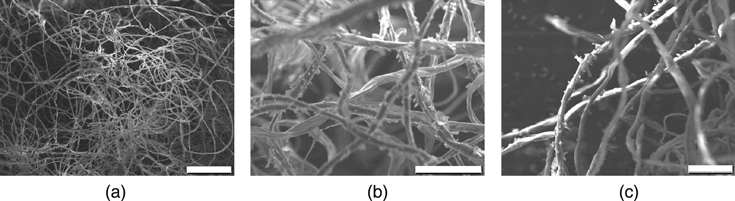
Figure 9. SEM images of the dirty cotton ball grain. White bars denote (a) 500 μm and (b, c) 100 μm. Small particles covering the cotton fibers correspond to the charcoal inclusions.
Download figure:
Standard image High-resolution imageIn summary, we have selected samples corresponding to the two extreme cases as far as internal structure of the particles is concerned, i.e., compact particles (charcoal, Mg–Fe aluminiosilicate, and quartzite) with different absorbing properties and a highly porous particle (cotton ball) with and without submicron-sized charcoal inclusions. In this way we can study not only the effect of absorption but also that of porosity on the measured phase functions and DLP of millimeter-sized particles. All particles present similar sizes to the N-BK7 sphere used to test the experimental apparatus. In this way we ensure a homogeneous illumination over the entire particle.
5. Measurements
In Figure 10 we present the measured phase function, F11(θ), and DLP (−F12(θ)/F11(θ)) curves for the charcoal, Mg–Fe aluminiosilicate, and quartzite particles in random orientation. As explained in Section 2, to simulate random orientation, the plotted F11 and −F12/F11 curves are results of averaging F11p and  over 54 different orientations. In the context of single irregular particle measurements, each orientation would be equivalent to a different particle shape. It is known that any particle shape produces a unique, shape-specific scattering pattern (e.g., Mishchenko et al. 1997), whereas experimental measurements with samples consisting of natural dust particles in random orientation show smooth featureless patterns (e.g., Weiss-Wrana 1983; West et al. 1997, or any of the measurements presented in the Amsterdam–Granada light-scattering database, www.iaa.es/scattering). That is also the case for the measurements presented in this work. As an example, Figure 11 illustrates the effect of rotation on the measured phase function and DLP curves for the charcoal particle. Measured F11p and
  curves corresponding to a set of selected orientations for the charcoal grain are presented together with the averaged values based on the 54 measured orientations. For simplicity, we only show measurements corresponding to six orientations. The F11p and
  curves are presented with their error bars. In cases in which no error bars are shown, they are smaller than the symbol. Figure 11 shows the high dispersion of results for each of the individual orientations.
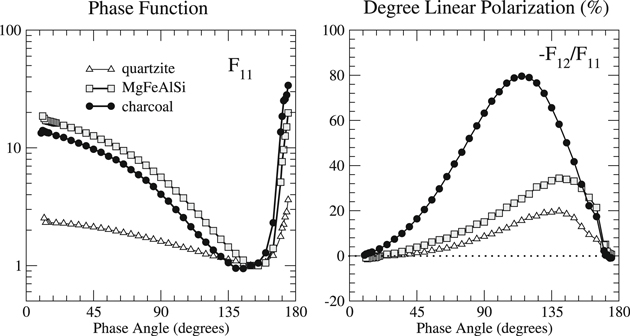
Figure 10. Experimental phase functions (F11(θ)) and DLP (−F12(θ)/F11(θ)) curves at 520 nm for charcoal (filled circles), MgFeAlSi (filled squares), and quartzite (triangles). All F11 curves are normalized to unity at 150°.
Download figure:
Standard image High-resolution image
Figure 11. Measured phase function,  , and DLP curves,
  , for different orientations (p) of the charcoal particle around δ (small filled circles). Small open triangles correspond to different orientations (p) of the charcoal particle around δ after a rotation of the particle on the holder β = 90°. The measured curves are presented with their error bars. In cases in which no error bars are shown, they are smaller than the symbol. Corresponding averaged
  and
and  are represented with thick solid lines. The averaged values are based on all 54 measured orientations. All F11 curves are normalized to unity at 150°.
Download figure:
Standard image High-resolution imageFigure 12 shows the measured  and
and  curves for two millimeter-sized porous balls in a fixed position. From this point the cotton ball doped with charcoal inclusions is referred to as dirty. Both balls present a diameter of approximately 5 mm. The effect of flattening the dirty ball into a ellipsoidal-like shape is presented in Figure 13. In this case, the porous ellipsoidal particle has been placed with its largest projected surface facing the laser beam. From this initial position (δ0) the holder is rotated to δ0 + 10° and δ0 − 10°. The displacement of the minimum of the phase function toward larger phase angles for the cases δ0 + 10° and δ0 − 10° with respect to the δ0 position is remarkable, as discussed in Section 7.
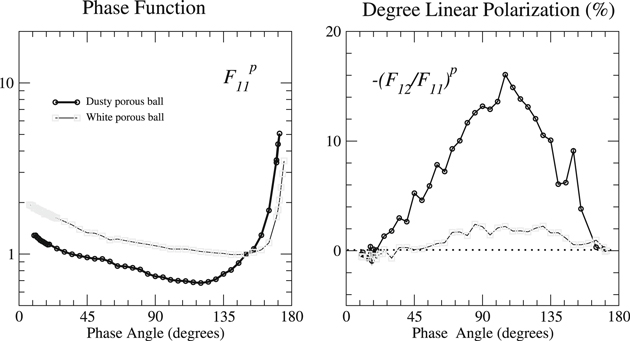
Figure 12. Measured phase function,  , and DLP (in percentage) curves,
  , for white (gray symbols) and dirty (black symbols) highly porous balls in a fixed position. The dirty ball has been doped with submicron charcoal particles. The measured curves are presented with their error bars. In cases in which no error bars are shown, they are smaller than the symbol. The F11 curves are normalized to unity at 150°.
Download figure:
Standard image High-resolution image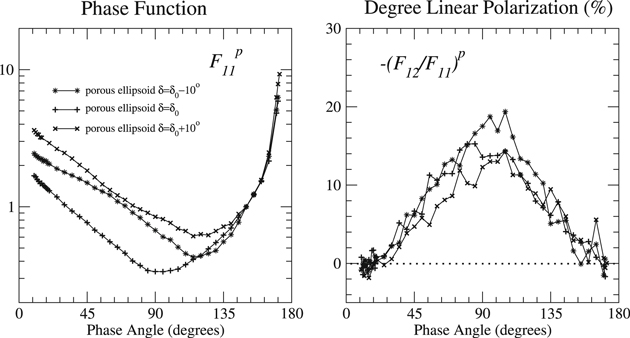
Figure 13. Measured phase function,  , and DLP (in percentage) curves,
  , for a dirty highly porous ellipsoidal particle at three different orientations, p. The measured curves are presented with their error bars. In cases in which no error bars are shown, they are smaller than the symbol. The F11 curves are normalized to unity at 150°.
Download figure:
Standard image High-resolution image6. Discussion
As shown in the left panels of Figures 10 and 12, the measured phase functions of both compact and porous millimeter-sized particles show two well-defined regions: strong forward lobes in the 150° to ∼170° phase angle range and an increase with decreasing phase angle from ∼140°−130° to 10°. For the size of our dust particles and distance to the detector, the angular width of the diffraction peaks is approximately ±08 around the exact forward direction, which is outside the accessible range in our experiment. It is interesting to note that the slope of the phase function in the 150°−10° angle range is larger for the two absorbing millimeter-sized compact particles with soft or moderate surface roughness, i.e., charcoal and MgFeAlSi particles. The behavior of the low absorbing millimeter-sized quartzite particle is similar to that found in Muñoz et al. (2017) for millimeter-sized quartz and enstatite particles with similar refractive indices. However, in Muñoz et al. (2017) the slope of the  of the Etna particle (moderately absorbing) is significantly smaller than those of the charcoal and FeMgAlSi particles. We must note that the Etna particle presents the typical vesicular structure of volcanic particles. Thus, the incident light is multiple scattered on the cratery surface, decreasing the reflected component of the scattered light.
The behavior of the phase function at side- and back-scattering regions is typical of particles significantly larger than the wavelength of the incident light (Muñoz et al. 2017). In contrast, the phase functions of clouds of micron-sized (compact and porous) particles in random orientation present a nearly flat dependence with the phase angle at side- and backward-scattering regions (Muñoz et al. 2012). Illustrative examples are shown in the left panel of Figure 14: Allende and forsterite samples consisting of compact particles (Frattin et al. 2019). The Allende sample corresponds to a ground piece of the Allende meteorite, a carbonaceous chondrite, class CV, type III. Its refractive index at the measured wavelength, 520 nm, is estimated to be of the order of m ≈ 1.7 + i0.02 (Zubko et al. 2015), which is reasonably close to the refractive index of the MgFeAlSi particle (Table 1). The effective radius,  , and variance,
  (as defined by Hansen & Travis 1974), of the samples used by Frattin et al. (2019) are equal to 2.44 and 3.42 μm, respectively. The forsterite sample presents a similar size distribution (reff = 3.06 μm, veff = 1.04) but different absorbing properties. The refractive index of forsterite is m = 1.65 + 0.0005i (Dorschner et al. 1995), i.e., it is a low absorbing material. In both cases the measured phase functions show strong forward peaks, a decrease at side-phase angles showing a nearly flat dependence in the phase angle range from 3° to 90°. Similar characteristics are observed for clouds of randomly oriented micron-sized porous particles (Volten et al. 2007).
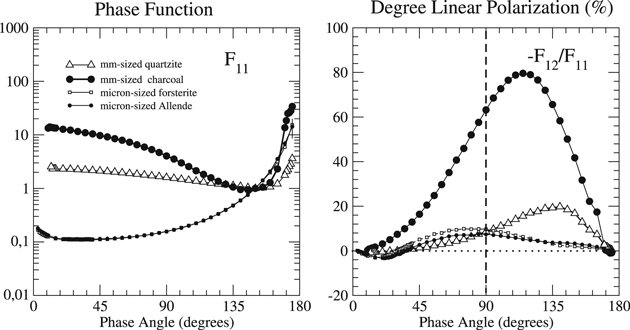
Figure 14. Measured phase functions, F11, and DLP (in percentage) curves for the low absorbing millimeter-sized (quartzite) particles (open triangles), highly absorbing millimeter-sized (charcoal) particles (black circles), and two micron-sized samples, forsterite (small open squares) and the Allende meteorite (small black circles). The measured curves are presented with their error bars. In cases in which no error bars are shown, they are smaller than the symbol. All F11 curves are normalized to unity at 150°. All measurements are performed at 520 nm.
Download figure:
Standard image High-resolution imageIn Figure 15, the measured phase functions of the white and dirty cotton balls are plotted together with the experimental phase functions for two samples consisting of micron-sized fluffy magnesiosilica aggregates. The latter were synthesized in a condensation flow apparatus (CFL) with the purpose of mimicking the formation of circumstellar dust (Volten et al. 2007). The experimental F11(θ) curves for the two samples consisting of micron-sized porous particles show a flat dependence with the phase angle in the backward hemisphere. By contrast, the F11(θ) curves of millimeter-sized porous particles increase with decreasing phase angle in the side- and back-scattering regions. Therefore, brightness observations of the light scattered by cosmic dust clouds covering a broad angle range could be a good diagnostic tool for discriminating the dominant size of the particles populating the cloud.
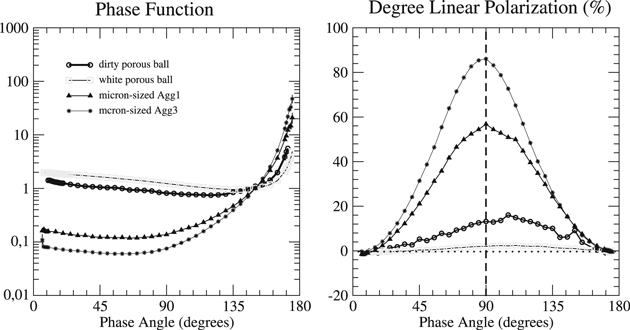
Figure 15. Measured phase functions, F11, and DLP (in percentage) curves for the millimeter-sized white (open gray squares) and dirty (large black squares) cotton balls and dark-brown magnesiosilica (filled small triangles) and light-brown magnesiosilica (small asterisks) fluffy aggregate samples. All F11 curves are normalized to unity at 150°. The measured curves are presented with their error bars. In cases in which no error bars are shown, they are smaller than the symbol. The measurements for the cotton balls and aggregates are performed at 520 and 632.8 nm, respectively.
Download figure:
Standard image High-resolution imageThe measured DLP curves of large compact particles (Figure 10, right panel) show the typical bell shape for irregular particles. The maximum of the DLP curves, DLPmax, is strongly dependent on the value of the imaginary part of the refractive index, showing significantly higher values for the highly absorbing charcoal particle (DLPmax ≃ 80%) than for the low absorbing quartzite particle (DLPmax ≃ 20%). The DLPmax for the moderately absorbing MgFeAlSi particle is located within the range of the quartzite and charcoal measurements. The maxima are placed in the 115°–140° phase angle range, i.e., it is shifted toward larger phase angles than in the case of clouds of micron-sized compact particles (Muñoz & Hovenier 2015). In the right panel of Figure 14, the measured DLP(θ) for millimeter-sized particles is compared to those measured for the two aforemntioned micron-sized cosmic dust analogs (Frattin et al. 2019). In the latter the maximum DLP is located in the 75°–85° phase angle range. The shift of the position of the DLPmax with size for compact particles is consistent with previous computations of the scattering matrix for Gaussian random spheres covering sizes from the Rayleigh to the geometric optic regimes (Liu et al. 2015). Therefore, the position of the DLPmax could also be a good diagnostic tool for discriminating whether the compact dust particles belong to the resonance or geometric optics regimes as far as their sizes are concerned. Significant differences are found in the case of highly porous particles. As shown in Figures 12 and 15, the DLPmax for the large porous particles ranges from 2.4% for the white cotton ball to 16% for the dirty ball. The maximum DLP value is obtained in the 85°–105° phase angle range. Light scattered many times within the porous white cotton ball becomes largely unpolarized (see, e.g., Mishchenko et al. 2006). However, adding highly absorbing submicron charcoal inclusions to the low absorbing porous cotton ball increases the DLPmax up to 16%. The effect of internal inhomogeneities on the scattering behavior of large cosmic dust particles by means of model simulations has been previously studied by Escobar-Cerezo et al. (2017). Computational results presented by those authors also indicate that adding highly absorbing inclusions on a weakly absorbing host particle produces an increase of the DLPmax. In contrast, the light scattered by micron-sized fluffy aggregates consisting of nanometer-sized grains becomes highly polarized with DLPmax as high as 57% and 86%, respectively, labeled as Agg1 and Agg3 in Figure 15. For both samples DLPmax is located at 90°. In those cases, the sizes of the individual nanometer grains forming the aggregates determine the −F12(θ)/F11(θ). In general, the smaller the size of the grains, the higher the maximum of the DLP (see, e.g., West & Smith 1991; Hadamcik et al. 2006).
Another interesting feature is that the DLP curves tend toward negative values near the back-scattering region, i.e., small phase angles. Figure 16 shows the DLP curves of the three compact millimeter-sized particles in the backward hemisphere. The quartzite and MgFeAlSi particles show a shallow NPB at the backward direction. The inversion angle (α0), i.e., the angle at which the DLP changes its sign, seems to be dependent on the composition of the particle. The higher the imaginary part of the refractive index, the smaller the inversion angle. Indeed, the highly absorbing charcoal particle does not show any negative branch at the measured phase angle range, although it seems to tend toward negative values at smaller phase angles. Interestingly, as shown in Figure 11, the DLP for the charcoal particle tends toward negative values at the backward direction for some orientations. That is the case when the charcoal particle is oriented with its shortest axis aligned with the holder, so that the edges of the particle are facing the beam, i.e., the laser beam is illuminating the micron-sized porous mosaic structure (Figure 2, (B)). For comparison, in Figure 16 we also present the experimental DLP for the two cosmic dust analogs consisting of micron-sized particles. The measured NPB for both samples is deeper than for the millimeter-sized particles. A similar shallowing effect was found by Shkuratov et al. (2006) when comparing experimental DLP curves of micron-sized particles in air and of particulate surfaces composed of the same particles. In addition, the tendency of the position of the inversion angle seems to be reversed as compared to the millimeter-sized particles, i.e., the DLP for the Allende meteorite sample becomes negative at larger phase angles than for the low absorbing forsterite sample. In Table 2 we present the measured main parameters of the DLP curves in the region of minimum polarization (DLPmin, αmin), inversion (α0, h), where h is the slope of the positive branch between αmax and α0, and maximum polarization (DLPmax, αmax).

Figure 16. Measured negative polarization branches (in percentage), for the millimeter-sized compact particles and two micron-sized samples.
Download figure:
Standard image High-resolution imageTable 2.
Measured Main Parameters of the DLP(α) Curves in the Region of Minimum Polarization (DLPmin,  ), Inversion (α0, h), where h Is the Slope of the Polarization Curves Computed between αmax and α0, and Maximum Polarization (DLPmax, αmax), Corresponding to the Samples Presented in Figures 14 and 15
| Sample | Size | Color | DLPmin | αmin | α0 | h (%/deg) | DLPmax | αmax | |
|---|---|---|---|---|---|---|---|---|---|
| Compact | Allende | reff = 2.44 μm | dark gray | −3.3% | 22° | 36° | 0.15 | 7.5% | 85° |
| Forsterite | reff = 3.06 μm | white | −3.1% | 15° | 30° | 0.22 | 9.9% | 75° | |
| Charcoal | d = 4.3 mma | black | ⋯ | ⋯ | 10° | 0.76 | 79.6% | 115° | |
| MgFeAlSi | d = 5.45 mma | reddish | −0.9% | 15° | 20° | 0.29 | 34.4% | 140° | |
| Quartzite | d = 3.2 mma | white | −0.8% | 12° | 30° | 0.18 | 19.8% | 140° | |
| Porous | Agg1 | r ≃ 0.65 μmb | dark brown | −1.7% | 7° | 10° | 0.71 | 56.8% | 90° |
| Agg3 | r ≃ 0.65 μmb | light brown | −1.3 % | 7° | 10° | 1.08 | 86.1% | 90° | |
| White ball | d ≃ 5.0 mma | white | −0.6% | 11° | 30° | 0.04 | 2.4% | 85° | |
| Dirty ball | d ≃ 5.0 mma | gray | −0.7% | 14° | 20° | 0.19 | 16.0% | 105° | |
Notes. Italic and boldface types correspond to micron-sized and millimeter-sized samples, respectively.
aDiameter of the volume-equivalent sphere. bAggregate/cluster size.Download table as: ASCIITypeset image
The exact mechanism producing the negative branch of the DLP is still not clear, but it seems to be related to constructive interference of light multiple scattered by particle surfaces in the so-called coherent back-scattering mechanism (CBM; Shkuratov 1989; Muinonen 1990). Due to the lack of surface roughness of the quartzite particle, constructive interaction of fields generated by the internal structure of the particle and refracted back could be responsible for the measured negative branch. In the case of the charcoal particle the refracted component is absorbed within the particle and does not contribute to the polarized light in the backward direction. When the charcoal particle is oriented on the holder with its largest surface parallel to the incident beam, the CBM produced by the porous mosaic surface structure could be responsible for the measured negative branch. For clouds of particles in single scattering conditions, an interference effect of forward- and backward-propagating internal waves within the particles could be responsible for the appearance of an NPB (Muinonen et al. 2015). Recent laboratory measurements indicate that particles smaller than 1 μm are responsible for the NPB of a cloud of poly-disperse micron-sized lunar dust analog particles (Escobar-Cerezo et al. 2018). In that work, it was shown that removing particles smaller than 1 μm from the bulk sample results in the decrease (in absolute values) of the NPB.
7. Comparison with Observations of Comet 67P/Churyumov–Gerasimenko
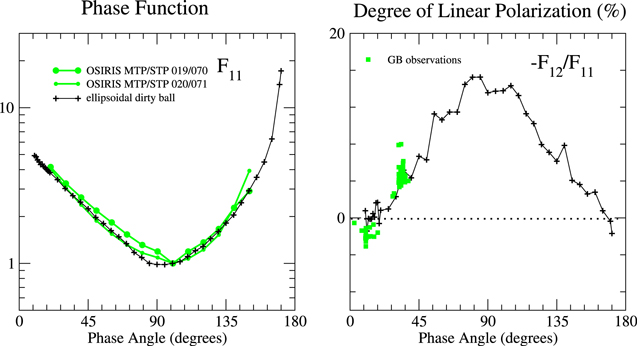
The analysis of the Rosetta data set has exposed challenging contradictions between the properties of cometary dust as retrieved from ground-based and from in situ observations. On the one hand, the OSIRIS camera system on board the Rosetta spacecraft provided unique observations of the intensity of the light scattered by dust within 67P coma (Bertini et al. 2017). The observed phase functions show a peculiar U shape with a minimum at a phase angle around 100°. Similar behavior has been observed at various heliocentric and nucleocentric distances. As shown in Figures 14 and 15, neither compact nor aggregate micron-sized particles reproduce the strong increase of the OSIRIS phase functions with decreasing phase angle in the backward hemisphere. In contrast, the phase functions of the millimeter-sized cosmic dust analogs in random orientation show a strong increase in the backward hemisphere, but the minimum is not located at 100° as is the case for the OSIRIS phase functions. However, we obtain a very good match with the measured phase functions of millimeter-sized particles in a particular fixed orientation, when the largest cross section of the particles is perpendicular to the incident beam, i.e., when an oblate-shaped particle is located on the holder with its largest surface facing the laser beam (Figure 13, case δ = δ0).
On the other hand, ground-based observations of the DLP of 67P show an NPB at small phase angles and a maximum observed DLP of ∼8% at a phase angle of 33° obtained after the 2015 perihelion (Myers & Nordsieck 1984; Chernova et al. 1993; Hadamcik et al. 2017; Rosenbush et al. 2017). As mentioned, the observations are limited to phase angles smaller than ∼35°. This polarization behavior is common to many different comets (see, e.g., the Database of Comet Polarimetry AR-C-COMPIL-5-DB-COMET-POLARIMETRY-V1.0, NASA Planetary Data System; Kiselev et al. 2005). For all observed comets the maximum DLP ranges from 10% to 30% in the phase angle range between 90° and 100°. The right panel of Figure 14 suggests that micron-sized compact particles may dominate the polarization observations of 67P. However, as explained above, micron-sized particles cannot reproduce the U-shaped OSIRIS phase functions.
As shown in Figure 13, large porous oblate-shaped particles with highly absorbing submicron inclusions could reproduce both the U-shaped OSIRIS phase functions and the observed DLP. As shown in Figure 13 (left panel), the position of the minimum of the phase function is dependent on the shape and orientation of the particle. By flattening the dirty cotton ball into a spheroidal-like shape, the slope of the phase function in the backward hemisphere is increased (Figure 13, left panel). Ellipsoidal/spheroidal model particles are also needed to reproduce the motion of the rotating 67P dust particles as inferred from the OSIRIS (Fulle et al. 2015b) and GIADA (Ivanovski et al. 2017a, 2017b) observations. Further, by locating the spheroidal porous particle with its largest projected surface area facing the beam, the minimum is shifted toward smaller phase angles (90°–100°) as is the case for 67P OSIRIS phase functions. In Figure 17 we compare the observed phase functions (left panel) and DLP (right panel) for comet 67P with the measurements for the flattened dirty cotton ball oriented with its maximum projected surface facing the laser beam. This finding is in agreement with the results of a systematic computational study for a broad range of sizes, structure, and aspect ratios (Moreno et al. 2018). In that work, the Rosetta/OSIRIS phase function is reproduced using a model of particle shape distribution with a wide variety of axis ratios of large, absorbing, and moderately porous particles, in fixed orientation with respect to the solar direction. Markkanen et al. (2018) could reproduce the OSIRIS phase function using large aggregates consisting of micron-sized silicate grains with submicron organic inclusions. In the latter the dust particles are assumed to be in random orientation. It is interesting to note that the measured DLP (Figure 13, right panel) is weakly affected by the orientation of the particle.
Figure 17. Green symbols correspond to the OSIRIS phase functions from Bertini et al. (2017) (left panel) and observed DLP for 67P from Rosenbush et al. (2017) and references therein (right panel). The observations are presented together with the measured phase functions and DLP for the flattened dirty cotton ball at a fixed orientation (δ0). All F11 curves are normalized to unity at θ = 100°.
Download figure:
Standard image High-resolution image
8. Summary and Conclusions
We present the experimental phase function and DLP curves for three compact millimeter-sized cosmic dust analogs. The measurements are performed at 520 nm, covering the phase angle (α) range from 10° to 170°. The reliability of the experimental apparatus has been tested by comparing the measured phase function and DLP of a calibration sphere with Lorenz–Mie computations for the corresponding size and refractive index.
All measured phase functions show narrow forward lobes and a monotonic increase with decreasing phase angle at side- and back-scattering regions, which is characteristic of particles much larger than the wavelength of the incident light. The slope of the phase function in the backward hemisphere is larger for the two absorbing particles with smooth surfaces.
The measured DLP curves present a bell shape with a maximum (DLPmax) in the 115°–140° phase angle range, i.e., the position of the DLPmax is shifted toward larger phase angles than in the case of dust particles in the micron size range (DLPmax at α ∼ 75°–85°). Therefore, the position of the DLPmax might be a good indication for the size regime (resonance or geometric optics) of the scattering particles. The DLPmax ranges from 20% for the low absorbing quartzite particle to 80% for the high absorbing charcoal particle.
In addition, we have investigated the effect of porosity on the measured scattering matrix elements by performing measurements with a highly porous white cotton ball similar in size to the cosmic dust analogs. In a second step we have carried out measurements with a white cotton ball doped with submicron charcoal inclusions. The measured phase function for α < 150° shows an increase with decreasing phase angle, in a similar way to the large compact particles. The DLPmax of the porous particles is significantly decreased owing to light multiple scattered within the particle. The DLPmax is increased by adding absorbing inclusions to the porous ball.
According to our measurements, the OSIRIS/Rosetta phase functions and ground-based observations of the DLP of 67P are compatible with large porous low absorbing particles with absorbing submicron inclusions. To reproduce the minimum of the OSIRIS phase functions at α ∼ 100°, the porous particle must have an oblate-like shape and must be located with its largest projected surface area facing the laser beam as suggested by previous computations (Moreno et al. 2018). Nonspherical oblate particles are also required for reproducing the rotational dust frequency as derived from the OSIRIS (Fulle et al. 2015a) and GIADA (Ivanovski et al. 2017a) instruments on board Rosetta. Further, our 67P dust particle experimental model is in agreement with the in situ observations of the COSIMA mass spectrometer on board Rosetta. The dust particles collected by COSIMA consist of large porous nonspherical aggregates (Langevin et al. 2016) composed of 55% in mass of minerals and 45% in mass of organics (Bardyn et al. 2017).
The experimental phase function and DLP curves are freely available in digital form in the Amsterdam–Granada light-scattering database (www.iaa.es/scattering) under request of citation of Muñoz et al. (2012) and this paper.
We are indebted to Rocío Márquez from the Scientific Instrumentation Center of the University of Granada for providing the SEM images. This work has been partially funded by the Spanish Plan Nacional de Astronomía y Astrofísica LEONIDAS project RTI2018-095330-B-100 and the Centro de Excelencia Severo Ochoa Program under grant SEV-2017-0709.