


Abstract
Parker Solar Probe's (PSP's) FIELDS instrument provides a measure of the dust impact rate on the spacecraft with a full-coverage summary of the voltages recorded by the spacecraft's antennas. From consecutively sampled periods throughout PSP's orbit, FIELDS stores the maximum amplitude measured by each active antenna. The occurrence of a dust impact during a given period can be identified by these amplitudes exceeding a few tens of millivolts, and a dust grain's impact location can be approximated using the differential amplitudes between antennas. The impact locations indicated in the data are inspected for compatibility with the incident directions of prograde, retrograde, and β-meteoroid orbits in the ecliptic. Important features in the data are consistent with the incidence of β-meteoroids, but others are better explained by the incidence of grains on prograde or retrograde orbits.
Export citation and abstract BibTeX RIS
1. Introduction
The large-scale distribution of the dust in the inner heliosphere has been investigated via its electromagnetic signatures in scattered radiation and thermal emission. Measurements by the Helios satellites of scattered visible light, mostly from particles in the 10–100 μm size range, found a number density profile n(r) ∼ r−1.3 between 1 and 0.3 au (Giese et al. 1978; Leinert et al. 1981). The experiment's viewing geometry suggests that this result is valid down to 0.1 au, with potentially a slightly steeper increase from 0.3 to 0.1 au. More recently, the navigation cameras on the lunar orbiting Clementine spacecraft were used to measure the zodiacal light from 0.05 to 3.3 au and found a density profile  (Hahn et al. 2002).
The dust particles comprising this distribution have lifetimes one to three orders of magnitude shorter than the age of the solar system due to Poynting–Robertson (PR) drag—their absorption and reemission of solar radiation imparts a retarding force in the frame of the Sun that causes their orbits to spiral inwards and lose eccentricity (Poynting 1904; Robertson 1937; Wyatt & Whipple 1950). For grains with radii less than about 0.1 μm, a pseudo-PR drag force due to bombardment by solar wind particles can even exceed the radiation-induced PR drag force (Mukai & Yamamoto 1982; Minato et al. 2004).
Interplanetary grains are continually sourced by asteroids and comets throughout the solar system (Whipple 1967), with contemporary investigations converging on comets as the primary origin (Hahn et al. 2002; Nesvorný et al. 2010; Yang & Ishiguro 2015; Pokorný & Kuchner 2019). Under steady-state conditions, in which dust spiraling in toward and being destroyed by the Sun is equally replenished from comets and asteroids, flux conservation indicates that the dust density profile goes as n(r) ∼ r−1—a vast simplification, deviations from which indicate the importance of other dust dynamics and processes (Fesenkov 1947; Leinert et al. 1983).
One such process bearing implications for the number density and size distribution of interplanetary dust particles is their collisional destruction, which increases in frequency as particles approach the Sun. Early work considered the collisional and PR lifetimes of grains as functions of their size, concluding that grains larger than around 1 mm would experience a catastrophic collision before migrating to the inner solar system (Dohnanyi 1969). More contemporary investigations have placed the transition at 100 μm (Grün et al. 1985), which is consistent with detections of dust particles incident on Earth (Love & Brownlee 1993) and dynamical models of dust grain orbits constrained by IRAS observations (Nesvorný et al. 2010).
Within a few tens of solar radii from the Sun, dust particles experience the additional destructive force of sublimation. The Solar and Heliospheric Observatory's (SOHO's) observations of peaks in Sun-grazing comets' emissions at 10–12 solar radii and inside 7 solar radii can be attributed to the sublimation and outflow of silicate particles (Kimura et al. 2002). Direct detection of sublimation can also be accomplished via analysis of associated emission lines—Si iii λ and, to a lesser degree, C iii λ were observed originating from a comet at a heliocentric distance of 3.37 solar radii by the Ultraviolet Coronagraph Spectrometer on SOHO, indicating the presence of more silicate than organic material in this region (Ciaravella et al. 2010).
Grains' increasing surface area to mass ratio due to destructive processes like collisions and sublimation increases the relative importance of the radiation pressure force. One consequence of this with an extensive theoretical and observational history is the formation of dust bands. An investigation of the equilibrium temperature of SiO2 particles as a function of heliocentric distance predicted volatilization between 2 and 4 solar radii (Over 1958). This work was later used to hypothesize the existence of a dust ring in this region consisting of continually replenished sublimating SiO2 particles with opposing radial velocities from radiation pressure and PR drag forces (Belton 1966).
Within a few years of this prediction, two independent observations showed heightened thermal emissions at 4 solar radii attributable to the sublimation of dust grains on near-circular orbits (Peterson 1967; MacQueen 1968). Subsequent attempts to detect this possible dust ring have alternately met positive and null results, laying to rest the idea of a permanent dust ring at 4 solar radii, but raising the prospect of a temporal variation in the near-Sun dust environment (Rao et al. 1981; Mizutani et al. 1984; Hodapp et al. 1992; Lamy et al. 1992; Ohgaito et al. 2002). The wavelengths present in these infrared-spectrum measurements indicate the temperatures of the emitting particles, allowing hypotheses about their composition and, in turn, their minimum required size to survive the near-Sun environment (Kaiser 1970). One possibility for the dust ring observations at 4 solar radii is 100 μm-scale silicate particles (Mizutani et al. 1984). Modern analyses of known interplanetary dust materials predict dust rings at a few solar radii or a few tens of solar radii away from the Sun, with number density enhancement factors on the order of 2–4 (Mann et al. 2004; Kobayashi et al. 2011).
Early work on dust ring formation also noted that gradually sublimating dust particles will eventually experience an outward radiation force stronger than the gravitational force, resulting in "β-meteoroids" that leave the solar system on hyperbolic orbits (Belton 1966). A perhaps more effective method of β-meteoroid production is the sudden collisional destruction of a dust particle near the Sun that results in a positive gravitational plus radiative potential energy (Harwit 1963).
The Pioneer 8 and 9 satellites on heliocentric orbits in the ecliptic between Earth and Venus detected more particles moving away from the Sun than moving toward the Sun, indicative of hyperbolic orbits leaving the solar system. This spurred further research into radiation forces on dust particles that laid down much of the theoretical underpinning of the production and dynamical evolution of β-meteoroids (Zook & Berg 1975; Burns et al. 1979). Dust detectors on the Helios 1 satellite orbiting between 0.3 and 1 au also found an imbalance of particles moving toward and away from the Sun, although to a lesser degree (Grün et al. 1980). β-meteoroids were again observed by the dust detector on the heliocentric polar orbiting Ulysses spacecraft, with most modeled as having originated within 0.5 au (Wehry & Mann 1999).
This overview of some of the existing observational and theoretical studies of interplanetary dust is not exhaustive, and in particular omits phenomena more likely to be observed at the solar poles, such as dust grains deflected by the Lorentz force. Parker Solar Probe (PSP) has a near-ecliptic orbit with an eventual perihelion of roughly 10 solar radii, and although the spacecraft does not have a dedicated dust detector, it can use impact signals recorded by its antennas to constrain models of dust in this plane.
2. Detection of Dust Impacts on Spacecraft by Plasma Wave Instruments
The collision of a high-velocity dust particle with a spacecraft generates a small cloud of plasma at the point of impact whose free electrons and ions perturb the spacecraft's immediate electromagnetic environment. These perturbations are recorded by plasma wave instruments as millisecond-timescale spikes in antenna voltage measurements, with amplitudes ranging from a few tens of millivolts to a few volts (Aubier et al. 1983; Gurnett et al. 1983; Meyer-Vernet et al. 1986a, 2017; Oberc & Parzydło 1992; Kellogg et al. 2016; Ye et al. 2016; Mann et al. 2019).
The charge released by impact ionization depends on a grain's mass, m, and impacting speed, v, as Q = αmβvγ with material-dependent parameters α, β, and γ (Dietzel et al. 1973; McBride & McDonnell 1999). The amplitude of an impact waveform gives an idea of Q, but m and v cannot, in turn, be easily extracted. In addition, any threshold voltage that is set for impacts can ignore grains with low masses or slow impacting speeds, thereby making number density estimates inexact. Notwithstanding these observational difficulties, the analytical framework built up around these signals since their discovery more than three decades ago has effectively turned each spacecraft with a plasma wave instrument into a large rudimentary dust detector.
The antennas on Voyager 2 recorded dust impact signals during the spacecraft's crossing of Saturn's equatorial plane close to the planet's G ring, and an audio recording captured during this time sounds like a "hailstorm" (Gurnett et al. 1983). A similar instrument on Cassini also observed these waveforms in the vicinity of Saturn and was able to identify its moon Enceladus as the likely source of dust particles in the planet's E ring (Kurth et al. 2006). Impact signals were again observed by Voyager 2 during equatorial crossings near Uranus and Neptune, and continued to be observed with less frequency in the outer solar system (Gurnett et al. 1987, 1991, 1997).
Once again, these waveforms were captured by STEREO in heliocentric orbit at 1 au and have been correlated with white-light images by the spacecraft showing debris likely kicked off from the impacts (Cyr et al. 2009). A statistical analysis of the impacts on STEREO was able to show a cyclical variation in the dust impact rate attributable to the movement of the spacecraft with respect to the flow of interstellar dust grains (Zaslavsky et al. 2012). This variation allowed for the isolation of the interstellar component of the observed micron-scale flux, yielding an estimate compatible with those from dedicated dust detectors on Ulysses and Cassini (Zaslavsky et al. 2012).
Analysis of the impact signals on the Wind spacecraft in solar orbit at 1 au yielded the first plasma wave instrument determination of dust directionality (Malaspina et al. 2014; Kellogg et al. 2016). A yearly modulating trend in the relative magnitudes of the impact signals on the various spacecraft antennas was linked to the variation in the incident direction of interstellar dust flow, with the antennas closest to the expected impact locations measuring a greater positive signal (Malaspina et al. 2014).
Dust signals in the Cassini plasma wave instrument data, despite the spacecraft's complicated geometry and substantially different antenna arrangement compared to that of Wind, also showed the potential for approximate impact localization from antenna measurements. When the instrument was in dipole mode, recording the difference between two of its antennas, E1 − E2, the ratio of the projected areas of these antennas, (Area1/Area2), closely aligned with the ratio of the positive signal rate to the negative signal rate (Ye et al. 2016). This supports the previous finding that dust impacts produce larger positive signals on the antennas they strike closer to, although it is stricter in interpreting impact signals as only occurring due to direct impacts on the antenna elements.
3. Dust Impacts in the FIELDS Data
Impact waveforms are captured in the PSP FIELDS data by the Time Domain Sampler (TDS) and Digital Fields Board (DFB); examples are shown in Figure 1. The TDS has a frequency response that is flat from roughly 10 kHz to 1 MHz, but drops rapidly at frequencies below and above this range (Bale et al. 2016). Dust impact signals are dominated by frequencies below 10 kHz, casting doubt on the physical accuracy of the TDS waveforms. The DFB waveforms shown have a frequency coverage down to roughly 100 Hz, suggesting that they have greater fidelity to the true impact plasma–spacecraft interaction (Malaspina et al. 2016). Correction of the TDS waveforms for the TDS's frequency response yields waveforms (not shown in Figure 1) that closely match those of the DFB, corroborating this suspicion.
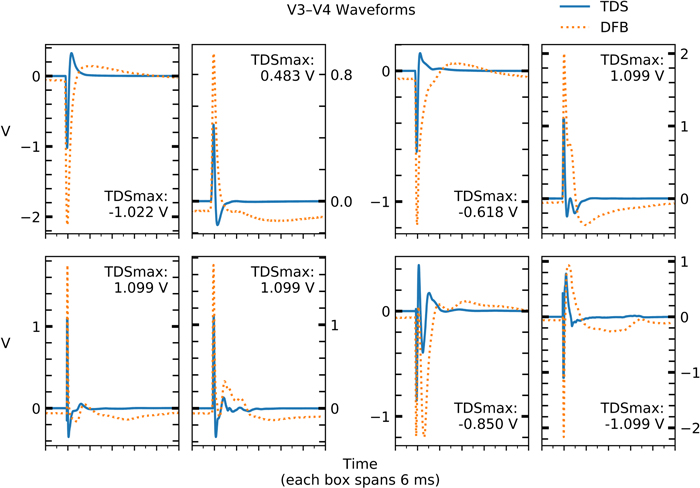
Figure 1. Synchronized signals of dust impacts on PSP across three FIELDS data products—TDSmax, TDS Waveform, and DFB Burst. TDSmax simply records the largest absolute value in the TDS waveforms, but its continuous coverage of PSP's orbit allows for a statistical analysis not possible with the selectively telemetered waveforms. Dominance of the dust impact waveforms below 10 kHz, in the DFB's regime of validity, suggests a greater fidelity of the DFB waveforms to the physical plasma recollection process. In addition, the TDS saturates at about ±1 V, truncating a significant portion of the impact events, while the DFB saturates at ±6 V, spanning all impact events observed so far. Of the signals marked as dust impacts in the TDSmax data, about 55% are clean waveforms like those in the top left, 28% are slightly distorted like those in the top right, 10% are still more distorted like those in the bottom left, 5% are as distorted as those in the bottom right, and 1% are not dust induced.
Download figure:
Standard image High-resolution imageBecause the DFB and TDS waveforms are selectively telemetered from the spacecraft to ground, they cannot be easily used for a statistical study. For this, a summary data product from the TDS, hereafter referred to as TDSmax, is suitable. In consecutively sampled periods of roughly one minute duration outside of encounter (PSP heliocentric distance >0.25 au) and 1/10th of a minute during encounter, the TDS records the maximum deviation from ground measured on each antenna. The occurrence of a dust impact during a given sampling period can be identified by the measured antenna amplitudes exceeding a few tens of millivolts.
The analysis in this paper addresses dust impacts that occurred during orbit 2 from 0.52 au preperihelion to 0.52 au postperihelion. Of the roughly 904 hr spanned by this section of the orbit, the TDSmax data product covers 748 hr, or 82%, from the antennas V1 – V2, V3 – V4, V2, and V5, and 0 hr from the antennas V1, V3, and V4. The locations of these antennas can be seen in Figure 2. Of these 748 hr, a further 93 hr of observation time were discarded due to system operations flags indicating that the spacecraft was thrusting, the traveling-wave tube amplifier was active, the FIELDS instrument was rebooting, or the TDS was undergoing a configuration transition.

Figure 2. Left: a schematic of the FIELDS instrument on PSP. The components used in this study are the 2 m long antennas V1–V4 mounted on the heat shield and the short V5 antenna mounted on the boom. Of primary utility in the localization of impacts on the spacecraft are the differences between collinear antennas: (V2 – V1) and (V3 – V4). These pseudo-dipoles are almost orthogonal to each other and span from the ram to the antiram side of the spacecraft. Figure from Malaspina et al. (2016). Right: the top panel shows the definition of a roll angle of PSP. Although PSP's (–Y) body vector points toward ecliptic north during encounter, outside of encounter, it frequently points toward ecliptic south, as seen in panel 2 of Figure 7. The bottom panel shows the definition of an angle of incidence onto PSP in the plane of the ecliptic. It is measured from the Sun-pointing body Z-axis and, regardless of the roll position of the spacecraft, is positive as it rotates in the direction of the spacecraft's movement (ram).
Download figure:
Standard image High-resolution imageThe set of impacts that this paper addresses is further limited to those that produced a signal in the TDS data with absolute magnitude exceeding 50 mV on the V3 – V4 or V2 – V1 antennas. This approach omits a set of low impact response events in the 20–50 mV range as well as a set of events only evident in other antennas, but has the benefit of excluding high-amplitude plasma waves. There are 14,113 events in the orbit 2 TDSmax V3 – V4 data satisfying these criteria. There are 880 V3 – V4 waveforms that can be matched to these TDSmax events, allowing for a visual inspection to gauge the selection criteria's appropriateness. This inspection reveals only two Langmuir waves and six other waveforms not consistent with dust impacts, suggesting about a 1% rate of misattribution of the TDSmax events. Figure 1 shows representative samples of candidate dust impact waveforms, which have forms similar to signals from prior plasma wave instruments positively identified as dust hits.
The distribution of the TDSmax peak events in time provides further evidence that they warrant attribution to dust. They should follow a Poisson process, meaning that if they occur at a rate λ, the waiting time between them follows an exponential distribution with parameter λ. PSP's exposure to dust and therefore λ vary throughout the spacecraft's orbit, but over time intervals in which this variation is small, impacts approximately occur as a Poisson process with constant rate.
Figure 3 shows the results of fitting the waiting time distributions from different heliocentric distances throughout orbit 2 to exponential distributions. The close agreement of the fitted λ with the hit rates suggests that the spikes do in fact follow a Poisson process. The proximity of the R2 fit coefficients to 1 for most heliocentric distances corroborates this. The low R2 coefficients for some points after 0.27 au postperihelion arise from there being only a small amount of observation time from those heliocentric distances. The poor fits around 0.27 au preperihelion arise due to the high hit rate, 1/3 per minute, while the instrument's sampling period is still at 1 minute instead of the encounter value of 1/10 minute. During this time, the chance of two spikes occurring in one sampling period, which would register only one spike in the data, is roughly 4% assuming Poisson statistics. Perhaps more importantly for the fit of λ, the increased hit rate results in an increased number of waiting times that span only a few sampling periods. Calculations of these waiting times incur a substantial fractional error because of uncertainty in when exactly the hits occurred. The imperfect approach that was used was to model each hit as having occurred at a random location within its known period, with each location equally likely.

Figure 3. Left: the distribution at 0.18 au preperihelion of waiting times between spikes over 50 mV on the V3 – V4 antenna. Right: the top panel shows, in blue, the naturally defined rate of (number of spikes)/(observation time) for each heliocentric distance; and in purple, the result of fitting each heliocentric distance's waiting times to an exponential distribution with parameter λ. The bottom panel shows the R2 coefficients resulting from these fits.
Download figure:
Standard image High-resolution imageIt is not guaranteed that the directionality indicator valid on Wind will also be valid on PSP, whose traversal through the plasma environment close to the Sun may result in previously unobserved spacecraft charging behavior (Ergun et al. 2010). It is also unclear whether, for two antenna amplitudes, V2 – V1 or ∣V2∣ – ∣V1∣ is a better indicator of impact location. For signals that are negative on both V1 and V2, a rigid application of the finding from Wind and Cassini—impacts produce a more positive signal on the antennas they strike closer to—results in a potentially faulty interpretation that the impacting grains struck closer to the antennas with lower absolute signals. Of the dust impacts identified in this study on the antenna V2 – V1 interior to 0.52 au, 11% were negative on both V1 and V2.
However, using ∣V2∣ – ∣V1∣ can ignore hits with opposite signs on V1 and V2, which is undesirable for an analysis that depends on differential responses among antennas. Of all identified hits, 35% are of this mixed polarity type, 28% of which (10% of all hits) are discounted by ∣V2∣ – ∣V1∣. This paper proceeds by primarily analyzing V3 – V4 and V2 – V1, but presents ∣V2∣ – ∣V1∣ for comparison.
4. Dipole and Monopole Plasma Wave Instrument Antennas
The relative abilities of monopole and dipole antennas to detect dust impacts have been examined using observations from many spacecraft, including Voyager (Oberc 1994; Meyer-Vernet et al. 1996), Cassini (Ye et al. 2016, 2019; Nouzák et al. 2018), International Cometary Explorer (ICE; Campins et al. 1986; Gurnett et al. 1986; Meyer-Vernet et al. 1986b; Oberc 1996), Wind (Meyer-Vernet et al. 2014; Kellogg et al. 2016; Malaspina & Wilson 2016), STEREO (Meyer-Vernet et al. 2009; Collette et al. 2015), and the Magnetospheric Multiscale (MMS) probes (Vaverka et al. 2019). These studies commonly found that monopole antennas are more sensitive to impacts than dipole antennas.
The explanation of this result decomposes the observed signals into separate contributions from plasma to spacecraft body coupling and direct plasma to antenna coupling. Body coupling is stronger for impacts that occur far from individual antennas, which induce a body potential perturbation that is measured approximately equally by all antennas. When these monopole signals are differenced in dipole mode, they cancel, resulting in low detection efficiency. Direct antenna coupling is thought to dominate for the less probable impacts on or near antenna elements, which induce a nonuniform response among antennas that allows for detection in dipole and monopole modes.
On PSP, antennas in dipole mode and monopole mode have comparable sensitivities to impacts. In the data window considered, there are 11,843 voltage waveforms on the monopole V2 satisfying ∣V2∣ > 50 mV. Of these, 85% meet the same threshold in the dipole V2 – V1 channel, ∣V2 – V1∣ > 50 mV. This result spans an order of magnitude of thresholds—85% of events for which ∣V2∣ > 20 mV also satisfy ∣V2 – V1∣ > 20 mV, and 82% of events for which ∣V2∣ > 200 mV also satisfy ∣V2 – V1∣ > 200 mV.
This similarity of the monopole and dipole antenna detection rates on PSP may possibly arise from an atypically low sensitivity of the monopoles to body impacts, in which case most of the observed hits occurred on or near antenna elements. However, this is unlikely considering that there are conducting surfaces that span PSP's length, allowing for the transmission of signals from impact locations to the antennas. Evidence for such transmission comes from the V5 antenna on the rear of the boom—84% of impact waveforms for which ∣V5∣ > 50 mV also induce ∣V2∣ > 50 mV.
Alternatively, the similarity of the monopole and dipole mode detection efficiencies could be caused by an atypically high sensitivity of PSP's dipoles to body impacts. In this case, the observed hits occurred on the broader spacecraft as opposed to only near antenna elements, but produced sufficiently divergent responses on the antennas for detection in dipole mode.
A comparison of PSP's antenna geometry to that of previous spacecraft supports this interpretation. PSP's 2 m long whip antennas extend from bases on the corners of the heat shield separated by about 1.6 m, as shown in Figure 2 (Bale et al. 2016). In contrast, the antennas of Cassini and Voyager are on the order of 10 m long and extend from a common point on those spacecraft's bodies (Jaffe & Herrell 1997; Scarf & Gurnett 1977). The base separation and attendant physical barriers between PSP's antennas would tend to improve the detection of nonuniform charge dynamics across the spacecraft. This capability is further served by the comparative shortness of PSP's antennas, which results in their greater fractional exposure to the impact-induced plasma cloud. Impact signals no longer show a potential perturbation of the same point on the spacecraft for each antenna, but instead show local conditions in various regions of the spacecraft. This idea is developed further in an investigation of dust impacts on STEREO that only perturbed a single antenna (Meyer-Vernet et al. 2009), as well as a laboratory simulation (Collette et al. 2015).
The antennas of the MMS spacecraft consist of 8 cm diameter spheres mounted on the ends of 57 m booms and 2 m long tubes mounted on the ends of 13 m booms (Ergun et al. 2016; Lindqvist et al. 2016). Debye shielding between the spacecraft body and these isolated probes would act to suppress direct measurements of body impact plasma clouds, resulting in the dominance of the body potential perturbation in impact signals. If this body perturbation is sufficiently uniform across the spacecraft, the monopole probe signals cancel, resulting in nondetection in dipole mode.
A similar hypothesis applies to the comparatively low impact detection efficiencies of the dipoles on Wind and ICE. Both of these spacecraft are cylindrically shaped with whip antennas directed radially outward. As dipoles, these antennas span on the order of 100 m tip to tip, and so experience a small fractional exposure of their lengths to impact plasma clouds (Ogilvie et al. 1978; Bougeret et al. 1995). As a result, body potential perturbations likely dominate most impact signals on these spacecraft, resulting in reduced detection sensitivity of dipole measurements.
5. Dust Flux Measured by FIELDS
Figure 4 shows the per-time rates of the impact events identified in the V3 – V4 data. The sharp crossing of the positive and negative impact rates at 0.26 au postperihelion, the green dashed–dotted vertical line, indicates that impact signal polarities on PSP are sensitive to impact location, as was the case for Wind and Cassini. At this time, the spacecraft rotates 180° about its Sun-pointing Z-axis in roughly 1 minute, shifting the relative exposures of the V3 and V4 sides of the spacecraft for any dust flow in the ecliptic that is not directly incident on the heat shield or the boom.

Figure 4. Hit rate on the antenna V3 – V4 indicated by TDSmax during orbit 2. Each point represents the hit rate from the surrounding ±4 hr, and the error bars are simply Poisson errors. The green dotted line marks perihelion, and the green dashed–dotted line marks a roll of the spacecraft by 180° about its Sun-pointing Z-axis.
Download figure:
Standard image High-resolution imageDust impacts that are negative on V3 – V4 are more positive on the V4 antenna than the V3 antenna, which by previous directionality analyses indicates an impact location closer to V4. Correspondingly, dust impacts that are positive on V3 – V4 indicate an impact location closer to the V3 antenna. Throughout perihelion, a predominance of impacts on the ram/V4 side of the spacecraft is observed. PSP's prograde motion through the ecliptic is expected to result in this impact geometry for most populations at perihelion, so this trend is consistent with previous directionality analyses, but nonspecific to a single grain population.
Further investigation of the directionality information conveyed requires a metric for the V3 and V4 antenna exposures for given incident directions. This paper uses the projected areas of the V3 and V4 sides of the spacecraft. For a given φinc and ϕroll, these areas were calculated using the open-source 3D computer graphics program Blender and a CAD of PSP provided by NASA.12 Figure 5 shows views of PSP from a sample of incident directions in the ecliptic, with the division between the V3 and V4 sides of the spacecraft indicated.
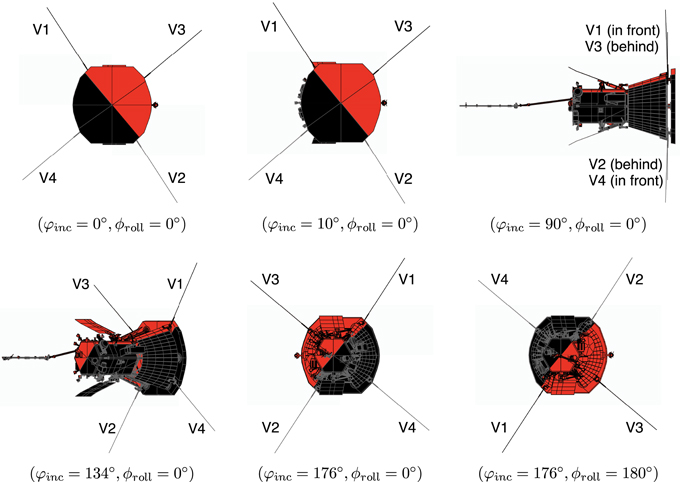
Figure 5. Examples of the diagrams of PSP from which the projected areas are calculated. The V3 side of the spacecraft is in red and the V4 side is in black. These are orthographic views, distinct from perspective views in that they do not foreshorten the parts of PSP that are farther away from the viewing location. The result is that the areas shown are the same sizes as the shadows that would be cast by shining a plane of light from the viewing location at PSP. φinc = 176°,  shows the effect of the body roll at 0.26 au postperihelion for grains on prograde circular orbits.
Download figure:
Standard image High-resolution imageViews like these were rendered for the  of grains on circular prograde and retrograde orbits, as well as β-meteoroids with β = 0.7. The values of φinc for prograde circular orbits are illustrated in Figure 6, and the results of the projected area calculations for these grains are shown in panel 4 of Figure 7. The alignment of some of the trends in these V3 and V4 projected areas with the positive and negative V3 – V4 hit rate trends in Figure 4 motivates a normalization of the rates by the relative speed between PSP and prograde grains. These speeds are presented in panel 3 of Figure 7, and together with the capture area of the spacecraft, determine the "sampling volume" that PSP carves out per unit time. The resulting per-distance hit rate, shown in panel 5 of Figure 7, depends on the impacting grains' spatial density and incident direction. The incident direction determines the capture area of the spacecraft and other variables such as the material and local geometry of the primarily impacted location.
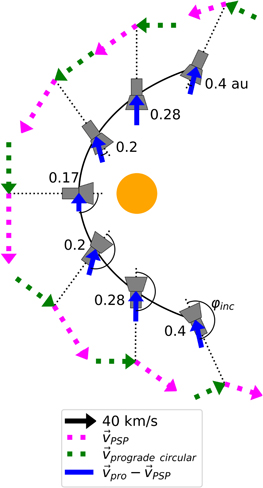
Figure 6. Impact geometry of grains on prograde circular Keplerian orbits during PSP's second orbit. Connected by a dotted black line to each orbital position are vectors indicating the local velocities of PSP and this grain population. The difference of these gives the incident velocity of the grains on PSP, shown in blue. The arcs show the value of  , defined in Figure 2. Adapted from Szalay et al. (2020).
Download figure:
Standard image High-resolution image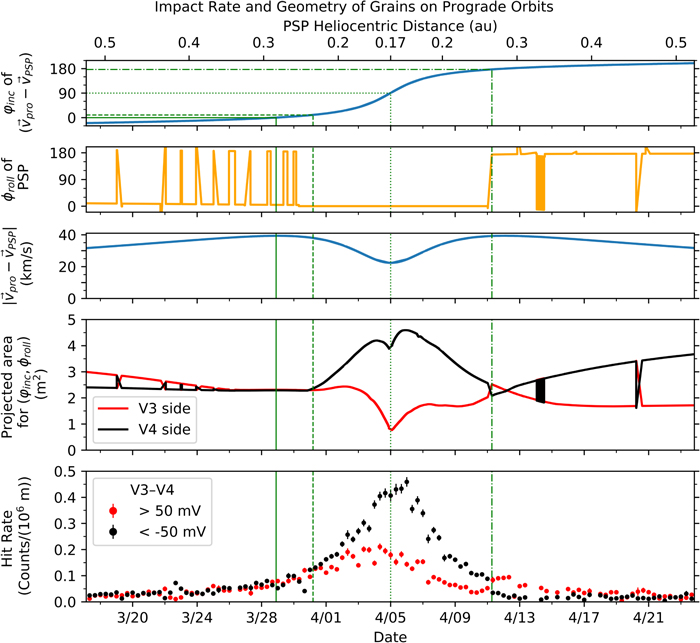
Figure 7. Panel 1: the incident angle of prograde circular Keplerian orbits using the definition in Figure 2. These angles are illustrated in Figure 6. Panel 2: the value of PSP's body roll angle also defined in Figure 2. The maneuvers affecting ϕroll are performed by guidance and control systems for communications purposes, and result in intermittent rotations by 180° outside of 0.25 au. To avoid clutter, panel 2 only shows the intervals of  that overlapped with TDSmax's recording periods. Panel 3: the speed of impacting grains on prograde circular orbits relative to PSP. This speed affects the "sampling volume" carved out by PSP per unit time. Panel 4: the projected areas of the V3 and V4 sides of the spacecraft for φinc and ϕroll. Panel 5: Figure 4 normalized by
  to yield a hit rate that depends on the spatial density and incident direction of dust grains.
Download figure:
Standard image High-resolution imageLaboratory tests showed that plasma charge production from high-speed impacts on the STEREO satellite varied by as much as a factor of 5 depending on the material struck (Collette et al. 2014). The same study found a maximum in impact charge generation when impactors struck at 45° incidence, an unexpected result that points to unpredictability in the spacecraft's response to a given impact. Normalization by the projected areas is not performed in Figure 7 because it is clear that, although they quantify some of the dependence of dust detection on impact geometry, they are an incomplete gauge and other factors play a prominent role.
Excepting these observational difficulties, the summed positive and negative hit rates normalized by the total PSP projected area give an idea of the dust number density. Its radial profile does not agree with the  result from Helios, but that measurement was sensitive to particles in the 10–100 μm size range (Giese et al. 1978; Leinert et al. 1981), while detection via impact ionization is sensitive to particles with sizes down to the micron and submicron range (Zaslavsky et al. 2012; Malaspina et al. 2015). A parallel study shows n(r) ∼ r−2 gives an adequate fit to the fluxes for grains on circular prograde orbits, but a better fit is achieved with a model of β-meteoroids streaming away from the Sun after having experienced a catastrophic collision at 5 solar radii (Szalay et al. 2020). In particular, this β-meteoroid model accounts for an observed asymmetry between the pre- and postperihelion fluxes.
6. Compatibility with Grains on Prograde Circular Orbits
Some directionality indicators in the data are consistent with the incidence of prograde circular orbits. Between the solid green vertical line (heliocentric distance 0.28 au, φinc = 0°) and dashed vertical line (heliocentric distance 0.23 au, φinc = 10°) in Figure 7, circular prograde orbits are incident only on PSP's heat shield, resulting in equal exposures of the V3 and V4 sides of the spacecraft, as depicted in Figure 5. This is reflected in the hit rates by the lack of a predominant hit polarity. The spacecraft rolls that occur during this period do not produce the systematic impact rate polarity reversal observed at 0.26 au postperihelion because they do not alter the relative exposures of the V3 and V4 sides.
At 0.23 au preperihelion, the incident direction has rotated sufficiently to expose the V4 side bus (see Figure 5, φinc = 10°), resulting in a divergence in the projected areas that is reflected in the positive and negative hit rates. Until perihelion (green dotted vertical line), the ratio of the negative impact rate to the positive impact rate increases as does the ratio of the V4 side to the V3 side projected area. At perihelion, the dip in the V4 side projected area is weakly reflected in a corresponding dip in negative impact rate, whose deficiency can possibly be explained by presumed dust density increase. However, the more prominent dip in the V3 side projected area is not reflected in the positive impact rate, suggesting too simplistic a model of the spacecraft's impact response or the presence of another grain population. Lastly, from roughly April 10th to April 11th, both the positive impact rate and the V3 side projected area slowly increase as the incident vector of prograde grains rotates through the rear of the spacecraft.
Panels 1 and 2 of Figure 8 present the analogous results for the V2 – V1 antenna. The V1 and V2 side projected areas are not as divergent as those of the V3 and V4 sides (see Figure 9), reflected in the V2 – V1 antenna impact signals by smaller divergence of the positive and negative hit rates. Nevertheless, the expected signal of grains starting to hit the bus at the vertical dashed green line (φinc = 10°) is notably weaker for this antenna than for V3 – V4. The other specific signal of prograde circular orbits, a dip in the negative hit rate at perihelion, is stronger in the V2 – V1 antenna than in the V3 – V4 antenna, but the flat positive hit rate through this region again indicates an incomplete picture of the impact geometry or antenna response.

Figure 8. Panels 1 and 2: the same as panels 4 and 5 of Figure 7, but for the antenna V2 – V1. Panel 3: hit rates for an alternative directionality metric, ∣V2∣ – ∣V1∣.
Download figure:
Standard image High-resolution image
Figure 9. Projected areas of the V2 (red) and V1 (black) sides of the spacecraft. Their magnitudes are slightly different than those of the V3 and V4 side projected areas, respectively, as a comparison with Figure 5 will show. This arises because the antennas do not point at exact 45° angles from the plane of PSP's movement, and may explain the smaller divergence of the V2 – V1 positive and negative hit rates (Figure 8 panel 2) as compared to that of the V3 – V4 hit rates (Figure 7 panel 5).
Download figure:
Standard image High-resolution imagePanel 3 presents the hit rates for an alternative directionality metric, ∣V2∣ – ∣V1∣, with V1 calculated from the available data for V2 – V1 and V2. It yields different results than V2 – V1 when impact signals have opposite polarities on V1 and V2, which V2 – V1 is more sensitive to, or when impact signals are negative on both V1 and V2, for which ∣V2∣ – ∣V1∣ indicates the opposite impact location as V2 – V1. If more valid than V2 – V1, this alternative metric further weakens the case for grains starting to strike the bus at φinc = 10°, but otherwise is compatible with the same analysis. The analogous rate ∣V3∣ – ∣V4∣ is unfortunately not available for the V3 – V4 antenna, so no comparison can be made.
7. Compatibility with Grains on Retrograde Circular Orbits
The V3 – V4, V2 – V1, and ∣V2∣ – ∣V1∣ directionality indicators all show a rapid exchange in their negative and positive hit rates when the spacecraft rolls 180° at 0.26 au, substantiating the tenet of this paper's analysis that differential impact signals across antennas provide information on impact location. For incident grains on prograde circular orbits, the attendant shifts in the V1, V2, V3, and V4 side projected areas are compatible with the observed hit rate shifts, but are smaller than expected. Quantitatively, the exchange in V3 – V4 positive and negative hit rates is roughly 50% of the total hit rate, while the exchange in the V3 and V4 side projected areas, illustrated in Figure 5, is only about 10% of the total projected area. More concerning is a mismatch of projected areas and hit rates after 0.26 postperihelion—a predominant negative hit rate should coincide with a predominant V4/V1 side exposure of the spacecraft.
The presence of a retrograde population of grains would resolve these two issues. Figure 10 shows the impacting φinc of these grains, the V3 and V4 side projected areas onto φinc provided the ϕroll values in Figure 4, and the impacting speed of these grains. The spacecraft roll at 0.26 au postperihelion produces a radical shift in the V3 side and V4 side projected areas, in agreement with the observed shifts in the positive and negative hit rates. Also, after 0.26 au postperihelion, the predominant V3 side projected area coincides with the predominant positive hit rate.
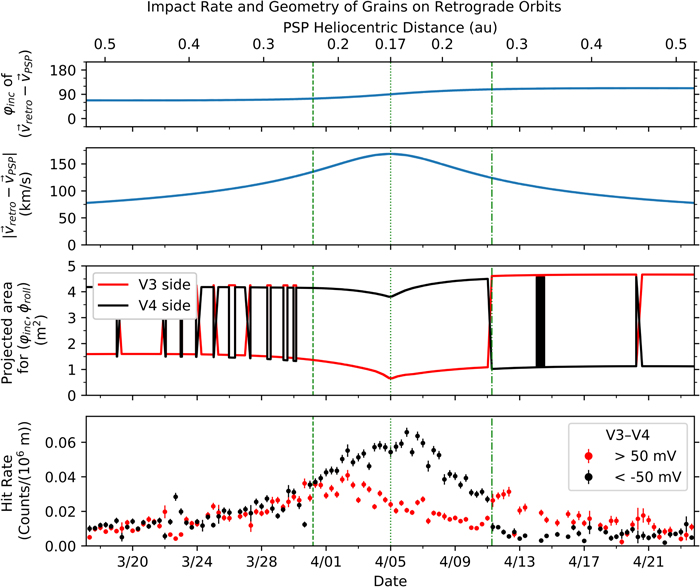
Figure 10. Panel 1: the incident angle of retrograde circular orbits. Panel 2: the speed of retrograde orbits relative to PSP. Panel 3: the projected areas of the V3 and V4 sides of the spacecraft for  and ϕroll Panel 4: V3 – V4 per-time hit rates normalized by
  .
.
Download figure:
Standard image High-resolution imageRetrograde grains' flow against more prevalent prograde material results in short collisional lifetimes compared to PR lifetimes, predicting a depletion of retrograde populations prior to their migration to 0.26 au (Steel & Elford 1986). However, this smaller number density is partially offset by the greater value of  as compared to
  , increasing the flux of retrograde grains.
For example, at 0.26 au,  km s−1 while
  km s−1, so prograde grains have to be more than three times more prevalent than retrograde grains for PSP to encounter them with equal frequency. In addition, the higher impact speeds of retrograde grains would result in a greater amount of charge produced by impact ionization, thereby improving PSP's ability to detect small impactors. At perihelion, these effects becomes more important as the incident speed of retrograde grains is 7.5 times that of prograde grains. The principal observational issue with the inference of a retrograde population is the lack of a systematically greater negative impact rate before 0.23 au preperihelion, when retrograde grains strike the V4 side of the spacecraft.
8. Compatibility with a Model of β-meteoroids with β = 0.7
A parallel study develops a model of β-meteoroids in the ecliptic originating from grains on prograde circular orbits that fragment at a heliocentric distance of 5 solar radii (Szalay et al. 2020). PSP impacts these β-meteoroids as they stream mostly radially away from the Sun, resulting in hits on the ram side and heat shield, as indicated by  in panel 1 of Figure 11. Most notably, this impact geometry agrees with the observed shift in dominant hit rate polarity at 0.26 au postperihelion from negative to positive. In addition, it does not predict an equalization in the hit rates around April 12th, where prograde circular geometry does due to
  , and where no such equalization is seen in the data.

Figure 11. Panel 1: the incident angle of modeled β-meteoroids with β = 0.7. Panel 2: the speed of these β-meteoroids relative to PSP. Panel 3: the projected areas of the V1, V2, V3, and V4 sides of the spacecraft for φinc and ϕroll. Panel 4: V3 – V4 per-time hit rates normalized by  . Panel 5: V2 – V1 per-time hit rates normalized by
  .
.
Download figure:
Standard image High-resolution image
These two β-geometry features are present in the retrograde geometry as well, but in a notable improvement, β-meteoroids would not overwhelmingly strike the V4 side of the spacecraft prior to 0.23 au preperihelion (green dashed line), where no such incidence is observed. Still, retrograde grains are better suited to the 50% exchange in the V3 – V4 positive and negative hit rates at 0.26 au postperihelion, where the exchange in β-model V3 and V4 side projected areas is 14%.
At perihelion, a fault in the β-meteoroid impact geometry is no prediction of a dip in negative hit rate, which is present weakly in the V3 – V4 data, and more prominently in the V2 – V1 and ∣V2∣ – ∣V1∣ data. This dip is predicted by prograde impact geometry. Conversely, β-geometry is consistent with the positive hit rate here, whereas prograde geometry incorrectly predicts a dip.
9. Conclusions
As was the case for Wind and Cassini, a dust impact signal's relative magnitudes on PSP's antennas can be used as an indicator of impact location. This is most conclusively shown when a 180° roll of the spacecraft produces a sharp exchange in the positive and negative hit rates for both antennas V2 – V1 and V3 – V4. Using projected areas on the spacecraft as predictors of the average antenna response to a given incident dust direction, the impact geometries of prograde, retrograde, and β-meteoroid orbits are compared to impact locations conveyed by the data. The incidence of β-meteoroids is consistent with important features in the dust hit rates, but other features indicate the presence of a population of prograde grains, and one strong feature could be explained by the presence of retrograde grains. This nonuniform result may point to the incompleteness of projected area as a gauge of antennas' impact responses, or to a diverse near-Sun dust environment. Future orbital passes of PSP will allow these points in question to be further addressed.
The FIELDS experiment on the Parker Solar Probe spacecraft was designed and developed under NASA contract NNN06AA01C. The FIELDS team acknowledges the contributions of the Parker Solar Probe mission operations and spacecraft engineering teams at the Johns Hopkins University Applied Physics Laboratory. S.D.B. acknowledges the support of the Leverhulme Trust Visiting Professorship program. B.P. acknowledges the support of the Robert P. Lin Graduate Fellowship.