


Abstract
Several fast solar wind streams and stream interaction regions (SIRs) were observed by the Parker Solar Probe (PSP) during its first orbit (2018 September–2019 January). During this time, several recurring SIRs were also seen at 1 au at both L1 (Advanced Composition Explorer (ACE) and Wind) and the location of the Solar Terrestrial Relations Observatory-Ahead (STEREO-A). In this paper, we compare four fast streams observed by PSP at different radial distances during its first orbit. For three of these fast stream events, measurements from L1 (ACE and Wind) and STEREO-A indicated that the fast streams were observed by both PSP and at least one of the 1 au monitors. Our associations are supported by simulations made by the ENLIL model driven by GONG-(ADAPT-)WSA, which allows us to contextualize the inner heliospheric conditions during the first orbit of PSP. Additionally, we determine which of these fast streams are associated with an SIR and characterize the SIR properties for these events. From these comparisons, we find that the compression region associated with the fast-speed streams overtaking the preceding solar wind can form at various radial distances from the Sun in the inner heliosphere inside 0.5 au, with the suprathermal ion population (energies between 30 and 586 keV) observed as isolated enhancements suggesting localized acceleration near the SIR stream interface at ∼0.3 au, which is unlike those seen at 1 au, where the suprathermal enhancements extend throughout and behind the SIR. This suprathermal enhancement extends further into the fast stream with increasing distance from the Sun.
Export citation and abstract BibTeX RIS

Original content from this work may be used under the terms of the Creative Commons Attribution 3.0 licence. Any further distribution of this work must maintain attribution to the author(s) and the title of the work, journal citation and DOI.
1. Introduction
As the faster solar wind stream overtakes preceding slower streams, a density "pileup" of compressed plasma occurs that eventually forms into a stream interaction region (SIR; e.g., Belcher & Davis 1971; Pizzo 1978; Richardson 2018). If the compression becomes strong enough as the SIR evolves, it can form SIR-associated forward and reverse shocks at and beyond 1 au (see Jian et al. 2006, 2008; Richardson 2018, and references therein). The stream interface is often associated with an increase in density prior to the transition to low-density fast wind, a peak in the magnitude of the magnetic field along with total pressure at the transition (often used to denote the interface; e.g., Jian et al. 2006), and an increase in both temperature and entropy when moving from the slow wind into the fast stream. These SIRs have been found to be a major source of energetic particles in the interplanetary medium (e.g., Van Hollebeke et al. 1981; Tsurutani et al. 1982; Richardson 2018), are known to be able to trigger geomagnetic storms (e.g., Tsurutani & Gonzalez 1997; Richardson et al. 2006; Turner et al. 2006; Richardson 2018), and can affect the ionosphere/thermosphere at Earth (e.g., Chen et al. 2014), making them important space weather phenomena.
Hundhausen (1973) constructed a hydrodynamic model to estimate the formation of SIRs in the inner heliosphere. This hydrodynamic model predicted that as a fast stream flows outward from the Sun into a slower wind, the velocity transition between the two streams will steepen, while the density, pressure, and temperature increases near the interface will become relatively stronger and sharper with radial distance (Hundhausen 1973). While most of our observations of SIRs and corotating interaction regions (CIRs; i.e., SIRs that persist for at least one complete corotation of the Sun) have been made at 1 au, prior to the Parker Solar Probe (PSP), the main missions capable of studying sub–1 au SIRs were Helios 1 and 2 and, at 0.7 au, the Pioneer Venus Orbiter. Richter & Luttrell (1986) conducted a superposed epoch study of 16 SIRs between 0.3 and 0.4 au and compared this to a similar superposed epoch study of 31 SIRs between 0.9 and 1.0 au. They found that the SIR velocity profile steepens within 1 au and the typical enhancements (i.e., pressure peak, magnetic field peak, and temperature increase across the transition between streams) are more clearly defined at 1 au than at 0.3 au. Additionally, through a survey of SIRs observed by the Pioneer Venus Orbiter, Jian (2008) found that the rate of SIRs with sharp stream interfaces increased from 9% at 0.7 au to 21% at 1 au.
At 1 au, SIRs are often accompanied by enhancements of energetic ions ranging from the suprathermal range (tens to hundreds of keV) to the energetic range (MeV) and that these enhancements can last up to several days following an SIR (see Richardson 2018 and references therein). The relative composition of these populations has a solar cycle variation (e.g., Lario et al. 2003; Mason et al. 2012; Filwett et al. 2017; Allen et al. 2019), and it has been suggested that they may be either locally accelerated (e.g., Schwadron et al. 1996; Ebert et al. 2012; Filwett et al. 2017, 2019) or propagated sunward from SIR-associated shocks further out in the heliosphere (e.g., Mewaldt et al. 1978; Fisk & Lee 1980; Roelof 2000; Lario & Roelof 2007; Zhao et al. 2016). Several studies have suggested that the energy range of the particles may separate the locally versus distantly accelerated ions, with the lower-energy suprathermal particles (below ∼1 MeV nuc–1) possibly coming from a local source, while particles above ∼1 MeV nuc–1 may have been further accelerated by shocks at larger heliocentric distances before propagating back into the inner heliosphere (e.g., Ebert et al. 2012; Filwett et al. 2019). As such, comprehensive studies of SIRs and their associated suprathermal and energetic components observed within 1 au provide insight into both the formation of SIRs and any associated acceleration occurring near the stream interface.
The present study focuses on four fast-speed streams observed by PSP during the 4 months around its first perihelion pass to determine which of these had associated SIRs, as well as to characterize their plasma and magnetic field properties and any suprathermal ion components. A subset of these events also observed by satellites near 1 au (by the Advanced Composition Explorer (ACE), Wind, and the Solar Terrestrial Relations Observatory-Ahead (STEREO-A) Ahead spacecraft) are further investigated as well. Section 2 discusses the multiple data sets and models used in this investigation. Section 3 describes the observations from PSP, ACE, Wind, and STEREO-A of the fast-speed streams and SIRs. Discussion and summary of the conclusions of this study are presented in Sections 4 and 5, respectively.
2. Instrumentation
2.1. PSP
The PSP mission (Fox et al. 2016) was launched on 2018 August 12 and inserted into a heliocentric orbit around the Sun. Its first orbit brought the spacecraft within 35 solar radii (∼0.16 au), and successive orbits will slowly bring the spacecraft closer to the Sun by using gravity assists from Venus.
The solar wind bulk plasma properties at PSP are measured by sensors from the Solar Wind Electrons Alphas and Protons (SWEAP) instrument suite (Kasper et al. 2016). SWEAP is comprised of a solar-facing Faraday cup, the Solar Probe Cup (SPC; Case et al. 2020), and three electrostatic analyzers, the Solar Probe ANalyzers (SPAN), for measuring ions (Livi et al. 2020) and electrons (Whittlesey et al. 2020) over several look directions. This study uses 1 minute averages of solar wind observations from SPC, which measures ions in the energy range of 50 to 8 keV q–1. The SPC sensor provides the solar wind proton thermal velocity as a regular data product. For this study, the proton thermal velocity was converted to proton temperature using the equation

where T is the temperature, m is the mass of a proton, k is Boltzmann's constant, and vT is the thermal velocity reported by SPC. The use of the proton mass is appropriate, since SPC is able to reliably separate protons from He++ particles in determining the proton thermal velocity. Additionally, the entropy (S) of the solar wind is computed using the density (n) measured by SPC and the derived temperature (T) following the formula (e.g., Jian et al. 2006)
Magnetic field (B) measurements at PSP are provided by the FIELDS suite (Bale et al. 2016). The magnetic field vector provided by FIELDS in PSP-centered radial–tangential–normal (RTN) coordinates is used to compute the θ and ϕ components,
Additionally, the combined magnetic and proton plasma pressure is computed using both FIELDS and SPC following the form

To investigate suprathermal ions, measurements from the Integrated Science Investigation of the Sun (IS⊙IS; McComas et al. 2016) Energetic Particle Instrument—Lo (EPI-Lo; Hill et al. 2017) are used. In this paper, only a 30 minute average of the "IonToF" product is used, which allows for measurements down to ∼30 keV nuc–1 and up to 586 keV nuc–1, adequate for investigating locally accelerated ions. While higher-energy products of EPI-Lo are able to separate mass with sufficiently high mass resolution to distinguish between H, 3He, 4He, O, and Fe, the "IonToF" product does not discriminate between species.
2.2. L1 Monitors (ACE and WIND)
The ACE spacecraft (Stone et al. 1998) was launched on 1997 August 25 and has since been orbiting the sunward Lagrange point of Earth (L1). The Solar Wind Electron Proton Alpha Monitor (SWEPAM) instrument (McComas et al. 1998) on ACE is capable of measuring the velocity, density, and temperature of the bulk solar wind (with energies of 260–36 keV q–1). However, sensor degradation after ACE's prime mission has recently led the density moment to only be available sporadically. The ACE magnetic fields investigation (MAG; Smith et al. 1998) provides the magnetic field vector, and the Electron, Proton, and Alpha Monitor (EPAM) instrument (Gold et al. 1998) measures suprathermal ions. The present study uses 64 s averages of the SWEPAM observations, 1 minute averages of the 16 s averaged magnetic field vector, and 5 minute ion intensity averages measured in the EPAM LEMS120 channels P2 through P5, which cover ions in the energy range of 68–580 keV.
To help fill in the bulk plasma conditions, observations (bulk solar wind and magnetic field) from Wind (Acuña et al. 1995) are plotted alongside those from ACE in this study. Wind launched on 1994 November 1 and, after a campaign aimed at studying the magnetosphere, has been stationed at L1 since 2004 May. Bulk solar wind plasma parameters are measured by the Solar Wind Experiment (SWE) (Ogilvie et al. 1995), and the magnetic field is measured by the Wind Magnetic Field Instrument (MFI; Lepping et al. 1995). This study utilizes 1 minute resolution Wind data. Entropy, pressure, and the magnetic field θ and ϕ components for both ACE and Wind are computed using the equations given in the preceding subsection.
2.3. STEREO-A
STEREO was launched on 2006 October 25, and the twin spacecraft orbit around the Sun in the ecliptic plane (Kaiser et al. 2008). Contact with STEREO-B was lost in 2014 October, and STEREO-A passed the far side of the Sun in 2015 and has been approaching the Earth with a declining longitudinal separation by about 22° yr–1. During the time period analyzed in this study (2018 September 1–2018 December 31), STEREO-A was located at a heliocentric distance of ∼0.96 au and 107°–101° east of Earth. In this study, we use the 1 minute magnetic field and suprathermal particle data from the in situ Measurements of Particles and CME Transients (IMPACT) investigation (Luhmann et al. 2008) magnetometer (Acuña et al. 2008) and the Solar Electron and Proton Telescope (SEPT) instruments (Müller-Mellin et al. 2008). This study uses six energy channels (bin numbers 2, 5, 8, 11, 14, and 17) from SEPT measuring ions with energies from 84.1 to 496.4 keV. Additionally, 1 minute bulk solar wind (300–80 keV q–1) properties are from the Plasma and Suprathermal Ion Composition investigation (Galvin et al. 2008).
2.4. Simulations
The global 3D magnetohydrodynamic heliospheric WSA-ENLIL model (Arge et al. 2004; Odstrcil et al. 2004) uses synoptic solar magnetic field maps derived from magnetograms to provide a time-dependent description of the background solar wind plasma and interplanetary magnetic field. ENLIL simulations were performed on a medium-resolution (2°) spherical grid of size 512 × 60 × 180 (r, θ, ϕ) with a simulation range of 0.1–2.1 au in radius (r), −60° to +60° in latitude (θ), and 0°–360° in longitude (ϕ). The time-dependent ENLIL inner boundary at 21.5 solar radii (Rs) was created from a series of WSA outer boundary synoptic maps each computed from a new photospheric magnetic field map every 1–2 hr. Model versions WSA 4.5 and ENLIL 2.9 were used in this study.
In general, the WSA model can be driven by synoptic magnetograms from any observatory. For this study, two different inputs were used for the WSA model: zero-point-corrected quick-reduce magnetogram synoptic maps from the Global Oscillation Network Group (GONG; Harvey et al. 1996) and the Air Force Data Assimilative Photospheric Flux Transport (ADAPT; Arge et al. 2010; Henney et al. 2012) ensemble of maps computed from GONG full-disk magnetograms. ADAPT produces an ensemble of 12 model realizations based on varying model parameters within the range of their uncertainties. We primarily focus on ensemble member (or realization) 7, which qualitatively best matches the PSP observations, as well as performing very well compared to the L1 observations. However, we show the range of solutions for realizations 0, 2, 7, and 9 to illustrate the range of obtainable results. The different simulations are referred to as WSA-ENLIL and ADAPT-WSA-ENLIL in this paper, although both are initially driven by GONG synoptic maps and provide contextual views of the heliosphere within 1 au to aid with in situ comparisons.
3. Results
3.1. Overview of SIRs Observed near Perihelion 1 at PSP
Figure 1 shows the in situ data from PSP during the 4 month period around the first perihelion on 2018 November 6. For more discussion of the initial observations during the first two perihelion passes, see Bale et al. (2019), Howard et al. (2019), Kasper et al. (2019), and McComas et al. (2019). Overlaid on the PSP observations (black dots) are simulation results from WSA-ENLIL (yellow line) and a soon-to-be operational version of ADAPT-WSA-ENLIL from ADAPT realization 7 (blue line), with the full range of values using ADAPT realizations 0, 2, 7, and 9 shown by the blue shaded regions. The simulations capture general large-scale changes in the solar wind; however, the timing of the velocity enhancements is generally off by a few days. From both the PSP observations and ENLIL simulations, there were likely two SIRs at PSP in early October (near October 5 and 11), but data gaps in the PSP data sets prevent us from analyzing these events in any detail. However, PSP did observe four regions between slow and fast streams later during the first orbit at solar distances ranging from ∼65 to ∼155 Rs (denoted by the gray shaded regions), which are further analyzed and presented in this paper. The sudden velocity increases on October 31 and November 12 (denoted by pink bars) are associated with interplanetary coronal mass ejections (ICMEs) observed in situ by PSP (see, for example, McComas et al. 2019; Giacalone et al. 2020; Korreck et al. 2020; Mitchell et al. 2020; Nieves-Chinchilla et al. 2020; Rouillard et al. 2020), rather than SIRs, and as such are not further discussed in this paper.
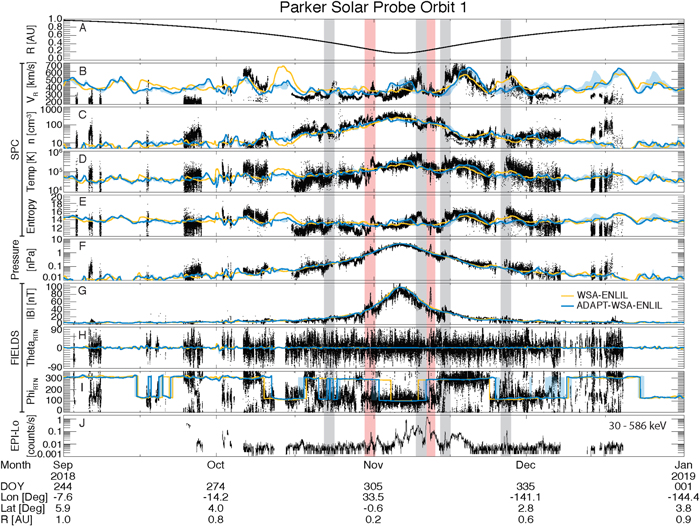
Figure 1. Four months around the first perihelion of PSP. The first perihelion occurred on 2018 November 6, when PSP reached a heliospheric distance of 35.7 Rs (0.16 au). (a) Heliocentric distance of PSP; solar wind proton (b) radial velocity, (c) density, (d) temperature, and (3) entropy from SPC; (f) combined magnetic and proton thermal plasma pressure; (g) magnetic field magnitude and (h) θ and (i) ϕ angles from FIELDS; and (j) EPI-Lo ion ToF count rate for energies between 30 and 586 keV. Solid colored lines denote estimates from the WSA-ENLIL (yellow) and soon-to-be operational version of ADAPT-WSA-ENLIL (using realization 7; blue line) models, as well as the minimum-to-maximum range from using ADAPT realizations 0, 2, 7, and 9 (blue shaded regions). The gray shaded regions denote the four fast streams observed by PSP during the first perihelion studied in this paper. Pink shaded regions denote fast streams associated with ICMEs, which are not discussed in this study. The latitude and longitude of PSP listed on the bottom of the plot are in HEEQ coordinates.
Download figure:
Standard image High-resolution imageADAPT-WSA-ENLIL (blue line) does reproduce the event on 2018 October 23 (left-most shaded region in Figure 1), although it reports a lower-amplitude velocity enhancement that peaks ∼1 day after the observed peak at PSP. However, the results from WSA-ENLIL (yellow line) do not report any significant change in the radial velocity at PSP during this interval. Similarly, only the ADAPT-WSA-ENLIL model has a velocity decrease at PSP for the second event of this study (2018 November 10), although the modeled decrease is ∼1 day before that observed by PSP. Both models predict the third fast stream (2018 November 15), although the peak in velocity for both models is ∼3 days after that observed by PSP. Lastly, the timing of the peak velocity during the fourth event (2019 November 26) is captured well by the WSA-ENLIL model, but the high-speed stream is not appreciably seen in the ADAPT-WSA-ENLIL results. Although there are not many high-quality SPC observations prior to this fourth high-speed stream, the WSA-ENLIL simulation still appears to overestimate the solar wind velocity at PSP prior to the high-speed stream.
To better visualize the SIRs, Figure 2 shows idealized Parker spiral magnetic field lines (i.e., ballistic trajectory) in Carrington coordinates. These field lines are generated from the modal value of the solar wind radial velocity (Figure 1, panel (b)) computed at an hourly cadence and shown projected into the solar equatorial plane. They assume a solar rotation rate given by the equatorial rotational period of 24.47 days. Both the color and the curvature of the field lines indicate the solar wind speed. This clearly illustrates the four main regions of fast streams observed during the first PSP perihelion, marked by the time stamps. Additionally, this nominal picture illustrates regions beyond the PSP trajectory where the nominal Parker spiral would pile up (i.e., where slow solar wind field lines are overtaken by fast stream field lines at larger radial distances). This picture assumes that the stream structure shown is static in time as PSP moves through one Carrington rotation but can serve to better contextualize the observations.
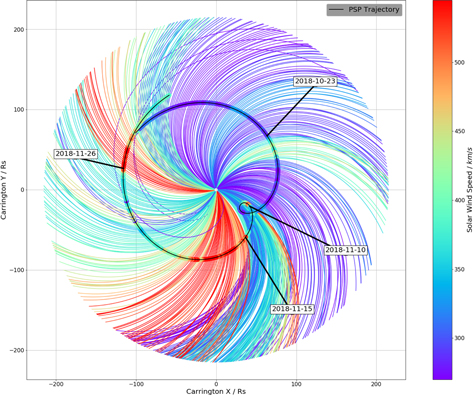
Figure 2. The PSP trajectory ±3 weeks around the first perihelion in Carrington coordinates, projected onto the ecliptic plane (shown in black). The observed solar wind velocity at PSP is used to initialize nominal Parker spiral magnetic field lines along the trajectory of PSP, and each field line is colored by the velocity at PSP. The four fast streams observed in the first orbit are denoted on the figure.
Download figure:
Standard image High-resolution image3.2. Overview of Contextual Modeling Efforts
Figure 3 illustrates the ADAPT-WSA results for the first perihelion of PSP. The light (dark) gray regions of the map indicate closed positive (negative) photospheric magnetic field polarity regions. The overlaid color map shows the model-derived solar wind speed emerging from regions of open magnetic field. White crosses mark the latitude and longitude of PSP over the course of the Carrington rotation, and black lines connect the satellite positions to the points on the photosphere to which it is magnetically connected. This figure is based on an ADAPT-WSA model run for 2018 November 4. Wind leaving the model region at this time would have arrived at PSP near the time of perihelion. Solar wind speed and magnetic field at the outer boundary (positioned at a radius of 21.5 Rs) from a series of these models are used as inner boundary conditions for the ENLIL model for comparisons with PSP, STEREO-A, and ACE/Wind.

Figure 3. ADAPT-WSA results for the interval around the first perihelion. The white plus signs show the projection of the PSP location onto the solar surface, and the black lines point to the modeled coronal sources of the solar wind at PSP from mapping field line tracing through the WSA model. The color denotes solar wind speed at 21.5 Rs. A series of these models are used as an inner boundary condition for the ADAPT-WSA-ENLIL models in this paper. There were two low-latitude coronal holes that were connected to PSP around the time of perihelion.
Download figure:
Standard image High-resolution imageAs discussed in more detail in Badman et al. (2020), potential field source surface (PFSS) mapping suggests that at perihelion, there was connectivity down to a negative polarity equatorial coronal hole around 330° Carrington longitude continuously over 14 days, followed by a heliospheric current sheet (HCS) crossing (see Szabo et al. 2020, for comparisons of PSP observed HCS crossings and different models), at which point the configuration switches to an equatorial/midlatitude positive coronal hole, and the foot points track northward in time (Badman et al. 2020). The fast stream interval near November 15 is expected to be near where the PFSS mapping switches the source of the solar wind to the northern hemisphere coronal hole structure. Meanwhile, the November 10 event corresponds to an increase in solar wind speed during the protracted connection to the same coronal hole. This may be due to either some dynamic change in the source of the solar wind or a change in the field foot point from the edges of that coronal hole to deep inside of it. The later November 26 event happens after the HCS crossing back from positive to negative (see Szabo et al. 2020) and appears to correspond to a very large equatorial coronal hole around 200° longitude (see Badman et al. 2020). For the October 23 fast stream event, PSP is near the HCS (see Szabo et al. 2020). As such, the slow solar wind is likely from a streamer belt, while the fast stream is suspected to be a result of a short-term diversion of the solar wind source to the southern polar coronal hole.
3.3. Conjugate Observations of Fast Streams at L1 (ACE and Wind)
As seen in the results from WSA-ENLIL (see the online animated Figure 4), L1 is a better conjugate point than STEREO-A for the fast streams observed in October, due to PSP and L1 being at similar longitudes. Figure 5 shows the solar wind properties observed with ACE (black) and Wind (red) for October 1–November 10 in a similar format as Figure 1. The bottom panel illustrates ACE EPAM ion fluxes for four different energy channels ranging from 68 to 580 keV. During this time interval, multiple fast streams were observed at L1. Starting from the fast-speed streams observed at PSP, the streams were tracked in ADAPT-WSA-ENLIL to determine whether, and if so when, the streams reached L1 (for example, the October 23 PSP observed stream reached L1 on October 26). The ACE and Wind plasma and field data are then visually inspected to find the exact time of the stream's arrival or validate that the stream did not reach L1. The model was also used to follow PSP observed streams backward in time to check for preexisting CIRs, which may have been observed at L1 prior to any PSP observations as the stream corotated. This back-tracing of the fast stream revealed that the stream observed on November 15 at PSP had been previously observed at L1 on November 4. Both of the streams that were identified at both PSP and L1 are denoted by the shaded regions in Figure 5 and will be shown in more detail in the following sections. While the two fast streams observed near October 7 and 13 likely correspond with the simulated fast streams at PSP on October 5 and 11, during these events, PSP did not record plasma and field data, so they are not further discussed in this paper.
Figure 4. An animation of the time history of the WSA-ENLIL simulated radial solar wind speed shown in the (a) ecliptic plane and (b) meridional plane intersecting PSP is available in the online journal. The animation proceeds from 2018 October 1 to 2018 December 31.
(An animation of this figure is available.)
Download figure:
Video Standard image High-resolution image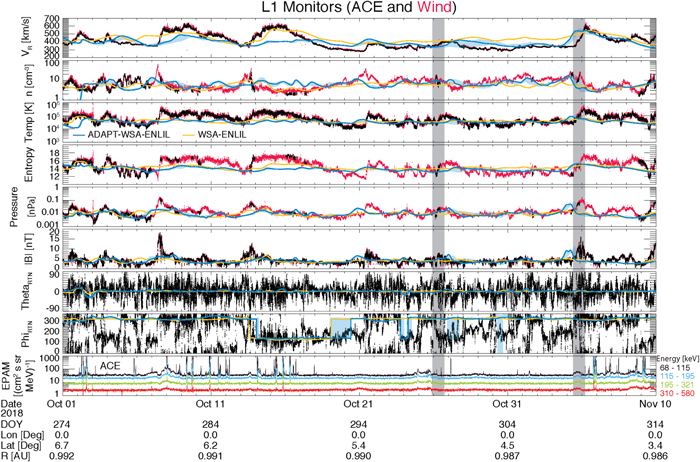
Figure 5. L1 observations from ACE (black) and Wind (red) around the intervals of fast streams observed by PSP in October, showing the solar wind plasma, magnetic field, and energetic particle quantities as in Figure 1. The ACE EPAM ion observations are shown in the bottom panel, with colors indicating the energy channel (energy range listed on the right in keV). The shaded regions denote fast stream intervals further discussed in the paper. Blue and yellow lines denote the modeled values from ADAPT-WSA-ENLIL and WSA-ENLIL, respectively.
Download figure:
Standard image High-resolution imageExamining both the WSA-ENLIL and ADAPT-WSA-ENLIL simulations compared to observations at L1 (Figure 5), the WSA-ENLIL result (yellow line) does fairly well in simulating the two fast streams observed by ACE and Wind on October 7 and 13, as far as peak velocity. However, the WSA-ENLIL results expect a gradual, rather than sudden, velocity enhancement for the October 7 stream, and the timing is seen to be delayed by ∼1 day in the October 13 event. The ADAPT-WSA-ENLIL model (blue line) does not appear to capture the large-scale structures in early October to the same degree as the WSA-ENLIL simulation, showing a slight velocity increase ∼1 day after the October 7 high-speed stream and little variation during the October 13 event. The small speed increase observed at L1 on October 26 is captured by only ADAPT-WSA-ENLIL, although ∼1 day late. The ADAPT-WSA-ENLIL model also better captures the morphology of the SIR observed by ACE and Wind on November 4. Despite the arrival time of that SIR at 1 au being ∼1 day earlier than the ACE and Wind observations, the solar wind plasma and magnetic field characteristics simulated by the ADAPT-WSA-ENLIL model generally agree with the ACE/Wind measurements, although the values of the magnetic field and plasma components are systematically less than those observed at PSP.
3.4. Conjugate Observations of Fast Streams at STEREO-A
Using the same methodology as in Section 3.3, the ADAPT-WSA-ENLIL model was used to assist in finding conjugate PSP observations of fast-speed streams at STEREO-A. The time period (2018 November 1–2018 December 16) in which the PSP observed SIRs would reach 1 au near the longitude of STEREO-A is shown in Figure 6. The bottom panel of Figure 6 illustrates SEPT observations from six energy channels ranging from 84.1 to 496.4 keV. Two conjunction events (i.e., fast streams observed at both PSP and STEREO-A) were observed by STEREO-A around November 22 (November 15 at PSP) and December 1 (November 26 at PSP) and are denoted by the gray shaded regions in Figure 6.
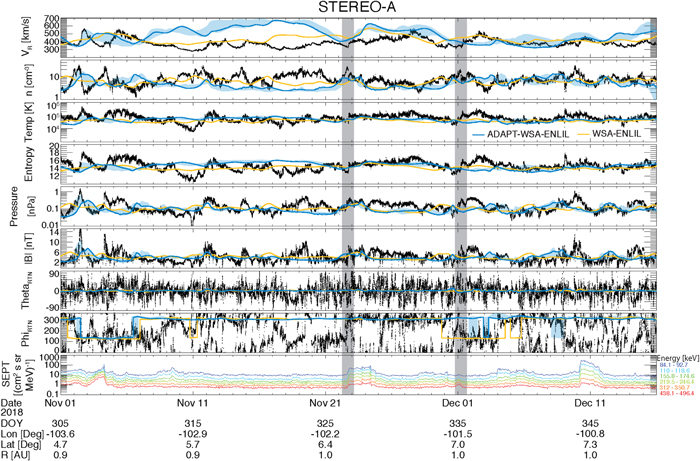
Figure 6. STEREO-A observations around the time of the three fast streams observed at PSP in November, showing the solar wind plasma, magnetic field, and energetic particle quantities as in Figure 1. The SEPT-observed ion flux is shown in the bottom panel, with the colors denoting energy channels (energy range denoted to the right of the plot in keV). The shaded regions mark the times corresponding to when PSP observed high-speed streams that would have reached STEREO-A based on visual identification aided by ENLIL simulations. Blue and yellow lines denote the modeled values from ADAPT-WSA-ENLIL and WSA-ENLIL, respectively.
Download figure:
Standard image High-resolution imageUnlike at PSP and L1, simulations from both WSA-ENLIL and ADAPT-WSA-ENLIL do not well capture the solar wind characteristics compared to STEREO-A observations for this time interval, likely due in part to the presence of stale magnetogram data in the region of the synoptic maps near STEREO-A (STEREO-A was near 106° east of the Earth during this interval). In particular, all realizations used for ADAPT-WSA-ENLIL result in too high of a solar wind velocity, without capturing the qualitative increases/decreases observed at STEREO-A, for most of November. While WSA-ENLIL is quantitatively closer in value to the observations than ADAPT-WSA-ENLIL, it also does not qualitatively capture the increases/decreases in the observations for most of this interval. Both models do, however, predict an increase in solar wind velocity near, but ∼1.5 days after, the November 22 event, although both predicted velocities are much higher in value. Also, WSA-ENLIL shows a velocity enhancement ∼2 days prior to the December 1 event, which is missing in the ADAPT-WSA-ENLIL simulation. The data–model comparisons in Sections 3.1–3.4 demonstrate the need for by-eye corrections using the field and plasma observations in lining up these conjunction events, as the modeled timing of these high-speed streams can be off by 1–3 days or missing completely.
3.5. Event Studies
3.5.1. Event 1: 2018 October 23 (PSP) and 2018 October 26 (L1)
The fast-speed stream that was observed by PSP on October 23 is shown in more detail in Figure 7 (left panels). Figure 8 shows the radial solar wind speed contour plots from the WSA-ENLIL simulation on 2018 October 25 (left) and October 27 (right). At ∼90 Rs (∼0.4 au), the stream is driving a minor compression region (i.e., leading to a density pileup in front of the stream and to the beginning of a pressure enhancement during the transition from slow- to fast-speed streams), corresponding to a small increase in the magnetic field. However, the solar wind temperature and entropy are not observed to increase as PSP traverses into the fast stream, nor is there a corresponding suprathermal particle enhancement in the EPI-Lo observations. As such, this compression region does not show signs of having yet developed into an SIR.
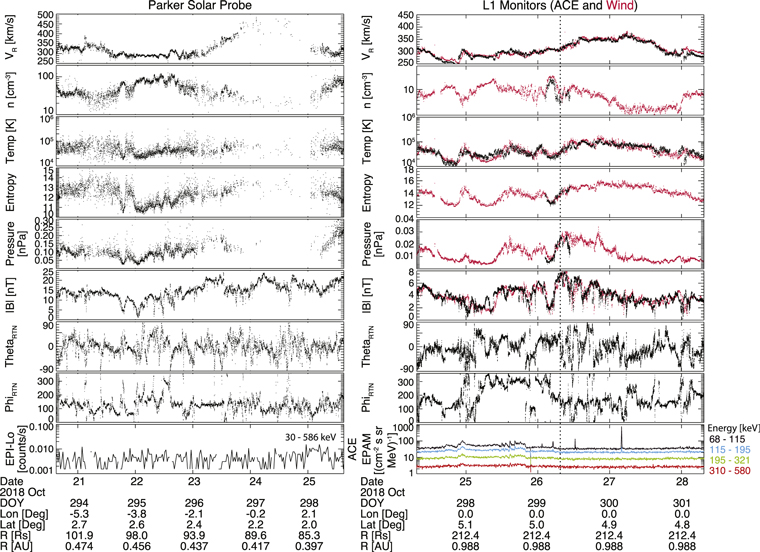
Figure 7. Fast stream event 1 observed around October 23 at PSP (left), later observed at ACE (right; black) and Wind (right; red) on October 26, shown in the same format as Figure 1 (with the exception of radial distance). The stream interface identified at L1 is denoted by the dotted vertical line.
Download figure:
Standard image High-resolution image
Figure 8. WSA-ENLIL simulation of the radial solar wind speed shown in the (a) ecliptic plane and (b) meridional plane on 2018 October 25 prior to the fast stream event 1 encountering PSP (left) and L1 (right). See the online animated Figure 4 for the time history of the simulation fast stream event.
Download figure:
Standard image High-resolution imageLooking at observations of the stream reaching ACE and Wind at L1 (Figure 7, right panels), the stream is associated with a density enhancement prior to the fast-speed stream. This density enhancement is observed to coincide with a depression in the magnetic field. Unlike when the stream was observed at PSP, the solar wind temperature slightly increases as the fast stream crosses L1, the entropy increases, and the total pressure enhancement becomes more pronounced. In addition, the "fast" wind at 1 au is slower than 400 km s−1 and even slower than the corresponding stream at PSP, possibly because of the deceleration by the surrounding slow solar wind. From these signatures, the stream shows signs of having developed into a very weak SIR by 1 au, with an interface marked with the dotted line at the time of peak pressure. However, there is no distinguishable response in the suprathermal particle flux above the instrumental background at ACE with the crossing of this very weak SIR.
3.5.2. Event 2: 2018 November 10 (PSP)
As seen in the WSA-ENLIL simulations (see the online animation in Figure 4), PSP's fast longitudinal velocity near perihelion (∼44 Rs, ∼0.21 au) allowed it to overtake the fast stream observed on November 10. At the time of this crossing, PSP was traveling at ∼80 km s−1 in the tangential direction in the RTN frame. Shortly after PSP overtook the stream, the fast stream was simulated by WSA-ENLIL (the online animation presented in Figure 4) to leave the ecliptic plane. Figure 9 displays the PSP observations during this event, and Figure 10 shows a single time point of the simulated solar wind structures from WSA-ENLIL right before the spacecraft is predicted to cross over the SIR. As in the case of event 2 on October 31 in Figure 1, conjugate fast streams or SIR intervals were not found at either ACE or STEREO-A (see the online animation presented in Figure 4). Due to PSP overtaking the fast stream, rather than the stream passing over the spacecraft, the velocity is observed to go from a fast to a slow stream. There is no density enhancement related to the fast stream observed during this observation, as the increase in density on November 11 and 12 is related to the compression formed in front of the passage of an ICME (see McComas et al. 2019; Giacalone et al. 2020; Korreck et al. 2020; Mitchell et al. 2020; Nieves-Chinchilla et al. 2020; Rouillard et al. 2020). The temperature and entropy are both observed to be higher in the fast stream than in the slow wind, but there is no notable increase in pressure or suprathermal ion enhancement. The broad variations in the EPI-Lo count rate prior to November 11 are suspected to be from photon contamination associated with solar flares (see Hill et al. 2019), and the large increase in the energetic particle count rate on November 11–12 is associated with the CME (see Giacalone et al. 2020; Mitchell et al. 2020). As such, this stream has not yet developed into an SIR.

Figure 9. Fast stream event 2 on November 10, when PSP overtook the fast stream, resulting in observations transitioning from high- to slow-speed wind. Same format as Figure 7.
Download figure:
Standard image High-resolution image
Figure 10. WSA-ENLIL simulations prior to the existing fast stream event 2 encountering PSP in the same format as the online animated Figure 4. PSP is seen to overtake the fast stream during this event.
Download figure:
Standard image High-resolution image3.5.3. Event 3: 2018 November 15 (PSP), 2018 November 22 (STEREO-A), and 2018 November 4 (L1)
The SIR observed by PSP on November 15 at ∼68 Rs (∼0.3 au; Figure 11, left) was first observed at L1 on November 4 (Figure 12) and later observed by STEREO-A on November 22 (Figure 11, right). Figure 13 shows single time snapshots from WSA-ENLIL model results for each of the spacecraft just prior to when each spacecraft observed the SIR. The persistence of this structure distinguishes this event from the other fast streams investigated in this study. At PSP, STEREO-A, and L1, the solar wind has the typical signatures of an SIR at 1 au: (1) an increase in density prior to the interface and a low-density region after the interface, (2) a temperature increase at the SIR, (3) an entropy increase at the SIR, (4) a pressure peak at the interface, and (5) an increase in B at the interface. One notable difference between the three observations is in the energetic particle measurements. On PSP, EPI-Lo observes a sudden enhancement in count rate at the stream interface with a second broader enhancement later in the fast stream that may be associated with a CIR at larger radial distances (see Cohen et al. 2019; Desai et al. 2019). Meanwhile, STEREO-A SEPT observes only a broad enhancement beginning at the interface and extending well into the fast stream, and ACE observes a slight, but notably less broad than at STEREO-A, enhancement in EPAM suprathermal particles that extends into the slow solar wind from the interface and is more likely related to the HCS crossing on November 4.
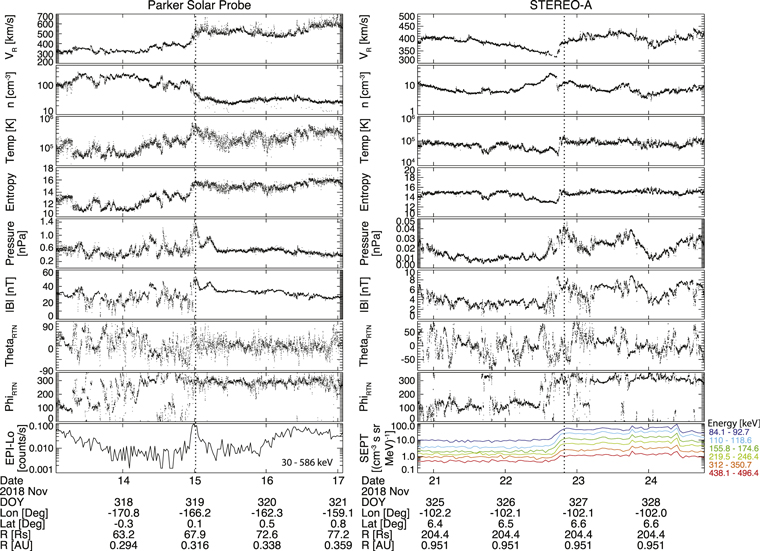
Figure 11. (Left) PSP observations of CIR during fast stream event 3 and (right) STEREO-A observations of the SIR during fast stream event 3, in the same format as Figure 7.
Download figure:
Standard image High-resolution image
Figure 12. L1 observations of the CIR during fast stream event 3 seen prior to the PSP observation. Shown in the same format as the online animated Figure 4.
Download figure:
Standard image High-resolution image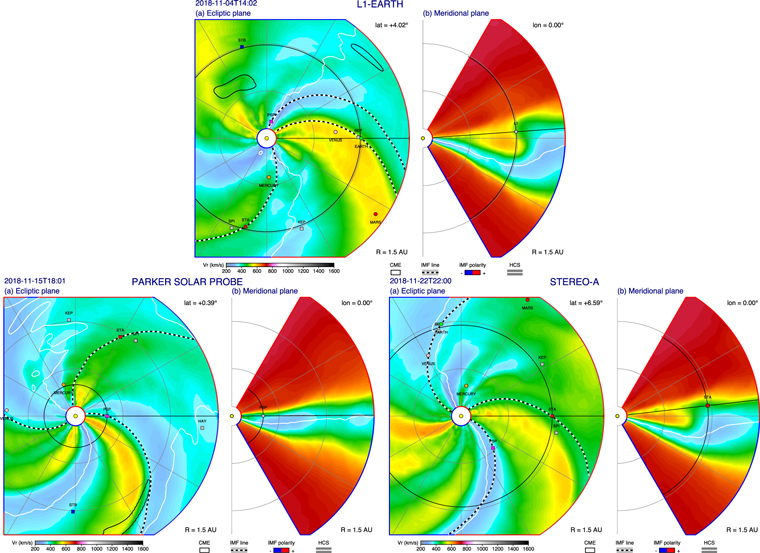
Figure 13. WSA-ENLIL radial solar wind speed simulations prior to the fast stream event 3 encountering L1 on November 4 (top), PSP on November 15 (bottom left), and STEREO-A on November 22 (bottom right), in the same format as the online animated Figure 4.
Download figure:
Standard image High-resolution image3.5.4. Event 4: 2018 November 26 (PSP) and 2018 December 1 (STEREO-A)
The final fast stream observed by PSP during the first orbit was on November 26 at ∼0.55 au, and it was later observed at STEREO-A on December 1 (Figure 14). Both the PSP and STEREO-A observations are indicative of an SIR (i.e., density enhancements prior to the SIR interface, temperature and entropy increases from slow to fast streams, and magnetic field enhancements occurring with the density pileup). However, the PSP observations observe two pressure enhancements (denoted by the two dotted lines), largely due to two strong increases in the magnetic field. The first of these pressure increases corresponds to a very small, possibly insignificant, increase in the EPI-Lo count rate, while the second pressure enhancement corresponds to a clear suprathermal ion enhancement seen by EPI-Lo. Conversely, the SIR observed at STEREO-A does not correspond to any enhancement in suprathermal ions observed by SEPT, with the exception of the highest-energy channels used in this study (i.e., 312–350.7 and 438.1–496.4 keV). This increase is observed prior to the immersion of STEREO-A into the high-speed stream, which may also be related to processes occurring in the compressed HCS crossings, such as the ion intensity increase observed by ACE/Wind in event 3 (Figure 12). The HCS crossing occurred at about the same time as the SIR at STEREO-A, but it appeared a few days earlier than the SIR at PSP.
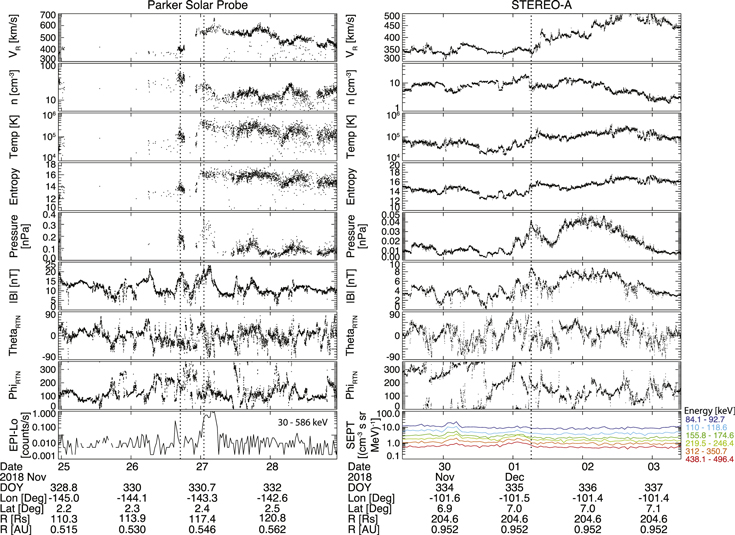
Figure 14. (Left) PSP observations and (right) STEREO-A observations of fast stream event 4, in the same format as Figure 7.
Download figure:
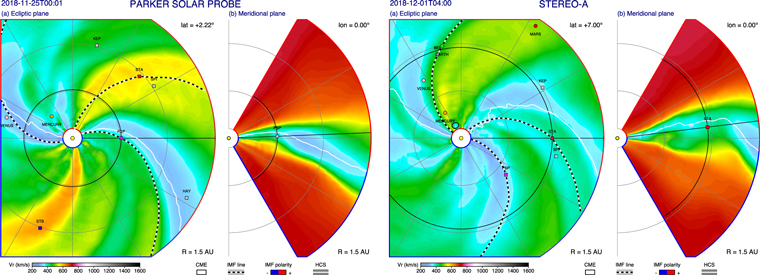
Standard image High-resolution imageThe WSA-ENLIL model results just before the SIR was observed at either spacecraft are illustrated in Figure 15. Here WSA-ENLIL predicts the arrival of the fast stream at PSP in two steps, the first on 25 November and then a second increase on November 27 (Figure 1). Following the WSA-ENLIL simulation in time (animation presented in Figure 4), the model predicts that the fast stream leading to the SIR observed at PSP becomes broader and propagates south of the ecliptic plane, while STEREO-A is expected to observe the stream at more northern latitudes.
Figure 15. WSA-ENLIL radial solar wind speed simulations prior to fast stream event 4 encountering PSP (left) and STEREO-A (right) in the same format as the online animated Figure 4.
Download figure:
Standard image High-resolution image
4. Discussion
During the first orbit of PSP, two developed SIRs and one compression region were observed during four significant fast stream encounters (summarized in Table 1), one of which was later observed at L1 (event 1; October 23 at PSP (0.4 au), October 26 at ACE/Wind), one later observed by STEREO-A (event 4; November 26 at PSP (0.5 au), December 1 at STEREO-A), and one observed first by ACE/Wind, then PSP, and finally STEREO-A (event 3; November 4 at ACE/Wind, November 15 at PSP (0.3 au), November 22 at STEREO-A). Aided by the use of ADAPT-WSA-ENLIL, we have studied these three sets of observations, along with the one non-SIR fast stream encounter. They provide a snapshot of fast-speed streams observed at different radial distances (0.2, 0.3, 0.5, and 1 au) during different points of SIR formation and observations of the same SIRs at both 0.3 and 0.5 au versus 1 au.
Table 1. Summary of Fast Stream Intervals Studied during PSP Orbit 1 along with Characteristics when Seen at 1 au
| Event | PSP | Heliocentric | Associated | Suprathermal | Seen at | 1 au Suprathermal |
|---|---|---|---|---|---|---|
| Date | Distance | with SIR? | Intensity Enhancement | 1 au | Intensity Enhancement | |
| (1) | (2) | (3) | (4) | (5) | (6) | (7) |
| 1 | 2018 | 0.43 au | Compression region, | No | L1: 2018 | No |
| Oct 23 | not full SIR | Oct 26 | ||||
| 2 | 2018 | 0.21 au | No | No | No | ⋯ |
| Nov 10 | ||||||
| 3 | L1: 2018 | No | ||||
| 2018 | 0.31 au | Yes | Yes, | Nov 4 | ||
| Nov 15 | localized to interface | STEREO-A: 2018 | Yes, | |||
| Nov 22 | lasting ∼1 day | |||||
| after interface | ||||||
| 4 | 2018 | 0.54 au | Yes | Yes, | STEREO-A: 2018 | Small enhancement |
| Nov 26–27 | reaching ∼6 hr after | Dec 1 | only at higher energies | |||
| interface | prior to interface | |||||
Download table as: ASCIITypeset image
Investigating the fast-speed stream properties from ∼0.2 to 1 au provides insight into the formation of the SIRs and evolution of stream interfaces. The fast streams are observed to go from a velocity increase with only the slightest density pileup (i.e., event 1), which has yet to fully form into an SIR, to a more well-developed SIR (events 3 and 4), according to the bulk plasma and field observations. Furthermore, the not-yet-developed transitions from slow to fast streams show some additional variations between events. For example, event 1 (at 0.4 au) observes a density pileup region without an effective increase in the temperature and entropy of the fast stream, while event 2 (at 0.2 au) provides an example of a transition with the temperature and entropy enhancement in the fast stream but without a density pileup. One possible reason for this is that event 1 is at a larger radial distance, in which the fast stream has more time to interact with the slow wind to drive the density pileup (e.g., Hundhausen 1973; Richter & Luttrell 1986); however, other processes may contribute to the temperature and entropy variations.
Additionally, comparing the suprathermal intensity of SIRs over a broad range of radial distances may provide insight into local energization. For example, the closest developed SIR, which was observed near 0.30 au (Figure 11, left), has an increase in suprathermal particles centered on the interface, while the SIR near 0.55 au (Figure 14, left) has about the same peak EPI-Lo count rate but a slightly broader distribution. This seems to suggest that the SIR is continuing to accelerate ions into the suprathermal range as it propagates away from the Sun, pointing to a local acceleration process. Additionally, comparing to typical SIR observations at 1 au, of which STEREO-A in Figure 11 (right) is a good example, the suprathermal population appears to expand preferentially into the fast stream direction. However, it should be noted that the suprathermal ions are not always observed at 1 au when the spacecraft is immersed in the fast solar wind stream (see, for example, right panel of Figure 12 and Figure 14), and suprathermal ions are not always observed closer to the Sun (for example, event 1 at 0.4 au and event 2 at 0.2 au). As such, weakly formed SIRs at 1 au may be similar in their properties to SIRs newly formed close to the Sun.
One possible interpretation is that the suprathermal ion component starts undergoing local acceleration at the stream interface through various non-shock-related processes (e.g., Schwadron et al. 1996; Ebert et al. 2012; Chen et al. 2015; Filwett et al. 2017, 2019) but is confined near this acceleration region in the inner heliosphere. By 0.5 au, the energetic component begins to broaden into the fast stream (Figure 14, left), and then at 1 au (Figure 11, right), the suprathermal particle enhancement stretches into the fast stream solar wind for over a day.
As for energetic populations that propagate toward the Sun from further out in the heliosphere, such as at SIR-associated shocks, these particles would likely extend into higher energies than those analyzed in this study (e.g., Ebert et al. 2012; Filwett et al. 2019) and may be skewed to further within the fast stream rather than at the interface. For example, the broader increase in the EPI-Lo count rate on November 16 after the SIR (Figure 11, left) could be related to more energetic populations that are magnetically connected to the SIR further out in the heliosphere and able to propagate back to the inner heliosphere (e.g., Mewaldt et al. 1978; Fisk & Lee 1980; Roelof 2000). This November 16 enhancement is also seen at higher energies in EPI-Hi, which is discussed in much further detail in Cohen et al. (2019), while EPI-Hi does not observe the November 15 enhancement.
Regarding the energy of locally accelerated ions versus those accelerated further out in the heliosphere, Filwett et al. (2019) found that while MeV ions may propagate along field lines to the inner heliosphere, keV range ions may instead be from local acceleration. This may explain why keV suprathermal ions from EPI-Lo in the SIRs observed by PSP have signatures of localized enhancements centered on or very near the stream interface, while EPI-Hi observed MeV particles at times separate from the stream interface and lasting longer in time (see Cohen et al. 2019). This possibility of back-propagation of energetic particles may be the cause of the suprathermal ion enhancement seen a day after the SIR on November 15 (Figure 11, left); however, further investigation and additional SIR and fast stream events are needed to address this question, which is a topic PSP is uniquely suited to study.
Investigating the SIR "conjunction" between PSP within 0.5 au and measurements at 1 au can provide further insight into the evolution of SIRs as they propagate in the heliosphere. The best comparative example of those identified within the first orbit of PSP was the November 15 SIR observed at PSP (Figure 11, left), which was observed at STEREO-A on November 22 (Figure 11, right), as well as at ACE on November 4 (Figure 12). The WSA-ENLIL simulation for the month of November (online animation presented in Figure 4) shows the SIR arriving at all three spacecraft, both in the ecliptic plane slice and in the meridional plane slice. Comparing the three observations of this SIR (Figures 11 and 12), the transition from slow to fast stream steepens from ACE, to PSP, and then to STEREO-A, indicating a time-related steepening rather than a strict radial dependence on the structure of the slow-to-fast stream interface. Additionally, solar wind density fluctuations seen in the slow wind side of the SIR at PSP appear to have been overtaken by the SIR, as the upstream slow wind has little variability at 1 au, compared to that at 0.3 au (Figure 11). Also, as discussed before, there is a distinct difference in how localized suprathermal particle enhancements are when measured at PSP versus the broad enhancement in the fast stream at STEREO-A. However, while temporally broad, the suprathermal ion flux at ACE is less broad than at STEREO-A, less biased to the fast stream side, and more likely associated with the HCS crossing just prior to the SIR observation at ACE, rather than being related to the SIR itself. This may indicate that, as shown in the ENLIL model, the SIR was just forming when observed at ACE, while it is more fully developed when observed at STEREO-A.
Comparing the high-speed compressive stream observed at PSP around October 23 (Figure 7, left) to the corresponding SIR observed at ACE on October 26 (Figure 7, right) allows for a vantage point of the formation of an SIR along the same fast stream. While PSP observed a density enhancement prior to the fast stream, indicating the formation of a pileup region, the fast stream temperature and entropy are not observed to increase from the levels in the slow solar wind. Additionally, there is only a small pressure and magnetic field enhancement near this transition region at ∼0.43 au. This may, in fact, be the very beginning of an SIR formation, which becomes more fully developed, although weak, by 1 au (Figure 7, right).
The comparison between the SIR observed by PSP on November 26 and STEREO-A on December 1 is less conclusive. This is due to the fast stream observed at PSP likely having an excursion from a southern hemisphere equatorial coronal hole (Figures 3 and 8), leading the SIR to predominantly exist south of the ecliptic (see also the online animation presented in Figure 4). Due to the orbit of STEREO-A being ∼6.5° north of the ecliptic, it may only have skimmed the SIR. This may explain why the bulk solar wind properties are similar to a weak SIR but with little to no energetic particle response.
Viewing the SIR characteristics as a function of heliospheric distance shows that formation and development of SIRs between ∼0.2 and 1 au are not consistently or simply ordered by distance or time. For example, the first event observed by PSP (Figure 7, left) at 0.4 au points to a fast-speed stream that had formed a compression region and the beginnings of a pressure enhancement but had not yet developed into an SIR, whereas event 3 (Figure 11, left) at ∼0.3 au showed signatures of a well-developed SIR that may already have been accelerating particles into the suprathermal energy range, despite both events having similar differentials in flow speed from the slow-to-fast wind. This illustrates the limitations of applying simple hydrodynamic assumptions when modeling the formation and evolution of SIRs (e.g., Hundhausen 1973), as well as the limitations of superposed epoch analysis of SIRs binned solely by radial distance (e.g., Richter & Luttrell 1986), as the transition from a slow-to-fast stream interface to an SIR is highly variable.
It should be noted that the four fast streams observed during the first orbit of PSP are relatively weak but typical for solar minimum. Studying SIRs at 1 au from 1995 through 2016, Jian et al. (2019) showed that the nominal peak pressure and magnetic field strength of an SIR during solar minimum (maximum) are ∼0.15 (∼0.2) nPa and ∼13 (∼17) nT. Converting the PSP observed peak pressures and magnetic field strengths to those at 1 au (i.e., using n ∝ 1/r2, B (t, n) ∝ 1/r, and B(r) ∝ 1/r2), events 3 and 4 reach peak pressures of 0.12 and 0.10 nPa and peak magnetic field strengths of 14 and 13 nT, respectively. This calculation acts as an upper envelope, since the solar wind temperature was not changed, which may lead to an overestimation of the pressure. This demonstrates that these are weak SIR events compared to the majority of SIRs throughout the solar cycle, even for solar minimum. When these high-speed streams are observed later at 1 au, they are below the typical values, i.e., event 1 at L1 (Figure 7, right), event 3 at STEREO-A (Figure 11, right), and event 4 at STEREO-A (Figure 14, right), with the exception of event 3 observed at L1 (Figure 12). Future orbits of PSP will allow for the study of stronger SIRs/CIRs, which will provide interesting comparisons to these weaker events.
5. Conclusions
We investigated four fast-speed streams, two of which were associated with developing or developed SIRs and one compression region, observed during the first orbit of PSP. These events were compared with simulations from WSA-ENLIL driven by both GONG and GONG-ADAPT inputs, as well as observations at 1 au from STEREO-A and ACE/Wind. Our conclusions are as follows.
- 1.The WSA-ENLIL simulation results accurately capture the macro-scale variations in the solar wind in the inner heliosphere through the first PSP orbit. However, the timing of stream encounters can be off by a few days.
- 2.
- 3.The enhancement of suprathermal particles (30–586 keV) associated with SIRs is confined to near and centered on the stream interface at 0.3 au (event 3; Figure 11, left) and becomes increasingly broad and shifted toward the fast stream side with increasing radial distance, e.g., slightly fast streamward broadening at 0.5 au (event 13; Figure 14, left). At 1 au, when suprathermal particles are observed, the suprathermal (84.1–496.4 keV) enhancement starts at the interface and lasts for over a day into the fast stream (event 3; Figure 11, right), which has been observed in other studies (e.g., Richardson 2018, and references therein).
- 4.The confinement of the suprathermal particles to the stream interface suggests that these particles are locally accelerated, while the more energetic particles near SIRs but not at the stream interface (see Cohen et al. 2019; Desai et al. 2019) are instead accelerated at greater radial distances before propagating back to the inner heliosphere.
Future studies will focus on better characterizing the energization of ions into the suprathermal range as a function of radial distance as PSP executes more orbits around the Sun. Additionally, future studies will aim at better understanding and disentangling the processes contributing to locally accelerating ions into the suprathermal range from those that may be propagating sunward from SIR-associated shocks in the outer heliosphere.
This work was supported under NASA contract NNN06AA01C. The ACE data are publicly available at the ACE mission website: http://www.srl.caltech.edu/ACE/. The STEREO SEPT data are available at http://www2.physik.uni-kiel.de/stereo/data/sept/, and STEREO magnetic field and plasma data can be found at the STEREO Science Center: https://stereo-ssc.nascom.nasa.gov. Wind data are available at https://cdaweb.gsfc.nasa.gov/. The authors would like to thank the Parker Solar Probe instrument teams for the years of work and preparation needed to allow for the new and exciting studies in this special issue and those that will be appearing for years to come. S.D.B. acknowledges the support of the Leverhulme Trust Visiting Professorship program. This work utilizes data produced collaboratively between the Air Force Research Laboratory (AFRL) and the National Solar Observatory. The ADAPT model development is supported by AFRL.