


Abstract
The China Seismo-Electromagnetic Satellite (CSES) aims to monitor electromagnetic, particle, and plasma perturbations in the iono-magnetosphere and inner Van Allen radiation belts originated by electromagnetic sources external and internal to the geomagnetic cavity, cosmic rays, and solar events. In particular, the objective of the space mission is to investigate lithosphere–atmosphere–ionosphere coupling mechanisms (including the effects of lightning, earthquakes, volcanoes, and artificial electromagnetic emissions) that induce perturbations of the top side of the ionosphere and lower boundary of the radiation belts. To this purpose, the mission has been conceived to take advantage of a multi-instrument payload comprising nine detectors for the measurement of electromagnetic field components, plasma parameters, and energetic particles, as well as X-ray flux. The Italian team participating in the CSES mission has built one of these devices, the High-Energy Particle Detector (HEPD), for high-precision observations of electrons, protons, and light nuclei. During its trip along the orbit, and thanks to the large set of detectors operated on board, CSES completely monitors the Earth, acting as an excellent instrument for space weather. The satellite was launched on 2018 February 2, with an expected life span of 5 yr. This article describes the CSES mission with a particular focus on the HEPD apparatus and its in-flight performance.
Export citation and abstract BibTeX RIS
1. Introduction
The lithosphere–ionosphere–magnetosphere coupling is a complex topic due to a number of physical effects and interactions that occur between the Earth's surface and magnetosphere. Such interacting phenomena are mostly caused by natural events, tropospheric activity (e.g., lightning and volcanoes), and anthropogenic electromagnetic emissions. In addition, electromagnetic disturbances associated with seismic activity can induce ionospheric perturbations and possible precipitation of particles from the inner Van Allen belts. On the external side, the Sun causes regular and irregular variations of the geomagnetic parameters (by means of impulsive events, such as coronal mass ejections (CMEs) and solar flares) and modulates the cosmic-ray flux.
The China Seismo-Electromagnetic Satellite (CSES), launched from the Jiuquan Satellite Launch Center in the Gobi Desert (Inner Mongolia) on 2018 February 2 with a suite of advanced detectors, aims to shed new light on the spatial and temporal stability of the ionosphere–magnetosphere transition zone and investigate disturbances induced by internal and external electromagnetic sources. The CSES is part of a collaboration program between the China National Space Administration (CNSA) and the Italian Space Agency (ASI; Shen et al. 2018). The mission has been developed by the China Earthquake Administration (CEA) and the Italian National Institute for Nuclear Physics (INFN) and includes several Chinese, Italian, and Austrian universities and research institutes. The CSES is the first element of a multisatellite monitoring system, including several missions scheduled for the next few years, designed to investigate the top side of the ionosphere by means of the most advanced techniques and equipment and able to gather worldwide data of the near-Earth electromagnetic environment.
The CSES mission is monitoring solar impulsive activity, such as solar energetic particle (SEP) emission and cosmic-ray solar modulation, by detection of proton and electron fluxes from a few to hundreds of MeV. These measurements will provide an extension of particle spectra down to very low energies in the ongoing 24th solar cycle, currently monitored at higher energies by experiments such as PAMELA (Adriani et al. 2017) and AMS-02 (Aguilar et al. 2013). The CSES data will help analyze the temporal correlation between seismic events and the occurrence of both electromagnetic perturbations in the upper ionosphere and Van Allen particle precipitations, thus joining the mainstream of studies about lithosphere–atmosphere–ionosphere coupling mechanisms.
Early results on this topic were obtained by analyzing data from both ground and space experiments mainly focusing on cosmic-ray observations not specifically conceived for the investigation of seismo-electromagnetic phenomena. More recently, the robust development of small, low Earth orbit (LEO) satellites such as CSES is facilitating the study of seismo-associated electromagnetic phenomena by means of in situ measurements of the induced ionospheric anomalies. Detection of Electro-Magnetic Emissions Transmitted from Earthquake Regions (DEMETER; Cussac et al. 2006; Lagoutte et al. 2006), a French microsatellite placed in a polar orbit at 700 km and relying on a set of payloads designed for multiparametric measurements, has been the first mission specifically designed for this kind of investigation. The CSES mission is planned to drive the pioneering experience of DEMETER forward through the collection of a long time series of data, which will help discern ionospheric disturbances caused by natural terrestrial events, such as earthquakes and volcanic eruptions, from the background induced by solar activity and anthropogenic sources. Moreover, the newborn CSES data center will contribute to providing the international scientific community with a multiparameter observation sharing service.
The Italian contribution to the mission includes the design and construction of the High-Energy Particle Detector (HEPD), which is devised to detect electrons in the energy range between 3 and 100 MeV and protons between 30 and 200 MeV, as well as light nuclei (Ambrosi et al. 2018). The Space Research Institute (IWF) of the Austrian Academy of Sciences (ÖAW) and the Institute of Experimental Physics (IEP) of the Graz University of Technology contribute to one of the magnetometers of the mission.
The article is organized as follows. In Section 2 an overview of the CSES mission is presented, while in Section 3 we discuss the scientific objectives of the mission, with special emphasis on those specific to the HEPD. Section 4 is dedicated to the description of the HEPD. Section 5 describes the HEPD qualification tests, including tests with particle beams. In Section 6 we report details regarding the data ground segment of the HEPD instrument. Finally, Section 7 is devoted to the presentation of the in-orbit performance of the HEPD after 1 yr of flight. We draw our conclusions in Section 8. Technical details about the HEPD instruments and electronics are reported in the Appendix.
2. CSES Mission Overview
The CSES, based on the Chinese three-axis stabilized CAST2000 platform, moves along a Sun-synchronous orbit at 507 km of altitude, with a 97° inclination and a periodic 5 day ground track. In launch configuration, the CSES main body has dimensions 145 cm (Y) × 144 cm (Z) × 143 cm (X) (see Figure 1), which increase after the deployment of the solar panel and booms.
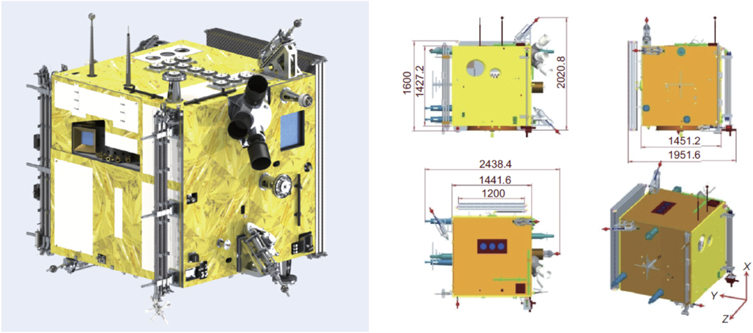
Figure 1. Layout of the CSES with stowed solar panel and booms.
Download figure:
Standard image High-resolution imageThe satellite includes several platform subsystems, such as attitude and orbit control (AOC); onboard data handling (OBDH); tracking, telemetry, and command (TTC); power supply (composed of an 80Ah Li-ion battery and solar panels); and thermal control subsystems. Table 1 summarizes the main specifications of CSES.
Table 1. Main Specifications and Orbit Parameters of the CSES
| Platform | Mass | ≃700 kg |
| Orbit | Type | Sun-synchronous |
| Altitude | 507 km | |
| Inclination | 97° | |
| Period | 94 minutes | |
| Local time descending node | 14:00 | |
| Revisit period | 5 days | |
| Data transmission | Band | X |
| Downlink rate | 120 Mbps | |
| Mass memory size | 160 Gbit | |
| TMTC/OBDH | Uplink rate | 2000 bps |
| Downlink rate | 16384 bps | |
| AOCS | Pointing accuracy | ≤0 1 (three-axis, 3σ) 1 (three-axis, 3σ) |
| Knowledge accuracy | ≤003 (three-axis, 3σ) |
|
| Stabilization accuracy | ≤0001 s–1 (three-axis, 3σ) |
|
| Life span | ≥5 yr |
Download table as: ASCIITypeset image
The AOC makes use of Earth-oriented three-axis stabilization; attitude sensors (three star trackers, two groups of gyros, and one digital Sun sensor) are used to measure the attitude, reaction wheel, and magnetic torque in order to maintain the zero-momentum control. To reduce any interference on the scientific payloads from solar panel rotation or AOC adjustments, the satellite selects two working regions: (1) the payload working zone at latitudes between −65° and +65° and (2) the platform adjustment zone at latitudes >+65° or <−65°, where the payloads stop working. When in orbit, the X-axis of the satellite is oriented according to the velocity vector, while the Z-axis points to the nadir. The solar panel located on one side of the satellite can be rotated around the Y-axis at latitudes >+65° and <−65° in order to optimize the satellite power budget.
2.1. Onboard Scientific Payloads
The CSES hosts the following scientific payloads:
- 1.a high-precision magnetometer (HPM), including a coupled dark-state scalar magnetometer and a fluxgate magnetometer, for measuring the low-frequency range, intensity, and three components of the magnetic field, respectively;
- 2.a search-coil magnetometer for measuring the three components of the magnetic field at higher frequency;
- 3.an electric field detector (EFD), including four probes installed on as many booms, aimed at the measurement of the three components of the electric field;
- 4.two instruments for plasma investigation, i.e., a plasma analyzer package (PAP) and a Langmuir probe (LP), in order to observe ion and electron density and temperature, ion drift velocity, and plasma composition;
- 5.a GNSS occultation receiver and a three-frequency (VHF/UHF) beacon transmitter for studying the ionospheric plasma profile; and
- 6.two particle detectors, the Chinese High-Energy Particle Package (HEPP) and the Italian HEPD, for measuring high-energy charged particles and X-ray flux.
Figure 2 shows the position of the payloads on board CSES.
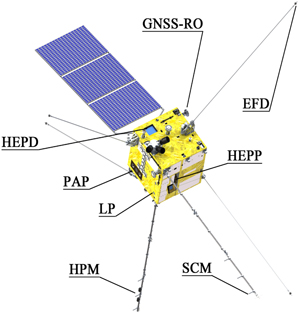
Figure 2. Position of the instruments on board CSES. The satellite is in orbit configuration, as shown by the deployed solar panel and booms.
Download figure:
Standard image High-resolution image3. Scientific Goals of the CSES Mission
The CSES mission has been designed to achieve two main scientific objectives: (1) to improve knowledge of the near-Earth electromagnetic environment (specifically, the lithosphere—atmosphere—ionosphere coupling mechanisms, as well as the anthropogenic impact on the ionosphere) and (2) to better understand some phenomena of solar–terrestrial interactions and cosmic rays in the space weather context.
Near-Earth electromagnetic, plasma, and particle environments are affected by broadband electromagnetic emission due to lightning, whistlers, transient luminous events, and other phenomena connected to tropospheric activity, anthropogenic sources (such as very low frequency (VLF) navigation and communication transmitters, broadcasting stations, power-line harmonic radiation, etc.), and seismic and volcanic activity. Earthquakes are among the most dangerous natural disasters. Very strong earthquakes occur approximately 20 times a year over the globe. An earthquake is a deformation-, fracture-, structure- and phase-transformation event that suddenly releases a large amount of the elastic energy stored in the medium (Earth's lithosphere) and is accompanied by a substantial fraction of energy radiated as seismic waves.
In the preparation phase of seismic events, some seismo-electromagnetic perturbations have been observed on the ground and in space. Models proposed to describe their generation mechanisms invoke physical effects such as piezoelectricity, piezomagnetism, and electrokinetic processes. During their propagation through the crust, the higher frequencies of seismo-associated disturbances are attenuated, and only the low-frequency components up to VLFs are supposed to reach the Earth's surface and propagate further into the near-Earth space (see, e.g., Molchanov & Hayakawa 1998; Biagi et al. 2008; Hayakawa et al. 2010; Popova et al. 2018). The interaction of these electromagnetic emissions with the ionospheric environment can cause different kinds of direct and indirect perturbations in the plasma component, as well as in the electromagnetic field and particles trapped in the Van Allen radiation belts.
Some LEO satellite observations seem to confirm the above scenario. Pre-seismic changes in the electric and magnetic fields (Molchanov et al. 1993; Parrot 1994, 1995), temperature, and density of the ionospheric plasma (Parrot & Mogilevsky 1989; Chmyrev et al. 1997; Yiyan et al. 2013) have been observed from a few minutes to several hours (2–6 hr) prior to earthquakes of moderate or strong magnitude. The most reliable results have been obtained by the analysis of DEMETER data, which include observations of some ionospheric perturbations related to earthquakes (Bertello et al. 2018). Particularly relevant is the finding of an electromagnetic emission with a peculiar frequency of 333 Hz 2 days before the 6.3 Mw earthquake of L'Aquila in 2009.
The second main objective of the CSES mission is to improve our knowledge of the solar–terrestrial interaction and cosmic-ray physics. Earth's geomagnetic cavity is a dynamic system generated by the effect of the solar wind and geomagnetic field and structured in several macro-regions, such as the ionosphere, magnetosphere, and Van Allen belts. They are affected by stationary and transient variations of their spatial and temporal composition and extension on local and global scales. The CSES follows many other missions, such as SAMPEX, THEMIS, LANL-GEO, and GOES, aimed at investigating the composition of the Van Allen belts and the radiation-belt transport, acceleration, and loss mechanisms. Other missions, such as PAMELA and AMS-02, are investigating cosmic-ray physics. The CSES is flying at altitudes comparable to or lower than the ones spanned by the other abovementioned missions and can detect particles in an intermediate energy range between those spanned by missions devoted to investigating radiation belts and those conceived for studying cosmic rays. In Figure 3, a comparison between PAMELA galactic protons and electrons is shown, with the energy window of CSES/HEPD superimposed. This allows CSES to complement and integrate data from other missions. Specific goals will be described in detail in the following paragraphs.

Figure 3. Comparison between PAMELA protons (upper panel) and electrons (bottom panel). Data from Adriani et al. (2013) and Adriani et al. (2015a), respectively. Blue boxes refer to the energy range of CSES/HEPD.
Download figure:
Standard image High-resolution image3.1. Specific Goals of the HEPD
In the framework of the CSES mission, HEPD has been built in order to increase our understanding of cosmic rays, improve knowledge of some magnetospheric processes, investigate the spatial and temporal stability of the inner Van Allen belts, and study the impact of natural electromagnetic emissions (in particular, those due to seismic and volcanic activity) on the iono-magnetosphere transition zone.
3.1.1. Cosmic-Ray and Solar Studies
For long-term space missions like CSES, the measurement of cosmic-ray particles needs to be related to the ever-changing environment in which the detector operates. The heliosphere, i.e., the region shaped by the presence of the solar wind flowing from the upper atmosphere of the Sun (the corona), presents different levels of variability, some of them still poorly understood. These changes in the solar wind parameters (i.e., density, flow velocity, temperature, etc.) lead to the appearance of dynamic phenomena on many spatial and temporal scales (Balogh et al. 2008).
From launch to the scheduled end of the mission, HEPD will be operative during the very last part of solar cycle 24 and the subsequent minimum of cycle 25, offering ideal conditions to study the mechanisms of propagation of cosmic rays inside the heliosphere. Such a quiet environment, in fact, could help obtain an undisturbed description of all four major acceleration/transport factors in the Parker equation (Parker 1965): convection, particle drift (caused by gradients and curvatures in the heliospheric magnetic field), diffusion, and adiabatic energy changes.
On such long timescales, the observation of electron and proton energy spectra, as well as their variations during one or more solar cycles (solar modulation), will be extremely helpful to understand the hierarchy of the processes that dominate the propagation of particles in the magnetized plasma. For example, many drift models (Potgieter 2014) predict a clear charge-sign dependence for the modulation of cosmic rays, increasing the importance of electron/proton joint measurements with high precision and statistics. Other models predict that the diffusion coefficients may depend on energy in a much stronger way that previously expected. The role of these observations could gain further value, should the 25th solar minimum be unusual like the 23rd, thus offering a unique chance to study such mechanisms in an unconventional situation. Low-energy data from HEPD could also be used to produce a full three-dimensional model (Potgieter et al. 2014) based on the numerical solution of the Parker equation.
Solar modulation aside, every solar cycle presents a wide variety of shorter-timescale transients coming from the Sun, called solar particle events (SPEs). These events, which produce bursts of high-energy particles (SEPs), are rare during the minimum phase of solar activity, but the acceleration and propagation of such particles can be studied with lower uncertainty, usually caused by a turbulent heliosphere (which is typical of phases of maximum solar activity). The powerful X-class event of 2006 December 6 (Struminsky & Zimovetz 2010), together with the ground-level enhancement (GLE) of 2006 December 13–14, represents a perfect example (Adriani et al. 2011).
During maximum activity, SEPs become more frequent, and a wide variety of data can be accumulated and compared, grouping different events according to some of their features (duration, spectral index, rollover energy, intensity, region of occurrence, etc.). Expected to be a >5 yr mission, CSES could hopefully register a large number of solar events in a range of energy (3–100 MeV for electrons and 30–200 MeV for protons) that lies between the in situ observations by instruments like ACE, STEREO, GOES, etc. (Lario et al. 2013) and the high-energy data from neutron monitors on the ground (Storini et al. 2005), thus filling the void left by PAMELA (Adriani et al. 2015b, 2017).
The >30 MeV threshold for protons, together with the spanning of latitudes between ±65°, allows for particle detection in regions where the geomagnetic cutoff is considerably low, and even energetic particles from weak solar events can be measured.
The long period of data-taking will permit the collection of information about different categories of solar events, for example, giving an answer to the question of whether GLE and non-GLE events are just a different manifestation of the same mechanism with different energy or two completely separate classes of events. The study of the relation between the spectral index and rollover energy of a solar event could also shed light on the acceleration process that took place. Indeed, whether the Sun accelerates particles at low altitudes through magnetic reconnection or at higher regions of the corona through CME-driven shocks is still a matter of study, given the complexity of the modifications induced by propagation phenomena across interplanetary space (Mathews & Venkatesan 1990). Concerning electrons, they are accelerated and released during large, gradual SEP events, reaching energies of tens of MeV (Haggerty & Roelof 2009). Anyway, they are not directly measurable because of the concurring contribution of the small fraction escaping the corona and bremsstrahlung-loss phenomena, combined with the distance from the source.
Medium-term transients, such as Forbush decreases (Forbush 1958), which are caused by a CME hitting Earth and shielding galactic particles that come from outside the magnetosphere, is another possible topic of interest. Large CMEs heavily affect the geomagnetic cutoff (Adriani et al. 2016), shrinking the portion of the magnetosphere that faces the Sun and allowing more particles to precipitate at lower latitudes. The HEPD energy range is well suited to follow the evolution of such decreases, giving information about the magnitude of the decrease itself and the recovery time of the galactic particles to normal conditions.
Scientific goals aside, the CSES mission fits in a period when the issues concerning space weather are being recognized as urgent, thus earning a chance to serve as a space monitor of the vicinity of the Earth and help develop further counteractions against possible dangerous solar phenomena.
3.1.2. Stability of the Van Allen Belts
The Van Allen belts are zones of energetic charged particles that are trapped in the Earth's magnetic field. There are two such belts (inner and outer) that extend from an altitude of about 1000 km up to about 65,000 km above the Earth's surface. They are mainly composed of energetic electrons (1 MeV < E < 50 MeV) and protons (10 MeV < E < 1 GeV). The motion of trapped particles is assumed to be a superposition of three periodic motions: a gyration around the local magnetic field lines, a bouncing along field lines between conjugate mirror points in the northern and southern magnetic hemispheres, and a longitudinal drift around the Earth (see Figure 4). The mirror points are the positions for which the (pitch) angle between the particle-velocity vector and the magnetic field line takes the value 90°. At the mirror points, the particle's velocity component parallel to the magnetic field reaches zero, and the particle reverses its motion. However, if the mirror point is located below the top of the atmosphere, the particle can be scattered by residual atoms of rarefied air, lose energy, and get lost.

Figure 4. Schematic representation of the particle trapped by the geomagnetic field: geomagnetic field lines (black dashed lines), gyromotion of trapped particles along the geomagnetic field lines (cyan–magenta curly line), bouncing between the conjugate points (red–yellow line), west–east (east–west) longitudinal drift of the negative (positive) particles (green–blue line), lower boundary of the inner radiation belt (dotted–dashed blue line), ionosphere (green halo), and low-altitude satellite orbit (gray dashed line).
Download figure:
Standard image High-resolution imageThe outer and inner Van Allen radiation belts are extremely variable in composition, especially when powerful SEPs encounter the magnetic field lines (Adriani et al. 2016; Piersanti et al. 2017). These kinds of interactions (Van Allen & Gangnes 1950) between cosmic radiation and the magnetosphere generate a set of particles called albedo (upward direction), which can be further identified either as re-entrant (if their trajectory is bent by the geomagnetic field, allowing them to remain trapped with a downward direction) or splash albedo (if they are able to escape the magnetosphere; Treiman 1953). The former family comprises quasi-trapped and untrapped particles, depending on whether or not they are confined in the equatorial region below the inner Van Allen belt (Moritz 1972; Alcaraz et al. 2000), respectively.
New and accurate measurements of the high-energy (>70 MeV) cosmic radiation at LEOs have been reported in (Adriani et al. 2015c) as a function of energy and angle between the magnetic field and the direction of the incoming particle. Returning the incident particle direction, the HEPD instrument could measure, with the additional contribution from the ephemeris of the spacecraft and a tracing program based on numerical integration methods (Smart et al. 2000; Smart & Shea 2005), albedo re-entrant protons up to ∼200 MeV and provide material for comparison with previous experiments.
Furthermore, the geomagnetic field includes a peculiar region, the South Atlantic Anomaly (SAA), centered in eastern South America. The SAA (Kurnosova et al. 1962) is a region of lower geomagnetic field that causes the mirroring of the inner radiation belt particles at lower altitudes, increasing the local particle flux. It is thus the region where the inner radiation belt makes its closest approach to the Earth's surface (∼200 km).
As the modeling of this low-altitude radiation environment is still incomplete, HEPD could bring new information by carrying on observations started with the PAMELA mission (>70 MeV for protons between 2006 and 2009; Adriani et al. 2015d) in a different period and extending the calculation to lower energies.
The CSES mission can have a crucial role in the investigation of the acceleration mechanisms, the global distribution, and the variability of trapped particles in the Van Allen belts thanks to the multi-instrument payloads on board, which allow simultaneous measuring of the electromagnetic field (HPM and EFD instruments; Diego et al. 2017a; Cheng et al. 2018), particles, and plasma (PAP and LP; Diego et al. 2017b). Indeed, it is well known that the geomagnetic field changes under geomagnetic active conditions, giving rise to a redistribution of radiation-belt particles on both spatial and temporal scales.
The simultaneous and continuous monitoring of particle fluxes, electromagnetic fields, and plasma composition is a requirement to determine how and where waves control the radiation-belt dynamics. Even though the largest changes in the geomagnetic field are due to the ring-current variation during a geomagnetic storm (Kintner 2002; Jordanova et al. 2006; Zaharia et al. 2006; Piersanti & Villante 2016), resonant wave–particle interactions also strongly affect belt electrons. Indeed, the chorus can both accelerate relativistic electrons and make them precipitate, while the plasmaspheric hiss can control the location and dynamics of the "slot" region (Vellante et al. 2014a, 2014b). In this context, the HEPD payload on board the CSES ensures the highest-quality measurement of charged particles below the inner Van Allen belts at energies intermediate between those detected by the Radiation Belt Storm Probes—Energetic Particle, Composition, and Thermal Plasma (RBSP-ECT) suite of the Van Allen Probes mission and the energies of the PAMELA and AMS-02 missions. Therefore, HEPD data can extend and complement the observations from Van Allen Probes, as well as those performed by PAMELA and AMS-02.
In addition, HEPD data can be used to study electromagnetic ion cyclotron emission (Omura et al. 2010, and references therein). Ion cyclotron instability driven by the anisotropic distribution of ring-current energetic ions during magnetic storms can generate extremely low-frequency (ELF) waves in the equatorial region (Lorentzen et al. 2000; Meredith et al. 2003; Summers & Thorne 2003). These emissions can be observed at CSES altitudes by onboard electromagnetic instruments in the ELF range (from fractions of kHz up to a few kHz) and analyzed in order to clarify their physical mechanisms.
3.1.3. Investigation of the Coupling between Seismicity and Van Allen Local Instability
Anomalous fluxes of particles have been detected by some space experiments a few hours before the occurrence of earthquakes (Battiston & Vitale 2013). These short-term particle bursts have been interpreted as due to the precipitation of particles from the inner belt as a result of interactions between seismo-electromagnetic emissions and Van Allen radiation-belt particles. Of course, seismicity is not the only possible explanation for particle bursts.
A possible interaction mechanism is the resonance between seismo-electromagnetic waves and particles with a bouncing frequency in the same band (e.g., between ultralow-frequency (ULF) waves and electrons of energy >1 MeV or protons of energy of the order of some tens of MeV). When the wave frequency matches the particle bouncing frequency, the particle experiences the wave electric field E at every passage over the perturbed zone. This could produce a variation in the particle pitch angle, a lowering of its mirror points, and the possible precipitation of the affected particle (Aleshina et al. 1992). Due to the standard longitudinal drift, the precipitating particles also continue to drift around the Earth along the same unperturbed L-shell17 where the interaction occurred, thus creating a particle wave that propagates around the Earth, with electrons drifting eastward and protons drifting westward. This wave gets slowly damped due to energy losses in the residual atmosphere and spreads in space due to the dispersion of particle angular velocity. Due to the drift of trapped particles around the Earth, any particle burst of seismic origin can be observed not only above the epicenter but also at any longitude where the satellite crosses the disturbed L-shell. Therefore, if the seismic nature of particle bursts were confirmed and their statistical significance assessed, these three factors (i.e., the particle drift in the same L-shell, the temporal behavior of the damped particle wave, and the opposite drifts of electrons and protons) would, in principle, allow one to reconstruct the geographic zone of the incipient earthquake.
It is worth remarking that on-the-ground and iono-magnetospheric electromagnetic perturbations possibly induced by seismicity must be carefully distinguished from the large background caused by geomagnetic natural fluctuations and electromagnetic emissions of anthropogenic origin. To this purpose, on the one hand, data collected during geomagnetic perturbed periods (selected by means of geomagnetic indices such as Kp, Dst, Ap, etc.) cannot be used for statistical analysis. On the other hand, ground-based signals from radio navigation and communication VLF transmitters can interact with trapped particles around the geomagnetic equator, and powerful transmitters of high-frequency broadcasting stations can induce ionospheric heating phenomena due to changes in the local temperature and density of plasma components. Finally, tropospheric electromagnetic emission due to lightning and whistlers can generate characteristic electromagnetic phenomena in the top side of the ionosphere. In these circumstances, the data cannot be used for statistical analyses.
The measurement of high-energy charged particle fluxes has been obtained on board various spacecraft, including the Mir orbital station (20 MeV < Ee < 200 MeV), METEOR-3 (Ee ≤ 30 MeV), and GAMMA (Ee ≥ 50 MeV and Ee ≤ 15 MeV) by means of different instruments. Such fluxes have been processed and analyzed in order to search for temporal and spatial correlation between particle bursts and strong earthquakes (Aleshina et al. 1992; Aleksandrin et al. 2003; Sgrigna et al. 2005). In the analyses, sharp short-term increases of particle count rates, from tens of seconds to a few minutes, were identified as particle bursts if their probability exceeded a given threshold cut with respect to the average value of the background.
In particular, (Aleksandrin et al. 2003) performed a multi-instrument data analysis. Figure 5 shows the temporal correlation between particle bursts and a set of earthquakes with magnitude M > 4 after selection of satellite positions at an L-shell <2 (i.e., the near-equatorial region) and exclusion of the SAA region. The value of ΔT was defined as

where TEQ and TPB are the times of occurrence of the earthquake and particle burst, respectively. The positive value of all peaks (2–5 hr) means that the particle bursts could play the role of short-term earthquake precursors. In the analysis, sharp short-term increases of particle count rates, from tens of seconds to a few minutes, were selected as particle bursts whenever the count rate exceeded the average value of the background by four standard deviations. Aleksandrin et al. (2003) also investigated the spatial correlation between bursts and earthquakes by monitoring the variation of temporal distributions using

as an additional parameter. Here LEQ is the L-shell of the earthquake (i.e., the L-coordinate of the point at a certain altitude above the epicenter, which coincides with the altitude of the region by which the electromagnetic emission of seismic origin is captured in the geomagnetic field lines), and LPB is the L-shell of the satellite corresponding to the particle burst. The analysis shows that ΔT distributions present no peaks when ΔL > 0.5; i.e., the L-shell of the earthquake significantly differs from that of the particle bursts, which is a result in support of a correlation between particle precipitation and earthquakes.

Figure 5. Histograms of time difference ΔT between the time of selected earthquakes and that of particle bursts obtained by the MARIA, ELECTRON, GAMMA-1, and SAMPEX space missions. A positive value of the peak suggests that particle bursts precede earthquakes in time. Plots are from Aleksandrin et al. (2003).
Download figure:
Standard image High-resolution imageMoreover, recent studies of low-energy electrons (E > 0.3 MeV) collected by the NOAA Polar Operational Environmental Satellites (POES) over 13 yr (Battiston & Vitale 2013) found a statistical temporal correlation between the occurrence of pairs of particle bursts and earthquakes of magnitude M > 5.
Starting from these premises, the HEPD detector has also been designed to investigate correlations between particle bursts and seismic activity. Indeed, the device has been conceived to detect electrons and protons in the energy range of interest, with wide angular acceptance (about 1 sr over the full energy range) and large geometry factors up to 300 cm2 sr at the peak, that is, at least 100 times larger than the geometric acceptance of DEMETER and at least 1000 times larger than the one of NOAA POES. The HEPD will also be able to investigate the existence of bursts of protons and light nuclei possibly correlated with major earthquakes.
Although low-frequency seismo-associated electromagnetic emissions have been observed on the ground close to earthquake epicenters and in space by several satellites before strong earthquakes, their pre-seismic nature and postulated role in the lithosphere–ionosphere coupling mechanisms is far from experimentally confirmed. Further studies on this topic are needed in order to understand the physical mechanisms of the abovementioned correlations; an earthquake forecast is not possible at present.
4. The HEPD Instrument
The HEPD, built by the Italian Limadou collaboration, is shown in Figure 6, where two schematic views of the apparatus—with lateral and top panels removed—are shown.
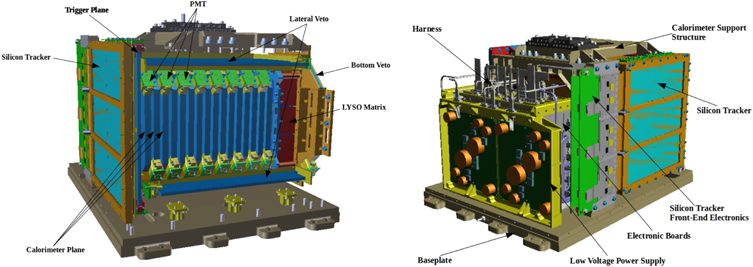
Figure 6. Schematic views of the HEPD electronics box and detecting units.
Download figure:
Standard image High-resolution imageFrom top to bottom, a particle entering the detector will cross:
- 1.a tracking system made of two planes of double-sided silicon microstrip sensors, suitable for the reconstruction of the incident particle trajectory and the measurement of the energy loss per unit length, useful for particle identification;
- 2.a trigger system consisting of one layer of plastic scintillator divided into six segments (paddles) and read out by photomultiplier tubes (PMTs), which generate an efficient trigger signal to synchronize data acquisition for the whole detector;
- 3.a range calorimeter composed of a first section that comprises 16 planes of plastic scintillator on the top and a layer of cerium-doped lutetium yttrium orthosilicate (LYSO) crystals on the bottom, suitable for the measurement of the energy deposition and range of impinging particles; and
- 4.an anticoincidence (veto) system, including five (four lateral and one bottom) plastic scintillator planes read out by PMTs, which is used to detect particles that enter the apparatus from outside the acceptance or are not fully contained within the calorimeter.
On the lateral side of the sensitive detectors, two main subsystems complete the whole instrument:
- 1.an electronic subsystem made of four boards for trigger management, data acquisition, OBDH, slow control, and low-voltage power distribution; and
- 2.a power supply subsystem composed of a board (low-voltage power supply) that generates two low-voltage power lines from the satellite power bus and a system (high-voltage power supply) that produces two high-voltage lines (up to 150 and 1200 V, respectively).
The HEPD detector is contained in an aluminum box with dimensions 40.36 × 53.00 × 38.15 cm3. The walls and baseplate are made of milled aluminum panels, with the outside surface covered by a black anodized coating in order to assure good thermal insulation. The detector, together with the power supply and electronics boxes, is fixed to the satellite cabin space, which provides the contact surface for heat dissipation. The total instrument mass is about 45 kg; the power consumption depends on the status of HEPD but is always lower than 30 W.
Technical details about the characteristics of the subdetectors of the HEPD apparatus and its electronics are reported in the Appendix.
5. HEPD Models and Qualification Tests
Following the standard space procedures, four HEPD models were produced and fully integrated into the clean rooms at INFN laboratories of Roma Tor Vergata in Rome (Italy). The electrical model (EM), including only electrical and transmission subsystems, was used to validate the wire connections between the payload and satellite. The structural and thermal model (STM), mechanically equal to the final instrument but with dummy sensors and electronics instead of real ones, was constructed to validate the structural and mechanical design, as well as thermal conductivity.
The qualification model (QM), identical to the flight detector, was used to qualify all of the subsystems by stress tests, calibrate the instrument, and assess its compliance with space requirements.
The QM underwent thermal-vacuum, pyroshock, vibration, and thermal-cycling tests from 2016 May to August. These tests took place at the SERMS Laboratory in Terni (Italy). Specifically, in 2016 June, the HEPD-QM was exposed, along its three directions, to pyrotechnic shocks with a shock frequency ranging from 600 to 4000 Hz and an acceleration up to 1000 g. In 2016 June, the QM successfully underwent sinusoidal and random vibration tests as well. Sinusoidal vibration tests were performed along the three axes in the frequency range from 20 to 100 Hz, corresponding to a 12 g acceleration.
The operational temperature requirement for HEPD is from −10°C to +35°C, and it was extensively tested in both thermal and thermal-vacuum chambers. In 2016 August, the HEPD-QM was tested in a climatic chamber at ambient pressure: 25.5 temperature cycles were run from −30°C to +50°C with a 3°C–5°C minute–1 temperature rate of change and a dwell time of ≥4 hr. The dwell time is the duration required for the detector temperature sensors to achieve stabilization. After that, about six temperature cycles were performed in a thermal-vacuum chamber between −30°C and +50°C at a pressure ≤6.66 × 10⁻³ Pa. Nine temperature sensors were placed on the detector under test, eight internally and one externally. The chamber temperature gradients were 2°C and 1°C minute–1 during the heating and cooling, respectively, and the dwell time was ≥4 hr. Each cycle is composed of different steps corresponding to different operations for HEPD, such as data acquisition, calibration, standby, or power off, in order to simulate in-flight procedures. During these operations, HEPD telemetry packets were continuously monitored to check the presence of anomalies in the detector, as well as in the scientific data. Electrical ground-support equipment (EGSE) was used to provide voltage to HEPD and send telecommands to the detector in order to change the status and configurations according to test requirements.
A space qualification campaign for the flight model (FM) followed in the period 2016 October–November. Vibration tests (Figure 7) were the first to be performed, in similar conditions (three axis, 20–100 Hz, 8 g) as for the HEPD-QM. During the thermal-cycling and -vacuum tests, fewer cycles (17.5 and 4.5, respectively) and less strong conditions (from −20°C to +45°C) were required for the HEPD-FM. No structural damage and or loss of functionality or scientific performance were observed after the instrument qualification for space operations; therefore, the HEPD-FM was shipped to the DFH Satellite Company, Ltd., in Beijing (China) in 2016 December.

Figure 7. The HEPD-FM on the shaker system at the SERMS facility in Terni (Italy) in 2016 October.
Download figure:
Standard image High-resolution imageIn 2017 January, the stand-alone functionality of the instrument was successfully tested by means of its EGSE; then it was installed on CSES at the DFH Satellite Company, as shown in Figure 8. Random vibration- and thermal-vacuum tests were successfully repeated on board CSES in 2017 February and April, respectively, while magnetic cleanliness and aging tests were accomplished in 2017 May.

Figure 8. The HEPD-FM installed on CSES at DFH Satellite Company.
Download figure:
Standard image High-resolution imageDuring the final assembly phase, and before the final delivery to China, the HEPD-FM was tested under particle beams in different laboratories. At the INFN-LNF Beam Test Facility (2016 October; Frascati, Italy) the instrument was exposed to electron beams of 30, 60, 90, and 120 MeV, while at the Trento Protontherapy Center (2016 November; Trento, Italy), proton beams of 37, 51, 70, 100, 125, 154, 202, and 228 MeV were available. In addition, the instrument was exposed to the acquisition of cosmic rays (muons) in the Tor Vergata clean rooms, Rome, Italy (2016 November–December). A very accurate calibration of the HEPD silicon tracker was performed with proton-beam test data at different energies. Figure 9 shows very good agreement between experimental points (from proton-beam data) and theoretical expectation (red line) for energy loss in a ladder of the tracker.
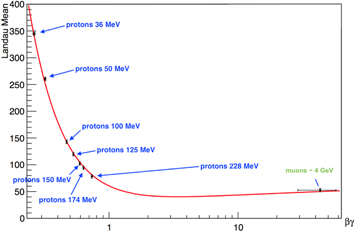
Figure 9. Calibration curve of one tracker ladder of HEPD. On the Y-axis, the mean of the Landau distribution of the energy deposited by the beam test particles at a given energy is reported. Also, one point obtained by cosmic-ray muons is shown. The red line is the theoretical Bethe curve.
Download figure:
Standard image High-resolution imageIn 2018, the HEPD-QM, once shipped back to Italy after the test campaign in China, was exposed to a beam at INFN-LNS laboratories in Catania (Italy). This additional test was aimed at further studying HEPD performance, especially for particle charges greater than Z = 1. The available beams were protons, helium, carbon, and oxygen at an energy of 62 MeV amu–1. Analysis of data acquired during the Catania beam test is still in progress.
6. HEPD Ground Segment
The HEPD data are transferred from the Chinese Ground Segment at the Institute of Crustal Dynamics of the China Earthquake Administration to a dedicated high-availability infrastructure installed at the Italian Space Agency Space Science Data Center.
High availability is achieved by duplicating the processing servers, as well as the networking layer. The storage is accessed by redundant controllers, and the FreeNAS software ensures the resilience of the data in storage. Here, processing from raw to calibrated (so-called "level2") data will be performed, and the infrastructure will also handle a bookkeeping database of the received/processed files and a quick-look database for monitoring the detector behavior. Once the data are transferred, an automatic pipeline removes the transmission frames, checks the integrity of the files, and transforms the raw data into ROOT format for further analysis.
In addition to HEPD data, level2 data from the other scientific payloads on board CSES will also be received, that is, magnetometers, the EFD, and plasma analyzers. The full level2 data set collected in this infrastructure will be distributed to other institutions involved in data analysis.
Figure 10 represents the scheme of the data pipeline from satellite to web access and storage.
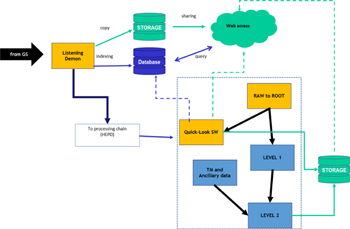
Figure 10. Scheme of data pipeline from satellite to web access and storage.
Download figure:
Standard image High-resolution imageAccording to the data policy of the CSES collaboration, the data will be public through a Chinese interface.18 As for HEPD, proton and electron counting rates integrated over 1 s intervals and in different energy bins will be available in the database, together with orbital information.
7. HEPD In-orbit Performance
The CSES was launched on 2018 February 2. On February 6, the HEPD instrument was switched on for the first time. The apparatus underwent the commissioning phase (2018 February–July), during which several onboard configurations were changed for testing purposes. Such procedures are crucial to guarantee optimal operational conditions throughout the foreseen 5 yr mission duration. In particular, in the commissioning phase, we studied the stability of the electronics—especially that of PMT calibration pedestals—as well as the thresholds for the acquisition trigger, while implementing fine-tuning of the trigger configuration as a function of in-flight particle rates.
A map of the trigger rate from 2018 May 14 to June 11, when HEPD operated in a continuous data acquisition mode and the same stable configuration, is shown in Figure 11. The condition for trigger generation is signal coincidence on the trigger plane T and the first three planes, P1, P2, and P3, of the calorimeter. The red spot around Brazil represents the SAA, in which the rate counter saturates at about 350 Hz. In the bottom panel of the same figure, the trigger rate as a function of onboard time is reported. Red peaks refer to the passages over the SAA, where the proton belt is nearer to the Earth's surface, owing to the tilting of the magnetic axis of the planet and causing the presence of the vast majority of trapped particles. On the other hand, the polar regions (marked as NP and SP in the plot) present a markedly lower rate than the SAA but higher than the equatorial portion (marked as EQ) of the Earth, since, at higher latitudes, the geomagnetic cutoff becomes smaller, thus allowing low-energy galactic particles (normally absent at lower latitudes) to contaminate the samples.
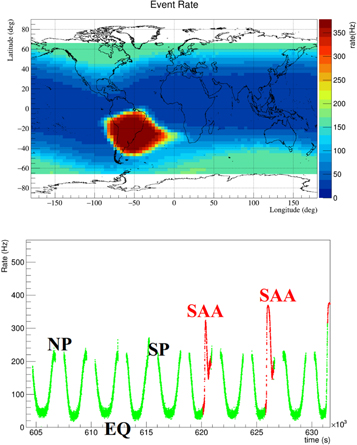
Figure 11. Top panel: HEPD average event-rate map during the period from 2018 May 14 to June 11. The red spot around Brazil represents the SAA, in which the rate counter saturates at about 350 Hz. Bottom panel: HEPD trigger rate as a function of onboard time for a few orbits. Different regions are marked.
Download figure:
Standard image High-resolution imageIn addition to event selection in accordance to any single "trigger mask" (which can be changed by the transmission of a dedicated command), the detector is also capable of counting particles that simultaneously transit across all other implemented trigger configurations by means of several counters that act independently of the original trigger mask that was chosen. These counters allow for different particle selections, indirectly limiting the energy thresholds and possibly giving an estimation of the energy dependence.
Figure 12 shows the count-rate map for
- 1.the trigger configuration T, the configuration with the lowest energy threshold, which allows one to capture low-energy particles in the outer Van Allen belt at latitudes larger than +50° and smaller than −40° (top panel);
- 2.the trigger configuration T&P1, including the trigger plane and the first calorimeter plane (middle panel); and
- 3.the trigger configuration
 , including the trigger plane and the first and last plane of the calorimeter (bottom panel).
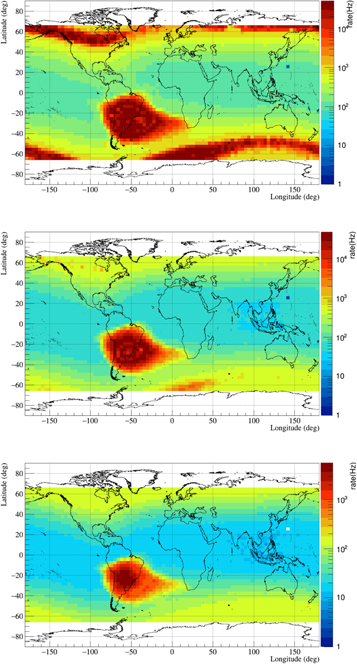
Figure 12. Top: count-rate map for HEPD trigger plane. This trigger-mask configuration is the one with the lowest energy threshold and, consequently, the most sensitive to low-energy electrons from the outer Van Allen belt (red shaded areas in the polar regions) and low-energy trapped protons in the SAA. Middle: count-rate map for the configuration including the trigger plane and the first plane of the calorimeter (T and P1). Bottom: count-rate map for the trigger configuration  .
.
Download figure:
Standard image High-resolution imageOther intermediate trigger-configuration rate meters are implemented in the detector, which could be extremely helpful in the definition of the best trigger mask to adopt on specific occasions. This could be the case for SPEs, when a low-threshold configuration could be useless due to the huge amount of triggering events involved, whereas a "deeper" configuration could prevent instrument saturation, providing a reliable detection of the solar component at the same time.
Particle identification is a rather easy task for HEPD, thanks to the large set of independent information coming from different detecting units. Figure 13 shows particle separation into protons and electrons during in-flight detection based on the information returned by the trend of the energy deposited in the first calorimeter plane (P1) as a function of that released in the full calorimeter (P1 + ... + P16).

Figure 13. In-flight proton–electron identification by HEPD: energy released in the first plane of the calorimeter (P1) as a function of that released in the full calorimeter (P1 + ... + P16).
Download figure:
Standard image High-resolution imageFigure 14 shows how HEPD can detect different particle populations according to satellite position (defined by the L-shell parameter) and energy detected; in the figure, particles trapped in both the inner (SAA) and outer Van Allen belts can be appreciated, together with cosmic rays of galactic origin. Further, HEPD periodically crosses the SAA along its orbit and can thus map its morphology by searching for trapped protons in that specific position of the geomagnetic field. Figure 15, for example, highlights the coherence between trapped-proton geographical distributions inside the SAA obtained through the SPENVIS19 model and HEPD data (2018 August), respectively.
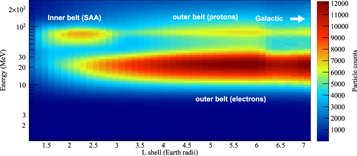
Figure 14. Different particle populations detected by HEPD as a function of L-shell and energy.
Download figure:
Standard image High-resolution image
Figure 15. Comparison between trapped-proton geographical distributions inside the SAA obtained through the AP-8 MIN model (by the SPENVIS interface) and HEPD data (2018 August), respectively.
Download figure:
Standard image High-resolution imageFinally, Figure 16 reports the HEPD preliminary galactic proton flux compared to the top-of-atmosphere (TOA) theoretical fluxes for 2009 (blue), 2014 (magenta), and 2015 (red), together with the local interstellar spectrum (LIS) spectra (green). Precisely, good candidates have been selected to be compatible with the distribution of protons appearing in Figure 13, with the additional features of (1) coming from outside the magnetosphere (this condition is fulfilled by setting a particle energy threshold two times greater than the local geomagnetic cutoff rigidity) and (2) being fully contained inside the calorimeter tower, with only one paddle hit in the trigger plane and no hit on any veto. Particular attention was paid to rejecting secondaries or events with spurious signals on more than one trigger paddle or LYSO crystal. The geometrical acceptance of the instrument has been estimated by a dedicated 4π Monte Carlo simulation of protons in the range 1 MeV–10 GeV. The flux presented in Figure 16 has to be considered preliminary, since the efficiency estimation has room for improvement, and associated errors are only statistical at the moment. Nonetheless, the flux appears consistent with the solar cycle phase occurring on CSES launch (almost at the end of the 24th solar cycle, approaching its solar minimum). Indeed, the minimum of the 23rd solar cycle occurred in 2009, whereas the maximum of the 24th took place in mid-2014. The HEPD flux is, therefore, expected to lie between those of 2009 and 2014–2015, as confirmed by Figure 16.
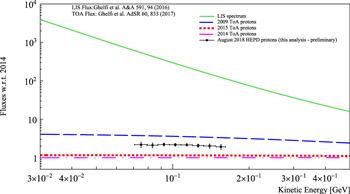
Figure 16. HEPD galactic proton flux (black squares) compared to TOA theoretical fluxes for 2009 (blue dashed line), 2014 (magenta dashed–dotted line), 2015 (red dotted line), and LIS spectrum (green solid line).
Download figure:
Standard image High-resolution image8. Conclusions
The CSES is a Chinese–Italian space mission dedicated to monitoring variations of the electromagnetic field and waves, plasma parameters, and particle fluxes induced by natural sources and artificial emitters in near-Earth space. Austrian institutions contributed to the mission too.
The CSES was launched from the Jiuquan Satellite Launch Center in the Gobi Desert (Inner Mongolia) on 2018 February 2. The expected mission lifetime amounts to 5 yr. The mission aims to study the existence of possible (temporal and spatial) correlations between the observations of iono-magnetospheric perturbations, as well as the precipitation of particles from the inner Van Allen belts and the occurrence of seismic events. However, a careful analysis is needed in order to tell measurements possibly associated with earthquakes apart from the large background generated in the geomagnetic cavity by solar activity and tropospheric electromagnetic emission.
The Italian contribution to the mission includes the design and construction of the HEPD, aimed at detecting electrons in the energy range between 3 and 100 MeV and protons between 30 and 200 MeV, as well as light nuclei in the MeV energy window.
From the launch to the end of 2018 July, CSES underwent a set of "commissioning tests," aiming to assess the good functioning of the instruments on board. All parameters were found nominal, both for the satellite and instruments, and the commissioning phase finished without remarks. As for HEPD, these months were used to find stable conditions under which to operate the instrument in flight, optimizing some working parameters.
Since 2018 August, the science run of HEPD has started. In this article, we have presented the first in-flight collection of proton and electron data: the particle rates are consistent with radiation models, as well as their distribution along the orbit.
Thanks to the HEPD acceptance energy window, its orientation with respect to the Earth's magnetic field lines, and its satellite orbit, the instrument is capable of detecting different particle populations in space: solar particles, galactic particles, particles trapped in the inner and outer radiation belts including the SAA, and albedo particles. The first scientific runs of the instrument attest to its good functioning all along the orbit and confirm that HEPD is an optimal space weather monitoring instrument.
This work was supported by the Italian Space Agency in the framework of the "Accordo Attuativo n. 2016-16-H0 Progetto Limadou Fase E/Scienza" (CUP F12F1600011005).
Appendix:
In this Appendix additional details about technical aspects of the HEPD single instruments are given, and the structure of the HEPD electronics is described.
Appendix A: The HEPD Subdetectors
A.1. The Tracker Detector
The tracking system of HEPD consists of two planes (called external and internal) of double-sided silicon microstrip detectors, located at the top of the apparatus and separated by 1 cm spacing. The signal is collected on both sides of the silicon wafer, with the implanted strips of one side orthogonal to those of the other, in order to provide a measurement of the X- and Y-coordinates of the incident ionizing particle.
In the HEPD tracker detector, each silicon plane, with dimensions 213.2 × 214.8 mm2 excluding the mechanics, is divided into three identical independent sections, called ladders, along the X-axis. Such sections are named top, central, and bottom, respectively, with the top one marked by the highest value of the X-coordinate.
Each ladder contains two silicon sensors. The dimensions of the sensors, produced by FBK,20 are 109.63 mm × 77.58 mm × 0.3 mm; the dimensions of the depleted volume (active area) are 106.63 mm × 71.58 mm × 0.3 mm. The p+ side contains 767 implantation strips with a 182 μm pitch. The ohmic side contains 1151 n+ implant strips, alternated with p+ blocking strips to minimize the effect of the surface charge present on the ohmic side. An assembled silicon tracker plane is shown in Figure 17(left).
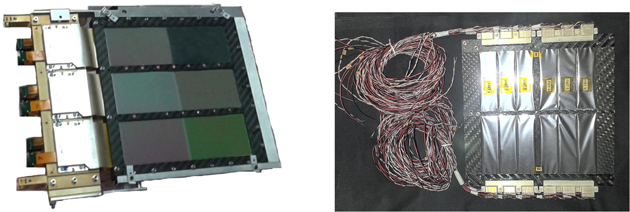
Figure 17. Left: assembled plane of silicon detecting units. Right: picture of the segmented trigger plane.
Download figure:
Standard image High-resolution imageModules are wire-bonded to each other on p+ strips, each of them read out with a dedicated channel. To save readout channels, n+ strips are grouped in three for readout, with a degeneracy (Y-direction) solved exploiting the information from the trigger plane. The readout strips are directly connected with the readout electronics by means of AC pads (i.e., a capacitor connects the strips to the readout amplifiers), while the nonreadout strips (floating strips) allow one to increase the spatial resolution, inducing signal on the adjacent readout ones via capacitive coupling.
A.2. The Trigger Plane
The trigger system is made of one thin layer of plastic scintillator (20 cm × 18 cm × 0.5 cm) divided into six segments (or paddles) with dimensions 20 cm × 3 cm × 0.5 cm, each one read by two Hamamatsu PMTs. The plane is located below the tracker system and performs the following tasks:
- 1.fast trigger-signal generation to start and synchronize data acquisition for the whole apparatus;
- 2.resolution of the ambiguity of the Y-coordinate position due to the daisy-chaining of three readout strips to the same readout channel on the ohmic side of the silicon sensors;
- 3.possible secondary determination of the ionization energy loss produced in the layer, in addition to the more precise measurement obtained by the tracker; and
- 4.possible rejection of events characterized by more than one paddle hit (multiparticle events).
To generate the trigger signal, the coincidence between a signal on at least one of the trigger paddles and the signal from at least one additional calorimeter plane is required. A picture of the trigger plane can be seen in Figure 17(right).
A.3. The Calorimeter
The range calorimeter of the HEPD detector consists of two different parts. The first one, on the top and immediately below the trigger plane, is made of 16 planes of plastic scintillator. Each plane has dimensions 15 cm × 15 cm × 1 cm and is read out by two PMTs placed at two opposite corners of the plane. The bottom part of the calorimeter consists of a 3 × 3 matrix of LYSO inorganic scintillator crystals, for a resulting plane with total dimensions 15 cm × 15 cm × 4 cm.
The mechanical stability of the system is assured by a support structure that holds the detector in place and prevents any damage during the launch phase. The scintillator counters are arranged in a vertical stack and positioned by means of a carbon-fiber frame, each one mounted on top of another, in such a way as to form a rigid tower where each counter is separated by the adjacent ones (see picture in Figure 18). Layers of relatively soft open-cell Poron, placed between the counters and the carbon fiber, prevent any stress and shock possibly transferred to the counters themselves, so as to avoid damage. The high rigidity of the system provides a great safety margin against stresses and vibration shocks.
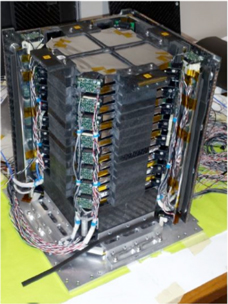
Figure 18. Picture of the assembled scintillator tower.
Download figure:
Standard image High-resolution imageThe aim of the calorimeter is the measurement of the energy deposition and range of the impinging particles. The presence of the LYSO bottom layer increases the operational energy range of the detector by means of a larger matter thickness with high density.
A.3.1. Plastic Scintillators
The scintillator material selected for all of the plastic planes (trigger, calorimeter, veto system) is the EJ-200 by Eljen Technology, which combines long optical attenuation length and fast timing. It consists of an organic polymer (polyvinyltoluene, refractive index 1.58), which is luminescent when irradiated by ionizing particles. Some properties of the EJ-200 are reported in Table 2, while Figure 19(left) shows its emission spectrum.
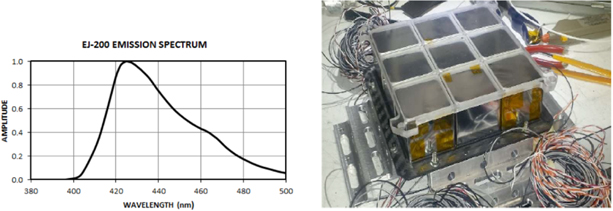
Figure 19. Left: emission spectrum of the EJ-200 plastic scintillator. Right: picture of the LYSO matrix plane.
Download figure:
Standard image High-resolution imageTable 2. Some Properties of the EJ-200 Plastic Scintillator
| Properties | EJ-200 |
|---|---|
| Light output (% anthracene) | 64 |
| Efficiency (photons/1 MeV e−) | 10 |
| λ of maximum emission (nm) | 425 |
| Light attenuation length (cm) | 380 |
| Rise time (ns) | 0.9 |
| Decay time (ns) | 2.1 |
| Density (g cm−3) | 1.023 |
| Temperature range | −20°C to 60°C |
Download table as: ASCIITypeset image
The four corners of every scintillator plane in the calorimeter have been cut in order to create room to place the PMTs. Each plane contains two PMTs placed at two opposite corners. The external walls of the planes, with the exception of the entrance windows of the PMTs, are optically insulated by means of a thick mylar foil with about a 98% reflectivity index. This foil reflects back the fraction of scintillation light that escapes the plane, thus increasing energy resolution.
A.3.2. LYSO Matrix
The bottom part of the calorimeter is made of an LYSO inorganic scintillator. This is a high-density material (d = 7.3  ) that, combined with its 4 cm thickness, allows one to increase the operational energy range of the energy detector.
The LYSO layer is formed by a 3 × 3 matrix (see Figure 19, right), where each crystal has dimensions 4.8 cm × 4.8 cm × 4 cm and is read out by a single PMT placed on the bottom side (the side opposite the trigger plane). These crystals offer the advantage of a high light output, quick decay time, and excellent energy resolution. The peak of the emission spectrum is at 428 nm; this makes possible the use of the same PMTs adopted for the plastic scintillator planes as readout devices.
A.3.3. Photo Multiplier Tubes
The PMT model chosen to read out all scintillator counters is the R9880-210, manufactured by Hamamatsu. As can be seen in Figure 20(left), the quantum efficiency spectrum (i.e., the ratio between the number of output electrons and incident photons) matches the light emission band characteristic of the scintillator EJ-200 with a peak at 425 nm. Furthermore, the R9880-210 is a small device (with a cylindrical shape and an 8 mm diameter effective area for the entrance window) with a small weight and an operating temperature in the range −80°C ÷ +50°C, all important parameters to be taken into account for a spaceborne apparatus.

Figure 20. (Left) PMT quantum efficiency and (right) gain.
Download figure:
Standard image High-resolution imageConsidering the supply voltage between 750 and 900 V provided by the HEPD power supply system, the gain obtained by the R9880-210 is on the order of 105–106 (see Figure 20 (right)).
The interface between any PMT and scintillator plane is obtained through a soft optical pad.
A.4. The Veto System
The veto system includes five thin EJ-200 plastic scintillators that completely surround the calorimeter. The veto counters are placed inside a volume created by the calorimeter structure and carbon-fiber honeycomb plates located externally. A Poron thickness placed all around the scintillators prevents any stress and shock possibly transferred to the counters.
The veto subdetector is fundamental in rejecting any type of background caused by out-of-acceptance events. In particular, the system is designed for
- 1.the identification and rejection of particles that do not cross the two tracking planes but generate a trigger signal (for example, by laterally entering the apparatus);
- 2.the rejection of secondary particles produced inside the calorimeter; and
- 3.the identification of not fully contained events.
All planes of the veto system are 5 mm thick and read out by two R9880-210 Hamamatsu PMTs. Four planes are located at the lateral sides of the calorimeter, and the fifth one is below the LYSO layer, to reject particles that are not fully contained within the calorimeter, or upgoing particles.
Appendix B: HEPD Electronics
The most important requirement for a space experiment electronics system is to assure high reliability over the whole duration of the mission (5 yr for CSES-Limadou) and low power consumption (power budget <43 W for HEPD). The probability of a failure increases with the overall operating time and total number of performed power cycles. Redundancy is the best way to limit the consequences of permanent failures in the electronics subsystem. Therefore, each electronics board has been duplicated on a physical board, which hosts two identical copies of the same electronics (main and spare side). In this configuration (cold redundancy), the spare side is available in case of failure of the main side. Hot and cold sides are completely independent of each other and cannot be powered at the same time. A second level of redundancy has also been applied to some important components for each board. The drawback of this design is clearly the multiplication of the number of components, connections, and wires.
Moreover, possible mechanical damage of a board induced by strong accelerations during the launch phase has been taken into account with an accurate FEM analysis. Mechanical qualification tests for the single board and for the whole apparatus have been carried out in qualified facilities before the launch.
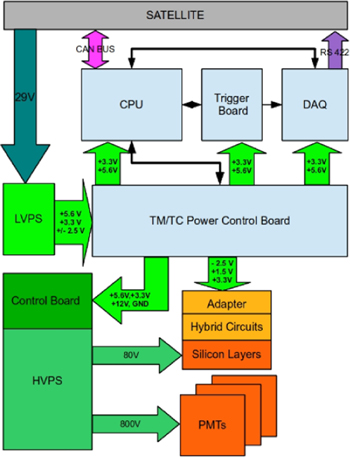
In this section, the most significant characteristics of HEPD electronics boards are illustrated (Scotti & Osteria 2017). A scheme of the HEPD ELectronics Subsystem (ELS) is shown in Figure 21.
Figure 21. General scheme of HEPD electronics and power supply subsystems. Communication and power lines between the boards and toward the satellite are shown as well.
Download figure:
Standard image High-resolution image
B.1. Power Control Board and High-voltage Board
The power control board (also named control low-voltage board) provides the "digital" voltages for all other components of the ELS. The board is divided into the usual hot/cold sides and a common section that includes the connector for a direct link with the satellite. The platform uses this arrangement to send the direct STAND_BY_ON, STAND_BY_OFF, and RESET hardware commands to HEPD. The logic of the board is implemented on an Actel Field Programmable Gate Array (FPGA) (A3P125).
The high-voltage board is instead responsible for the voltage output for the HEPD detectors. It comprises a scintillator section, formed by 10 high-voltage modules (which provide a voltage between 750 and 900 V), and a silicon section, formed by two high-voltage modules (which provide 60 V), one for each plane.
B.2. Trigger Board
The tasks of the trigger board are summarized as follows:
- 1.acquisition of the 63 PMTs by means of the EASIROC ASICs;
- 2.analog-to-digital conversion of the PMT signals and their transfer to the data acquisition board (DAQ);
- 3.management of the trigger configurations and generation of the trigger pulse;
- 4.generation of the test trigger pulse for calibration purposes;
- 5.measurement of the dead time and live time of the apparatus; and
- 6.measurement of the rate meter for each PMT and trigger configuration.
To provide all of these features, each side (hot/cold) of the board relies on an FPGA (Actel ProASIC A3PE1500), two EASIROC chips, and four 12-bit ADCs.
B.3. DAQ
The DAQ provides the following functionalities:
- 1.an interface with the front-end electronics of the silicon planes;
- 2.processing and digitization (by dedicated ADCs) of the analog signal coming from the silicon plane front end;
- 3.online calibration of the silicon detector;
- 4.acquisition of the PMT data coming from the trigger board;
- 5.compression of the data, in order to reduce the size of the events; and
- 6.formatting and transmission of the data to the satellite via the RS-422 interface (scientific data link).
To support all of these functionalities, the board is mainly composed of
- 1.a digital signal processor (DSP; ADSP-2189M) for all of the computing operations;
- 2.2× FPGAs (main and download);
- 3.2× nonvolatile ferroelectric random access memories (RAMs) for the permanent storage of the code to be executed by the DSP and other important data required at the boot of the board;
- 4.a dual-port RAM used for the data handling between the main FPGA and DSP;
- 5.a static RAM used as an FIFO21 for the data to be transferred toward the satellite; and
- 6.8× 12-bit ADCs for the digitization of the silicon detector data.
The operating frequency of the board was set at 48 MHz, as the best compromise between the requirements of fast operations and not-too-high power consumption.
Ferroelectric RAMs are RAMs that use a ferroelectric layer instead of a dielectric one to achieve the nonvolatility.22
B.4. CPU Board
The CPU board is the digital subsystem that controls the detector status and communicates with the platform of the satellite via the CAN bus interface. The board manages the following functionalities:
- 1.communication with the satellite computer (OBDH) via the 2× CAN bus interface (nominal and redundant);
- 2.management of the power control board, high-voltage control board, trigger board, and DAQ via an internal slow control link bus; and
- 3.management of system diagnostic routines and configuration.
The main components of the board are
- 1.an FPGA (Actel ProAsic3 A3PE1500) for safe boot management and implementation of the slow control link;
- 2.a digital signal processor ADSP-2189M;
- 3.2× CAN bus transceivers and 2× CAN bus controllers SJA1000T; and
- 4.a read-only EEPROM and a read-write FRAM used to store the application code for the digital signal processor.
Footnotes
- 17
The L-shell is a parameter describing a particular set of Earth's magnetic field lines. In particular, it describes field lines crossing the Earth's magnetic equator at a number of Earth radii equal to the L-value.
- 18
- 19
- 20
Fondazione Bruno Kessler: https://www.fbk.eu.
- 21
Acronym for first in, first out. It is a method for organizing the data buffer, where the oldest (first) entry is processed first.
- 22
Nonvolatile memory is a type of memory that can retrieve stored information even after having been powered off.