


Abstract
Dusty circumnuclear disks (CNDs) in luminous early-type galaxies (ETGs) show regular, dynamically cold molecular gas kinematics. For a growing number of ETGs, Atacama Large Millimeter/sub-millimeter Array (ALMA) CO imaging and detailed gas-dynamical modeling facilitate moderate-to-high precision black hole (BH) mass (MBH) determinations. From the ALMA archive, we identified a subset of 26 ETGs with estimated MBH/M⊙ ≳ 108 to a few × 109 and clean CO kinematics but that previously did not have sufficiently high-angular-resolution near-IR observations to mitigate dust obscuration when constructing stellar luminosity models. We present new optical and near-IR Hubble Space Telescope (HST) images of this sample to supplement the archival HST data, detailing the sample properties and data-analysis techniques. After masking the most apparent dust features, we measure stellar surface-brightness profiles and model the luminosities using the multi-Gaussian expansion (MGE) formalism. Some of these MGEs have already been used in CO dynamical modeling efforts to secure quality MBH determinations, and the remaining ETG targets here are expected to significantly improve the high-mass end of the current BH census, facilitating new scrutiny of local BH mass–host galaxy scaling relationships. We also explore stellar isophotal behavior and general dust properties, finding these CNDs generally become optically thick in the near-IR (AH ≳ 1 mag). These CNDs are typically well aligned with the larger-scale stellar photometric axes, with a few notable exceptions. Uncertain dust impact on the MGE often dominates the BH mass error budget, so extensions of this work will focus on constraining CND dust attenuation.

Original content from this work may be used under the terms of the Creative Commons Attribution 4.0 licence. Any further distribution of this work must maintain attribution to the author(s) and the title of the work, journal citation and DOI.
1. Introduction
Supermassive black holes (BHs), spanning a mass range of ∼105–1010 M⊙, are believed to be at the centers of nearly all large galaxies (i.e., M⋆ > 1011 M⊙; McConnell & Ma 2013). Over the past two decades, dynamical modeling techniques have been employed to measure BH masses (MBH) in well over 100 galaxies (e.g., Kormendy & Ho 2013; Saglia et al. 2016). Although BHs gravitationally dominate only the innermost regions of their host galaxies (often not more than the central few parsecs to few hundreds of parsecs in extreme cases), their masses strongly correlate with several large-scale galaxy properties, especially the stellar bulge velocity dispersion (σ⋆; e.g., Ferrarese & Merritt 2000; Gebhardt et al. 2000) and luminosity or mass (Lbul or Mbul; e.g., Kormendy & Richstone 1995; McConnell & Ma 2013). Such empirical relations suggest a coevolution of the central BH and its host galaxy through a series of gas accretion and galaxy-merger events across cosmic time. During this galaxy growth, star formation and BH accretion are regulated by both stellar and active galactic nucleus (AGN) feedback processes. However, the detailed nature of these scaling relationships—including the intrinsic scatter and dependence on galaxy morphology—remain uncertain due to small sample size, some poorly constrained MBH values, and persistent selection biases.
For the most luminous early-type galaxies (ETGs; encompassing both lenticular S0 and elliptical E galaxies), including several brightest group galaxies (BGGs) and brightest cluster galaxies (BCGs) with cored stellar surface-brightness profiles, current data hint at a steeper MBH–σ⋆ slope (Bernardi et al. 2007; Lauer et al. 2007; McConnell & Ma 2013). This result suggests that BH growth in high-galaxy-density environments follows a different evolutionary path due to the prevalence of dry (gas-poor) mergers in clusters and to a lesser extent in groups (see, e.g., Bogdán et al. 2018). However, the BH census remains incomplete above ∼108.7 M⊙, and statistical mass uncertainties in this regime are typically large (of order 25%; e.g., Saglia et al. 2016). In addition, potentially serious (and often unexplored) systematics in both stellar and gas-dynamical models may affect MBH measurements (for more discussion, see Kormendy & Ho 2013). For example, stellar triaxality is infrequently incorporated into stellar-dynamical modeling (see Liepold et al. 2023), possibly biasing the best-fitting MBH by a factor of 2 in some cases (van den Bosch & de Zeeuw 2010). A larger sample of MBH for luminous ETGs, together with greater measurement precision, are necessary for any confident interpretation of BH–host galaxy coevolution in rich galaxy environments. The most reliable MBH determinations originate from spatially resolved, relaxed tracer kinematics that extend well within the BH sphere of influence approximated by , within which the BH's gravitational influence dominates over the galaxy's extended mass contributions.

Dense molecular gas in circumnuclear disks (CNDs) provides an appealing avenue for expanding the high-mass BH census with higher precision than typically possible through other techniques. Because of the small physical extent of these CNDs (dust radii of ∼100 pc to a few kiloparsecs for most ETGs; Tran et al. 2001), gas-dynamical modeling processes are less sensitive to uncertainties in large-scale galaxy properties that often hamper stellar-dynamical efforts (e.g., van den Bosch & de Zeeuw 2010; McConnell & Ma 2013). Extended atomic/molecular gas and dust are detected in roughly half of all ETGs (di Serego Alighieri et al. 2007; Young et al. 2011; Serra et al. 2012; Alatalo et al. 2013), with an apparent preference for dense molecular gas to be found in lenticular as opposed to elliptical galaxies (di Serego Alighieri et al. 2013). About 10%–20% of all ETGs host morphologically round CNDs that suggest significant molecular gas in dynamically cold rotation which should be amenable to gas-dynamical modeling (e.g., Lauer et al. 2005; Maiolino 2008; Davis et al. 2011; Alatalo et al. 2013). In some CNDs, these tracer kinematics are detected down to (or even well within) rg, making them appealing targets for constraining BH masses.
Resolved low-J CO imaging using the Atacama Large Millimeter/submillimeter Array (ALMA) has already mapped molecular gas kinematics in a few dozen ETGs with dusty CNDs (e.g., Boizelle et al. 2017; Ruffa et al. 2019b; Zabel et al. 2019). This effort is especially valuable for the most luminous dust-disk ETGs, which tend to have large physical rg but are expected to have at least mildly triaxial stellar structures that make global stellar-dynamical modeling challenging. In cases with relaxed gaseous kinematics probing near or within rg, gas-dynamical modeling of CO cubes has resulted in some of the most precise BH mass measurements to date (Barth et al. 2016a, 2016b; Davis et al. 2017, 2018; Onishi et al. 2017; Boizelle et al. 2019, 2021; North et al. 2019; Smith et al. 2019, 2021a; Cohn et al. 2021, 2023; Ruffa et al. 2023). In addition to those cases, a greater number of ETGs have ALMA CO imaging with synthesized beam FWHMs θFWHM ≲ 2rg that should enable good-quality MBH determinations (Davis 2014).
In addition to the quality and coverage of the tracer kinematics, the accuracy of both stellar and gas-dynamical models relies on an accurate model of the galaxy mass as a function of radius. In most cases, the gas masses of CNDs in luminous ETGs are in the range ∼105–109 M⊙ (e.g., Young et al. 2011; Boizelle et al. 2017; Ruffa et al. 2019b), with the result that the enclosed mass profile is dominated by the stellar component from ∼rg out to at least a few half-light radii (Re). Models of a galaxy's mass profile are typically derived from two-dimensional (2D) optical/near-IR images of the observed stellar surface brightnesses, typically at an angular resolution similar to rg (or at least θFWHM for the ALMA CO kinematics) to avoid potentially biasing the MBH value (Yoon 2017).
Unfortunately, previous optical/near-IR imaging did not always have sufficient angular resolution to be fully useful in ALMA CO dynamical modeling efforts for luminous galaxies. At typical distances of 20−50 Mpc, these CNDs subtend angular sizes of only a few arcseconds or less, with the typical rg of the host BH on the order of ∼0 05–10. These CND systems are therefore difficult to resolve and study at optical/near-IR wavelengths except with the Hubble Space Telescope (HST), and the James Webb Space Telescope (JWST), or large-aperture ground-based facilities with adaptive optics capabilities. In addition, for certain ETGs the dust accompanying large CO column densities is sufficiently opaque, extended, and/or face-on to limit the usefulness of optical HST imaging when constructing stellar mass models. The intrinsic CND dust extinction is not known a priori, but studies have demonstrated peak AV
∼ 3–5 mag extinction of the background stellar light in some cases (e.g., Ferrarese et al. 1996; Viaene et al. 2017; Boizelle et al. 2019, 2021; Cohn et al. 2021, 2023; Kabasares et al. 2022) that is much higher than foreground screen estimates (e.g., Tran et al. 2001). Due in large part to exquisite CO kinematics, select ALMA studies have demonstrated that uncertainty in the dust-extinction correction tends to be the dominant term in the BH mass error budget (Boizelle et al. 2019, 2021; Cohn et al. 2021; Kabasares et al. 2022).
05–10. These CND systems are therefore difficult to resolve and study at optical/near-IR wavelengths except with the Hubble Space Telescope (HST), and the James Webb Space Telescope (JWST), or large-aperture ground-based facilities with adaptive optics capabilities. In addition, for certain ETGs the dust accompanying large CO column densities is sufficiently opaque, extended, and/or face-on to limit the usefulness of optical HST imaging when constructing stellar mass models. The intrinsic CND dust extinction is not known a priori, but studies have demonstrated peak AV
∼ 3–5 mag extinction of the background stellar light in some cases (e.g., Ferrarese et al. 1996; Viaene et al. 2017; Boizelle et al. 2019, 2021; Cohn et al. 2021, 2023; Kabasares et al. 2022) that is much higher than foreground screen estimates (e.g., Tran et al. 2001). Due in large part to exquisite CO kinematics, select ALMA studies have demonstrated that uncertainty in the dust-extinction correction tends to be the dominant term in the BH mass error budget (Boizelle et al. 2019, 2021; Cohn et al. 2021; Kabasares et al. 2022).
To facilitate more accurate BH mass measurements derived from ALMA CO data, we developed a set of HST programs to obtain new broadband imaging for ETGs with the most promising ALMA CO emission-line data sets. This sample included candidates with large rg and relatively small ALMA θFWHM, together with regular CO kinematics, but having no near-IR (or, at times, even optical) HST imaging. In this paper, we focus on constructing stellar luminosity models that can be employed in ongoing ALMA CO modeling efforts or in future gaseous/stellar-dynamical modeling. We additionally explore analyses of the stellar surface brightness and color behavior of the near-IR data to better place these targets in the context of volume-limited surveys. Our HST programs also include supplementary optical data that are needed to map dust attenuation, but we defer that analysis to a future paper.
This paper is organized as follows. In Sections 2 and 3, we introduce the ETG sample and describe the new and archival optical/near-IR observations, respectively. In Section 4, we explore the isophotal and color behavior of these galaxies. We detail the construction of stellar luminosity models using the multi-Gaussian expansion (MGE) formalism in Section 5. In Section 6, we discuss these results in the context of past work and analyze the accuracy and consistency of these MGE solutions. In Section 7, we preview next steps and discuss conclusions. Throughout this paper, we adopt a standard Lambda cold dark matter (ΛCDM) cosmology with Ωm = 0.308, Ωvac = 0.692, and Hubble constant H0 = 73 km s−1 Mpc−1 (Blakeslee et al. 2021; Kenworthy et al. 2022; Riess et al. 2022). Magnitudes are in the Vega system.
2. ETG Sample
We identified targets for this project based on the existence of CO(1−0), CO(2−1), and/or CO(3−2) imaging of ETGs in ALMA Cycles 2−5. Selection criteria were designed to ensure that current (or future) ALMA CO imaging could enable high-confidence MBH constraints. To that end, we selected systems with very regular CO kinematics and θFWHM ∼ 01–06 to ensure well-resolved disks. This was done by analyzing currently unpublished pipeline-calibrated images from the ALMA archive (B. D. Boizelle et al. 2024, in preparation) or by looking to literature sources to help identify additional targets with regular CO kinematics (Boizelle et al. 2017, 2021; Davis et al. 2017, 2022; van de Voort et al. 2018; Babyk et al. 2019; Rose et al. 2019; Ruffa et al. 2019a, 2019b, 2023; Zabel et al. 2019; Kabasares et al. 2024). Next, we selected ETGs with estimated rg ≳ 009 (using measured central σc and MBH estimated from the MBH–LK
scaling relation; Kormendy & Ho 2013) to ensure that rg could be fully resolved, perhaps using a more extended ALMA configuration in a reasonable amount of time. This led to a natural cutoff for distances D ≳ 250 Mpc or redshifts z ≳ 0.06. All targets have an expected CND radius ≳05 to allow for spatial characterization of the CND dust properties. Lastly, we removed candidates with previous HST wide-field, broadband near-IR (e.g., F110W) imaging to focus on cases that would benefit the most from additional HST data. Previous Near Infrared Camera and Multi-Object Spectrograph (NICMOS; Dickinson et al. 2002) data sets had too narrow a field of view (FOV) to build reliable stellar luminosity models, so we included several HST NICMOS-observed ETGs in our sample.
The final sample containing 26 ETGs is listed in Table 1 and compared to two surveys of local ETGs in Figure 1. This sample, containing about 42% elliptical and 58% lenticular galaxies, is not entirely representative of the local population of luminous ETGs, although it does span Ks -band absolute magnitudes (MK ) of about −23.5 < MK < −26 mag. Depending on the limiting MK , volume-limited surveys return different distributions: ATLAS3D (MK < −21.5 mag or D < 42 Mpc; Cappellari et al. 2011) contained 26% elliptical and 74% lenticular galaxies, while MASSIVE (MK < −23.5 mag or D < 108 Mpc; Ma et al. 2014) contained 68% and 32%, respectively. Because of ALMA's decl. limit and the abundance of targets in the ALMA archive with δ < 0°, we have only six galaxies in common with ATLAS3D (NGC 3245, NGC 4261, NGC 4429, NGC 4435, NGC 4697, and NGC 5838) and three in common with MASSIVE (NGC 997, NGC 3862, and NGC 5208). If we consider only ATLAS3D galaxies with MK ≲ −23.6 mag, the distribution of morphological types becomes identical to that of our sample. The galaxies in our sample have larger σc but lie somewhere between ATLAS3D (with MK ≲ −23.6 mag and median Re ∼ 3.4 kpc) and MASSIVE in terms of stellar luminosities (with a median MK ∼ −24.74 mag), with similar median Re. However, some of the most luminous (MK < −25.3 mag) and distant (D ≳ 100 Mpc) ETGs in our sample are very extended (Re > 10 kpc) and without analogs in the more local Universe. Restricting this comparison to ETGs in our sample that are within the ATLAS3D 42 Mpc distance limit, we find that our sample is moderately more compact (median Re ∼ 3.14 kpc). This selection bias follows a known trend of dynamical BH mass measurements being preferentially pursued in more compact galaxies relative to the distribution at a fixed luminosity, or in systems with larger projected rg (van den Bosch et al. 2015). As we determine in Section 4.3, over half of our sample have cored surface-brightness profiles, while the remainder exhibit steeper slopes; volume-limited ETG surveys show much greater preference for cuspy central slopes (Krajnović et al. 2013). Lastly, nearly every object in our sample is a member of some galaxy group, and five (Hydra A, NGC 3258, NGC 3268, NGC 3557, and NGC 6861) are referenced in the literature as either BGGs or BCGs (Garcia 1993; Zabludoff & Mulchaey 2000; Sato et al. 2012; Caso et al. 2013).

Figure 1. Galaxy properties for this sample compared to those from the ATLAS3D and MASSIVE surveys. Distances and absolute Ks -band magnitudes (left; following Ma et al. 2014) demonstrate our sample occupies an intermediate range of luminosities, while tending to have higher central velocity dispersions (σc ; upper right) but only slightly smaller median half-light radii (Re; lower right) when compared to a subsample of ATLAS3D targets with MK < −23.59 mag. The Re values for the ATLAS3D survey were derived from a combination of Third Reference Catalogue of Bright Galaxies (RC3) and Two Micron All Sky Survey determinations, normalized to agree on average with RC3 (Cappellari et al. 2011).
Download figure:
Standard image High-resolution imageTable 1. Early-type Galaxy Sample
| Galaxy | RC3 | m − M | AGal,F160W | z | DL | DA | Scale | Re | σc | MK | LH | rg |
|---|---|---|---|---|---|---|---|---|---|---|---|---|
| Name | Type | (mag) | (mag) | (Mpc) | (Mpc) | (kpc arcsec−1) | (kpc) | (km s−1) | (mag) | (1011 L☉) | (arcsec) | |
| (1) | (2) | (3) | (4) | (5) | (6) | (7) | (8) | (9) | (10) | (11) | (12) | (13) |
| Hydra A | (R')SA0∧−: | 36.89 ± 0.15 | 0.021 | 0.055782 | 238.70 | 214.14 | 1.038 | 17.79 | 341.1 | −25.99 | 4.958 | 0.13 |
| NGC 612 | SA0∧+ pec | 35.46 ± 0.15 | 0.010 | 0.029430 | 123.60 | 116.63 | 0.565 | 5.79 | ⋯ | −25.86 | 3.591 | 0.22 |
| edge-on | ||||||||||||
| NGC 997 | E | 34.71 ± 0.15 | 0.071 | 0.021015 | 87.70 | 84.13 | 0.408 | 4.96 | ⋯ | −25.26 | 2.168 | 0.22 |
| NGC 1332 | S0∧−:(s) | 31.80 ± 0.18 (1) | 0.017 | 0.005180 | 22.91 | 22.67 | 0.110 | 2.87 | 294.6 | −24.74 | 1.369 | 0.57 |
| edge-on | ||||||||||||
| NGC 1387 | SAB0∧-(s) | 31.80 ± 0.09 (5) | 0.006 | 0.004079 | 19.32 | 19.16 | 0.093 | 1.40 | 167.3 | −23.94 | 0.593 | 0.42 |
| NGC 3245 | SA0∧0(r):? | 31.43 ± 0.20 (1) | 0.013 | 0.005854 | 20.89 | 20.65 | 0.100 | 2.87 | 207.0 | −23.70 | 0.658 | 0.33 |
| NGC 3258 | E1 | 32.53 ± 0.27 (1) | 0.041 | 0.009580 | 32.06 | 31.46 | 0.153 | 2.57 | 261.0 | −24.34 | 0.788 | 0.32 |
| NGC 3268 | E2 | 32.73 ± 0.25 (1) | 0.053 | 0.009280 | 34.83 | 34.20 | 0.166 | 5.99 | 228.6 | −24.54 | 1.342 | 0.34 |
| NGC 3271 | SB0∧0(r) | 33.73 ± 0.15 | 0.056 | 0.013393 | 55.60 | 54.14 | 0.262 | 4.59 | 246.8 | −25.54 | 2.765 | 0.40 |
| NGC 3557 | E3 | 33.30 ± 0.22 (1) | 0.052 | 0.009867 | 45.71 | 44.82 | 0.217 | 6.64 | 270.3 | −26.06 | 4.844 | 0.65 |
| NGC 3862 | E | 34.95 ± 0.15 | 0.012 | 0.023403 | 97.80 | 93.38 | 0.453 | 15.26 | 265.1 | −25.41 | 3.946 | 0.21 |
| NGC 4061 | E: | 35.21 ± 0.15 | 0.018 | 0.026302 | 110.20 | 104.62 | 0.507 | 10.48 | 477.2 | −25.32 | 3.116 | 0.18 |
| NGC 4261 | E2−3 | 32.34 ± 0.19 (2) | 0.009 | 0.003332 | 29.38 | 29.18 | 0.141 | 5.02 | 296.7 | −25.05 | 2.099 | 0.54 |
| NGC 4373a | SA0∧+: | 32.60 ± 0.52 | 0.043 | 0.008019 | 33.10 | 32.58 | 0.158 | 2.94 | 201.6 | −23.77 | 0.640 | 0.23 |
| edge-on | ||||||||||||
| NGC 4429 | SA0∧+(r) | 30.73 ± 0.15 | 0.017 | 0.003382 | 13.90 | 13.81 | 0.067 | 2.65 | 173.4 | −23.93 | 0.647 | 0.58 |
| NGC 4435 | SB0∧0(s) | 31.12 ± 0.05 (4) | 0.015 | 0.003399 | 16.75 | 16.64 | 0.081 | 1.38 | 155.0 | −23.75 | 0.420 | 0.41 |
| NGC 4697 | E6 | 30.35 ± 0.14 (1) | 0.015 | 0.005114 | 11.75 | 11.63 | 0.056 | 2.51 | 165.2 | −24.00 | 0.689 | 0.71 |
| NGC 4751 | SA0∧−: | 31.86 ± 0.16 | 0.062 | 0.005694 | 23.50 | 23.24 | 0.113 | 2.46 | 350.6 | −23.59 | 0.556 | 0.29 |
| NGC 4786 | cD pec | 34.26 ± 0.15 | 0.019 | 0.017115 | 71.20 | 68.82 | 0.334 | 8.49 | 284.7 | −25.51 | 3.743 | 0.30 |
| NGC 4797 | S0∧−: | 35.35 ± 0.15 | 0.006 | 0.028053 | 117.70 | 111.36 | 0.540 | 6.14 | 201.7 | −25.44 | 2.210 | 0.18 |
| NGC 5084 | S0 edge-on | 31.85 ± 0.15 | 0.060 | 0.005664 | 23.40 | 23.14 | 0.112 | 2.50 | 199.8 | −24.77 | 1.138 | 0.59 |
| NGC 5193 | E pec: | 33.35 ± 0.15 (2) | 0.029 | 0.010247 | 46.77 | 45.83 | 0.222 | 3.22 | 205.1 | −24.66 | 1.187 | 0.24 |
| NGC 5208 | S0 | 35.09 ± 0.15 | 0.018 | 0.024894 | 104.20 | 99.20 | 0.481 | 12.35 | ⋯ | −25.55 | 4.475 | 0.22 |
| NGC 5838 | SA0∧− | 31.75 ± 0.15 | 0.027 | 0.005420 | 22.40 | 22.16 | 0.107 | 1.74 | 273.6 | −24.13 | 0.667 | 0.41 |
| NGC 6861 | SA0∧−(s): | 32.24 ± 0.36 (1) | 0.028 | 0.010137 | 28.05 | 27.49 | 0.133 | 2.36 | 387.2 | −24.74 | 1.263 | 0.47 |
| NGC 6958 | cD | 33.03 ± 0.15 | 0.023 | 0.009750 | 40.30 | 39.53 | 0.192 | 2.98 | 185.2 | −24.59 | 1.246 | 0.30 |
Notes. Properties of the ETGs observed in these HST programs. Column (2) gives the galaxy morphology reported by de Vaucouleurs et al. (1991). Column (3) lists the adopted distance modulus, with preference for SBF measurements. SBF measurements were drawn from (1) Tonry et al. (2001), (2) Jensen et al. (2003), (3) Cantiello et al. (2005), (4) Mei et al. (2007), and (5) Blakeslee et al. (2009). The remainder were derived from a luminosity distance (DL ) that is itself estimated using corrected redshifts and a standard cosmology as described in Section 1. Columns (4) and (5) report Galactic extinction in the Wide Field Camera 3/F160W band and optical redshifts from the NASA/IPAC Extragalactic Database (NED) after correcting for the Virgo + Great Attractor + Shapley inflow model (Mould et al. 2000). Columns (6) and (7) give DL and angular size distance (DA ) corresponding to the adopted z values and cosmology computed using the Wright (2006) cosmological calculator, with the corresponding physical scale given in column (8). Column (9) gives an H-band effective radius Re estimate using the half-light radius from the corresponding multi-Gaussian expansion (MGE) described in Section 5. Column (10) gives the measured central stellar velocity dispersion from the HyperLEDA database (Paturel et al. 2003); the apparent total K-band magnitudes, also from HyperLEDA, are combined with the adopted DL to estimate MK for each galaxy in column (11). Column (12) gives the total H-band luminosity estimated from MGE models. Lastly, column (13) gives the estimated rg value from the MBH–LK scaling relation (Kormendy & Ho 2013).
Download table as: ASCIITypeset image
For 12 of these galaxies, we adopted luminosity distances (DL ) from surface brightness fluctuation (SBF) distance modulus measurements (Tonry et al. 2001; Jensen et al. 2003; Cantiello et al. 2005; Mei et al. 2007; Blakeslee et al. 2009). For the remaining 14 galaxies lacking SBF-derived m − M values, we estimated DL from Hubble flow velocities using the Virgo + Great Attractor + Shapley supercluster inflow model (Mould et al. 2000) and the Wright (2006) cosmological calculator, assuming the corrected redshift reported in the NASA/IPAC Extragalactic Database (NED) is entirely cosmological in origin. 12 The median uncertainty in SBF-derived m − M corresponds to ∼12% uncertainty in DL , while Hubble-flow-derived distance moduli give only lower-bound ∼7% uncertainties from redshift errors alone. The uncertainties in the physical scale are calculated to be ∼18% from the median distance and redshift errors.
We note that nine of the targets in our sample already have published BH mass measurements or estimates (Barth et al. 2016a, 2016b; Davis et al. 2017, 2018; Boizelle et al. 2019, 2021; Ruffa et al. 2019b, 2023; Kabasares et al. 2022; Thater et al. 2022). For two of these ETGs (NGC 3258 and NGC 4261), the respective HST data have already been utilized in gas-dynamical modeling (Boizelle et al. 2019, 2021). For uniformity, however, we analyze them again using the approach outlined in Sections 3 and 5. In many cases, the stellar luminosity models constructed here will still be useful in any reanalysis of the ALMA CO data, or in more comprehensive explorations of CND dust attenuation.
3. Optical/Near-IR Data
Our sample of 26 ETGs had inconsistent broadband imaging in the optical/near-IR regimes, although all had Spitzer Infrared Array Camera (IRAC; Fazio et al. 2004) channel 1 or 2 imaging that probes far out into the stellar halo. None had high-resolution near-IR data to mitigate the impact of dust attenuation while also covering a sufficiently wide FOV, which is needed to construct stellar luminosity models, and only half had HST imaging in the F814W filter (or similar; see Table 2). In this section, we detail efforts to calibrate, mosaic, and align HST data across multiple filters. We also discuss near-IR sky subtraction with the help of larger-scale Spitzer data.
Table 2. New and Archival HST Observations
| Galaxy | This Paper1 | Other Programs | GO ID | |||
|---|---|---|---|---|---|---|
| Name | WFC3/IR | WFC3/UVIS | WFPC2 | ACS | WFC3/UVIS | |
| Hydra A | F110W, F160W | F475W | ⋯ | F814W | ⋯ | 12220 (PI: Mittal) |
| NGC 612 | F110W, F160W | F475W | ⋯ | F814W | ⋯ | 15444 (PI: Barth) |
| NGC 997 | F110W, F160W | F475W, F814W | ⋯ | ⋯ | ⋯ | ⋯ |
| NGC 1332 | F110W, F160W | F438W | F814W | ⋯ | ⋯ | 5999 (PI: Phillips) |
| NGC 1387 | F110W, F160W | ⋯ | F606W | ⋯ | ⋯ | 5446 (PI: Illingworth) |
| ⋯ | F475W, F850LP | ⋯ | 10217 (PI: Jordan) | |||
| NGC 3245 | F110W, F160W | F475W | F547M | ⋯ | ⋯ | 6837 (PI: Ho) |
| NGC 3258 | F110W, F160W | ⋯ | ⋯ | F435W, F814W | ⋯ | 9427 (PI: Harris) |
| NGC 3268 | F110W, F160W | F555W | ⋯ | F435W, F814W | ⋯ | 9427 (PI: Harris) |
| NGC 3271 | F110W, F160W | F475W, F814W | ⋯ | ⋯ | ⋯ | ⋯ |
| NGC 3557 | F110W, F160W | F438W | F555W | ⋯ | ⋯ | 6587 (PI: Richstone) |
| NGC 3862 | F110W, F160W | ⋯ | F547M, F791W | ⋯ | ⋯ | 5927 (PI: Ford) |
| F702W | ⋯ | ⋯ | 9069 (PI: Biretta) | |||
| ⋯ | ⋯ | F225W, F475W, F814W | 14159 (PI: Meyer) | |||
| NGC 4061 | F110W, F160W | F475W | F555W, F814W | ⋯ | ⋯ | 9106 (PI: Richstone) |
| NGC 4261 | F110W, F160W | ⋯ | F547M, F675W, F791W | ⋯ | ⋯ | 5124 (PI: Ford) |
| F702W | ⋯ | ⋯ | 5476 (PI: Sparks) | |||
| F450W, F606W, F814W | ⋯ | ⋯ | 11339 (PI: Zezas) | |||
| NGC 4373a | F110W, F160W | F475W, F814W | ⋯ | ⋯ | ⋯ | ⋯ |
| NGC 4429 | F110W, F160W | F475W, F814W | F606W | ⋯ | ⋯ | 5446 (PI: Illingworth) |
| NGC 4435 | F110W, F160W | ⋯ | F450W, F675W, F814W | ⋯ | ⋯ | 6791 (PI: Kenney) |
| ⋯ | F475W, F850LP | ⋯ | 9401 (PI: Cote) | |||
| NGC 4697 | F110W, F160W | F555W | ⋯ | F475W, F850LP | ⋯ | 10003 (PI: Sarazin) |
| ⋯ | ⋯ | F225W, F336W | 11583 (PI: Bregman) | |||
| NGC 4751 | F110W, F160W | F475W, F814W | ⋯ | ⋯ | ⋯ | ⋯ |
| NGC 4786 | F110W, F160W | F438W | F555W | ⋯ | ⋯ | 6587 (PI: Richstone) |
| NGC 4797 | F110W, F160W | F475W, F814W | ⋯ | ⋯ | ⋯ | ⋯ |
| NGC 5084 | F110W, F160W | F475W | ⋯ | ⋯ | ⋯ | ⋯ |
| NGC 5193 | F110W, F160W | F475W | F814W | ⋯ | ⋯ | 5910 (PI: Lauer) |
| NGC 5208 | F110W, F160W | F475W, F814W | ⋯ | ⋯ | ⋯ | ⋯ |
| NGC 5838 | F110W, F160W | F555W | F450W, F814W | ⋯ | ⋯ | 7450 (PI: Peletier) |
| NGC 6861 | F110W, F160W | F438W | F814W | ⋯ | ⋯ | 5999 (PI: Phillips) |
| NGC 6958 | F110W, F160W | F475W | F547M, F814W | ⋯ | ⋯ | 8686 (PI: Goudfrooij) |
Notes. Optical and near-IR medium- and broadband-filter HST observations that provide good coverage and depth. New WFC3/IR and UVIS observations (GO IDs1: 14920, 15226, and 15909; PI: Boizelle)
1 supplement archival data sets that were obtained using the Wide Field Planetary Camera 2 (WFPC2), Advanced Camera for Surveys (ACS), or WFC3/UVIS instruments, ensuring sufficient coverage and sampling for dust-attenuation modeling. The typical H-band FOV is 3 6 × 36 with exposure times ranging from 250 to 400 s. The J-band images are typically subarrays with a FOV of ∼1' × 1' and exposure times ranging from 100 to 250 s. The optical data range of coverage typically fell between the H- and J-band ranges, with an average FOV of 25 × 25 and exposure times ranging from 150 to 400 s.
Download table as: ASCIITypeset image
3.1. HST Imaging
We observed each ETG in a single HST orbit through programs GO-14920, GO-15226, or GO-15909 (Cycles 24, 25, and 27; PI: Boizelle) using the Wide Field Camera 3 (WFC3; Dressel 2022) in the IR channel with a focus on F160W data. For just over half of our targets, we obtained additional WFC3/UVIS imaging to provide either the first or supplemental optical HST imaging, since broad wavelength coverage is crucial in constraining dust attenuation (as a Galactic reddening law has Aλ decreasing by a factor of ∼8 from the B to H bands). All these HST data can be found in the Mikulski Archive for Space Telescopes (MAST) doi:10.17909/98s2-be33 and on Zenodo doi:10.5281/zenodo.11122962. In Table 2, we list these new WFC3 data together with the archival Wide Field Planetary Camera 2 (WFPC2; McMaster & Biretta 2008), Advanced Camera for Surveys (ACS; Ryon 2022), and WFC3 observations that were selected for this project to span the desired wavelength range.
3.1.1. New WFC3 Data
In the IR channel, we obtained both F110W and F160W (hereafter J and H) imaging for all targets, primarily to construct a near-IR mosaic that adequately samples the CND while also probing well into the stellar halo. We employed a four-point dither pattern for H-band observations, adopting the WFC3-IR-DITHER-BOX-MIN pattern to more optimally sample the H-band point-spread function (PSF) for more compact galaxies. For more extended targets, we used a large square dither pattern with offsets of up to 75'' and a total coverage of up to 36 × 36. In all cases, we placed the central bright region of each galaxy within the overlap of the four pointings. In most cases, these WFC3/IR mosaics cover out to a few × Re, with a median projected Re ∼ 20'' and a maximum of ∼40''. Individual H-band exposure times ranged from 250 to 400 s, using various SPARS or STEP sampling sequences to avoid time loss due to buffer dumps. Each MULTIACCUM image had NSTEP = 9 or higher to enable good up-the-ramp calibration and cosmic-ray rejection. Combined exposure times in the overlap regions deliver background-limited sensitivity for this filter, and we estimate a typical 1σ surface-brightness depth of ∼25.9 mag arcsec−2 in a 1'' × 1'' region measured at the edges of this dither pattern.
For wavelengths bluer than the H band, observations were centered on the CND, with the observing setup adapted to avoid costly buffer dumps and fit each target in a single orbit. We generally obtained the J-band data using the IRSUB512-FIX subarray aperture, employing the 2-point WFC3-IR-DITHER-LINE pattern to better sample the PSF, with a final FOV of about 60'' × 60''. For nearly 80% of our sample, this J-band FOV covers out to at least one (projected) Re from the nucleus. In a few cases, the available optical data and orbit constraints allowed for full-aperture J-band imaging. Sampling sequences for the J-band observations were similar to those employed in acquiring the H-band data. Individual exposure times generally ranged between 100 and 250 s, with combined exposure time reaching (or exceeding) the threshold for background-limited sensitivity. Two cases with extended stellar light distributions (NGC 3862 and NGC 4261) host AGNs that are more prominent in the optical, and we obtained additional J- and H-band imaging of these galaxies to better characterize the near-IR point sources. These data employed an IRSUB256-FIX aperture with an ideal four-point dither pattern and the SPARS5/NSAMP = 15 combination for rapid temporal sampling, with a total exposure time for an individual pointing of 33 s.
For over 80% of our sample, the existing HST optical data were not sufficient for our eventual goal of constraining dust attenuation arising from the CNDs. We obtained additional WFC3/UVIS data using the F438W or F475W filter (B band) and/or the F814W filter (I band) to ensure broad wavelength coverage. In a few cases, orbit scheduling also allowed for F555W imaging for more complete wavelength sampling. To allow all data for a given object to be scheduled in a single orbit, we chose either the UVIS1-2K2A-SUB or UVIS2-M1K1C-SUB apertures. Total exposure lengths for individual frames ranged from 150 to 400 s depending on the time available. To limit the impact of cosmic rays, observations in a single filter were split into either two or three frames and dithered using the corresponding WFC3-UVIS-DITHER-LINE pattern.
3.1.2. Archival Data
We retrieved optical (and occasionally UV) ACS, WFPC2, and WFC3 images of our target galaxies from MAST. 13 When there were duplicates in a specific wavelength regime, preference was given to data taken with later-generation detectors, sequences that gave better spatial coverage of the dusty CND, and better angular resolution. Additional criteria included good image quality (e.g., low incidence of cosmic rays overlapping with the CND) and an unsaturated nucleus. Narrowband data were not included in the final analysis due to the likelihood of emission-line contamination (e.g., Walsh et al. 2008). As mentioned earlier, NICMOS data were not included due to calibration issues toward that instrument's edges and its limited FOV.
3.1.3. Calibration and Analysis
After processing these new HST data through the CALWF3 pipeline (Dressel 2022), we created final H-band mosaics and B, I, and J subarray products using AstroDrizzle (Gonzaga et al. 2012). All images were drizzled to the same pixel scale of 008 pixel−1 to facilitate the exploration of dust extinction across each CND. For the dithered WFC3/IR data, we adopted a pixel fraction of 0.75 to optimize the PSF sampling and pixel noise. Since the WFC3/UVIS data had smaller detector pixel sizes but less ideal dithering, we used the same pixel fraction. In general, these WFC3 data obtained in a single orbit remain well aligned after drizzling. In Figure 2, we show examples of our H-band mosaics and the HST footprint overlaid on larger-scale near-IR imaging.

Figure 2. HST WFC3/F160W (H-band) drizzled mosaics for three targets overlaid on Spitzer IRAC1 (3.6 μm) supermosaics that were scaled to match the H-band data at the edge of the HST footprint. These targets highlight the diversity of stellar halo extents and the challenges in accurately determining the H-band sky background for most of the sample. Images are displayed using a logarithmic intensity scale.
Download figure:
Standard image High-resolution imagePreliminary mosaicing of the archival HST data did not align well with the new WFC3 data, so we first aligned the pipeline-calibrated files to the H-band mosaic using TweakReg (Gonzaga et al. 2012). We then combined the single-filter data in AstroDrizzle using the same pixel scale. The accuracy of dust-attenuation modeling is very sensitive to the relative (subpixel) alignment of data across all filters. Slight offsets between different filters were still present, so to further improve the alignment of the HST data for each target, we calculated a luminosity-weighted centroid using a series of stellar isophotes that were measured beyond the dusty features of the CND. Afterwards, we corrected for the offsets of the shorter-wavelength data relative to the H-band mosaic. Finally, we confirmed the accuracy of these subpixel offsets (or introduced additional fine-tuning) by inspecting the resulting color maps. In Figure 3, we show an example of the alignment of these multiwavelength images for a single target.

Figure 3. Aligned HST images (left) show the NGC 4435 nucleus and CND across five different optical/near-IR filters and two detectors, displayed using an inverted grayscale. The scale bar corresponds to 100 pc. Surface-brightness measurements extracted along the major axis (right; without any dust masking and scaled together at R = 35) show the >2× change in attenuation, and the best-fit stellar luminosity model for the H-band mosaic (dust-masked; see Section 5) fits the data well. At the disk outskirts between 25 < R < 35, the diffuse dust primarily impacts the optical filters, while the highest-column-density gas lies between 15 < R < 25. The dust radius Rdust,H
from Table 3 identifies the extent of the near-IR-thick disk.
Download figure:
Standard image High-resolution imageRecovering intrinsic stellar luminosities necessitates a prescription for the PSF in a given filter. Following standard practice, we created model H-band PSFs for each target by dithering and drizzling copies of the Tiny Tim (Krist & Hook 2004) F160W response, as we did for the HST data. This dithering and drizzling process returns PSFs with somewhat narrower FWHMs (average FWHM ∼ 019) than are observed for foreground stars in the H-band mosaics (generally ∼022–024). An alternative approach is to employ an empirical PSF using either stars in each field or an average point-source response near a particular detector location. The H-band mosaics of our sample do not contain many suitable PSF stars, and galaxy light often contaminates the PSF wings. Therefore, we employed the composite WFC3/F160W PSF provided by STScI (Anderson 2016), again dithering and drizzling copies of this frame in the same manner as done for the Tiny Tim files. While the empirical PSF only extends out to R ∼ 1'', it produces slightly better agreement (FWHM ∼ 020–021) with those measured in the H-band mosaics. None of our targets have overly dominant H-band point sources, so subsequent stellar luminosity fits are not affected by the limited PSF response range. In Section 5, we compare stellar luminosity models constructed using both a theoretical and an empirical PSF, while for the remainder of this paper we adopt results that employed the Tiny Tim PSF.
3.2. Spitzer Imaging and Sky Subtraction
Based on an initial analysis, nine galaxies were sufficiently compact (or distant) to allow for accurate H-band sky removal using the edges of the corresponding WFC3 mosaics. For the remaining 17 galaxies (see Table 3), H-band stellar light contributions near the edges of the HST footprint were close to the expected background level (primarily zodiacal in origin; Pirzkal 2014), as estimated using the WFC3/IR Exposure Time Calculator (ETC) for the corresponding solar angles. 14 Such a high level of stellar light that persists out to a projected distance of precludes accurate sky subtraction using the H-band data alone. Following the method outlined by Boizelle et al. (2019), we determined those sky values with the aid of larger-scale Spitzer IRAC channel 1 (3.6 μm) supermosaics from the Spitzer Heritage Archive, 15 with the data available at the Infrared Science Archive doi:10.26131/IRSA361. After masking galaxies, foreground stars, and noisy regions in these Spitzer data, we extracted H-band and IRAC1 surface-brightness profiles in the same direction toward the corner of the HST mosaic. Using overlapping measurements between R ∼ 20''–70'' (median of about 1−3 Re), we simultaneously determined both the average H − IRAC1 color and the H-band sky background. This radius range avoids PSF blurring effects, and the near-IR color gradients tend to be mild (e.g., Tamura & Ohta 2003; Iodice et al. 2019) but increasingly blue with radius. The best-fit H-band sky values (μsky,H ∼ 20–21 mag arcsec−2) mostly agree with ETC values, and the median H − IRAC1 ∼ 2.20 mag at these radii with a standard deviation of ∼0.16 mag is consistent with the color of an evolved, metal-rich single-burst stellar population (with total metallicity [M/H] = 0.22 with an age of 10 Gyr; Vazdekis et al. 2012, 2016).

Table 3. CND Properties, Isophotal Analysis, and Spitzer Scaling Results
| CND Properties | Stellar Isophotal Results | Near-IR Colors | ||||||||||
|---|---|---|---|---|---|---|---|---|---|---|---|---|
| Galaxy | Rdust,H | (b, a)dust,H | PAdust,H | ΔPA⋆ | Δε⋆ | Median | Min,max | IC | H − IRAC1 | ∇J−H | ||
| Name | (kpc) | (arcsec) | (deg) | (deg) | (deg) | a4/a | a4/a | (mag) | (mag) | |||
| (1) | (2) | (3) | (4) | (5) | (6) | (7) | (8) | (9) | (10) | (11) | (12) | (13) |
| Hydra A | 2.03 | 0.27, 1.96 | −75.3 | −36.0 | 41.2 | 0.126 | 0.304 | −0.006 | −0.101, 0.003 | x0b | ⋯ | −0.024 |
| NGC 612 | 10.8 | 2.90, 19.1 | −11.0 | −15.4 | 46.8 | 0.265 | 0.198 | 0.014 | −0.023, 0.046 | xd? | 2.26 | −0.027 |
| NGC 997 | 2.32 | 4.69, 5.70 | 32.6 | 29.7 | 11.0 | 0.121 | 0.034 | −0.006 | −0.043, −0.002 | x0b | ⋯ | −0.103 |
| NGC 1332 | 0.24 | 0.17, 2.17 | 114.9 | 116.7 | 3.4 | 0.321 | 0.445 | −0.007 | −0.014, 0.005 | x0b | 2.12 | −0.031 |
| NGC 1387 | 0.88 | 8.35, 9.43 | 52.1 | 108.7 | 54.5 | 0.146 | 0.296 | −0.001 | −0.015, 0.006 | x0 | 2.22 | −0.024 |
| NGC 3245 | 0.16 | 0.59, 1.60 | −6.9 | −3.4 | 19.7 | 0.367 | 0.367 | 0.001 | −0.091, 0.024 | xd0? | 2.65 | −0.054 |
| NGC 3258 | 0.15 | 0.58, 0.99 | 75.0 | 76.3 | 21.3 | 0.176 | 0.188 | −0.001 | −0.009, 0.031 | x0d | 2.66 | −0.071 |
| NGC 3268 | 0.40 | 1.27, 2.40 | −108.6 | −112.1 | 7.4 | 0.196 | 0.097 | 0.001 | −0.002, 0.007 | x0 | 2.20 | −0.044 |
| NGC 3271 | 0.46 | 1.04, 1.74 | −86.1 | −66.9 | 33.7 | 0.322 | 0.280 | −0.003 | −0.035, 0.043 | xd0db | ⋯ | −0.058 |
| NGC 3557 | 0.22 | 0.62, 0.99 | 36.2 | 33.4 | 7.7 | 0.245 | 0.122 | 0.002 | −0.006, 0.011 | x0 | 2.20 | −0.025 |
| NGC 3862 | 0.38 | 0.80, 0.84 | −9.0 | −16.0 | 62.7 | 0.022 | 0.344 | 0.002 | −0.019, 0.015 | x0d0b | 2.27 | −0.046 |
| NGC 4061 | 0.92 | 0.93, 1.81 | −6.2 | −5.6 | 28.1 | 0.184 | 0.084 | −0.006 | −0.076, 0.027 | x0b | ⋯ | −0.063 |
| NGC 4261 | 0.13 | 0.51, 0.89 | −16.4 | −22.3 | 11.1 | 0.220 | 0.137 | −0.002 | −0.014, 0.004 | x0 | 2.20 | −0.024 |
| NGC 4373a | 0.95 | 2.17, 6.00 | −26.0 | −32.4 | 9.7 | 0.428 | 0.404 | 0.003 | −0.010, 0.030 | x0d0 | ⋯ | −0.123 |
| NGC 4429 | 0.90 | 5.62, 13.5 | 90.3 | 94.4 | 11.5 | 0.439 | 0.248 | 0.004 | −0.013, 0.043 | x0db0 | 2.15 | −0.021 |
| NGC 4435 | 0.25 | 0.86, 3.07 | 13.8 | 6.3 | 28.8 | 0.362 | 0.273 | 0.002 | −0.018, 0.054 | x0bd0d | 2.13 | −0.042 |
| NGC 4697 | 0.20 | 0.95, 3.48 | 65.3 | 66.0 | 2.3 | 0.436 | 0.142 | −0.003 | −0.010, 0.003 | x0 | 2.13 | −0.034 |
| NGC 4751 | 1.54 | 3.22, 13.7 | −5.1 | −4.9 | 5.2 | 0.587 | 0.102 | −0.003 | −0.031, 0.008 | x0b | ⋯ | −0.157 |
| NGC 4786 | 0.19 | 0.32, 0.57 | −13.1 | −17.0 | 13.1 | 0.224 | 0.105 | 0.002 | −0.011, 0.033 | x0d | 2.20 | −0.025 |
| NGC 4797 | 5.72 | 4.64, 10.6 | 22.8 | 31.0 | 17.8 | 0.251 | 0.219 | 0.001 | −0.013, 0.024 | x0d | ⋯ | −0.069 |
| NGC 5084 | 0.13 | 0.44, 1.18 | −2.0 | 82.8 | 5.7 | 0.388 | 0.449 | −0.002 | −0.016, 0.006 | x0b? | 2.13 | −0.023 |
| NGC 5193 | 0.21 | 0.60, 0.96 | 64.7 | 70.8 | 46.1 | 0.209 | 0.196 | 0.005 | −0.031, 0.047 | x0d? | ⋯ | −0.036 |
| NGC 5208 | 8.70 | 3.42, 18.1 | −17.7 | −17.1 | 6.2 | 0.611 | 0.050 | −0.006 | −0.008, 0.036 | x0? | ⋯ | −0.083 |
| NGC 5838 | 0.45 | 1.70, 4.15 | 36.8 | 47.4 | 11.9 | 0.243 | 0.464 | −0.004 | −0.023, 0.007 | x0b0 | 2.18 | −0.080 |
| NGC 6861 | 1.01 | 1.92, 7.60 | −37.9 | −38.0 | 25.7 | 0.458 | 0.224 | 0.002 | −0.002, 0.038 | x0d | 2.19 | −0.078 |
| NGC 6958 | 0.25 | 1.15, 1.29 | 105.5 | 109.7 | 43.7 | 0.125 | 0.225 | −0.001 | −0.024, 0.050 | x0bd? | 2.25 | −0.059 |


Notes. General CND properties together with near-IR stellar light behavior. Columns (2), (3), and (4) report the (physical) outer dust-disk radius, the (projected) minor and major axes, and the corresponding position angle, respectively, estimated primarily from the H-band data but with some input from bluer data. Columns (5) and (7) give the average stellar photometric PA and ellipticity, respectively, generally averaged from Rdust,H to Re in most cases. Columns (6) and (8) give the range of PA⋆ and ε⋆ values from stellar isophotal fitting just beyond Rdust,H to near the edge of the H-band mosaic. Additional details are found in Section 4.2. Columns (9), (10), and (11) report the median and range of a4/a parameters over this same range, and the isophotal codes (ICs; Rest et al. 2001) over the H-band surface-brightness extent from smallest to largest radii; x, d, b, 0, and ? represent regions undetermined due to dust, disky, boxy, intermediate, and uncertain/inconsistent a4/a regions. To this table are added the best-fitting H –IRAC1 color terms in column (12) to scale together these surface-brightness profiles. Column (13) reports the logarithmic J − H color gradient, measured from Rdust,H to Re in most cases.
Download table as: ASCIITypeset image
Finally, we removed the sky background from the smaller-FOV J-band data. Except for a few cases where the ETG was sufficiently compact, we estimated J-band sky values by scaling the measured H-band levels by the ratio of J/H zodiacal light from the ETC estimates. Slight adjustments were made to ensure smooth color gradients at the largest radii probed by the WFC3/IR (sub)array mosaics. We note that any uncertainty in the near-IR sky subtraction does not affect the stellar luminosity models described in Section 5. Even if we change the H-band sky level by a factor of ∼2, the resulting circular velocity curves change by at most a few kilometers per second, and overwhelmingly in the galaxy outskirts.
4. Stellar Surface-brightness Behavior
After WFC3/IR and archival data alignment and sky subtraction, we constructed color maps and extracted radial profiles to explore the CND dust and stellar behavior across the WFC3/IR FOV. Examples of central stellar surface-brightness profiles in the available HST filters are shown in Figure 3. To isolate the galaxy light, we masked out all other galaxies, foreground stars and diffraction spikes, detector artifacts, and pixels affected by cosmic rays.
4.1. Near-IR Colors
HST near-IR color maps shown in Figure 4 are expected to isolate the optically thick dust distribution. As is shown in Figure 3, near-IR colors are not always sensitive to optically thin and occasionally filamentary features, which are not always detected in ALMA CO imaging (see also Boizelle et al. 2019). From each J − H map, we constructed an additional mask of the dust (see Figure 5) that nearly always contains the entire near side of the disk based on a color cutoff of J − H ≳ 0.88 mag (or an intrinsic color excess Δ(J − H) ≡ (J − H) − (J − H)⋆ ≳ 0.08 mag after subtracting off the stellar (J − H)⋆ that is evaluated just beyond the CND). From these J − H maps, we visually measured the semimajor and minor axes adust,H and bdust,H of the optically thick CND as well as the major-axis position angle PAdust,H (see Table 3). In most cases, the (physical) disk radius Rdust,H is a small fraction of Re. In fact, in only five cases (NGC 612, NGC 1387, NGC 4751, NGC 4797, and NGC 5208) is Rdust,H > Re/2. We note that Rdust,H is often 10%−20% smaller than Rdust measured in the B band, but we retain the H-band value as it better traces high-column-density material.

Figure 4. Central portions of J − H color maps, showing both the CNDs and their environs. The near side of each disk obscures a greater fraction of the stellar distribution, resulting in redder colors. While these CNDs were selected based on their regular dust morphology, filamentary dust features (especially in NGC 5084) or warped-disk structures (especially in NGC 612 and NGC 4797) are also detected. J − H colors (in mag) are mapped according to each color bar.
Download figure:
Standard image High-resolution image
Figure 5. Central portions of the H-band drizzled mosaics, with shaded regions showing the most dust-obscured portions of each CND based on high J − H colors (see Figure 4) that were masked during the MGE fit (overplotted in red). The CNDs of NGC 1387 and NGC 3862 were left unmasked due to either only marginal evidence for dust attenuation or a more face-on orientation that would require more complete masking of the inner ∼1''. Contours are placed at logarithmic intensity intervals.
Download figure:
Standard image High-resolution imageFigure 6 shows J − H and Δ(J − H) color profiles extracted along the stellar major axes, with Δ(J − H) reaching typical 0.06−0.10 mag reddening along the major axis at ∼(0.4–0.9)Rdust,H . Adopting a standard Galactic extinction law (RV = 3.1) and assuming that the CND lies in the midplane of each galaxy, the typical major-axis Δ(J − H) values above correspond to intrinsic AV ∼ 1.5–2.5 mag (for details, see Equations (1) and (2) from Boizelle et al. 2019). In some cases, the observed Δ(J − H) reaches the ∼0.15 mag turnover point corresponding to AV ∼ 5 mag (see Figure 3 of Boizelle et al. 2019), suggesting the innermost regions of certain CNDs become optically thick even in the H band. Along the major axis, the rough Δ(J − H) ≳ 0.08 mag masking criterion corresponds to AH ≳ 0.35 mag, or a drop of background stellar intensity of ∼25%.

Figure 6. Radial near-IR color and isophotal behavior of the ETG sample. Left: J − H color (above) and Δ(J − H) reddening (below) relative to stellar color just outside the CND plotted vs. radius normalized to the CND radius. The median stellar J − H color and its 1σ scatter just beyond Rdust,H are noted in the upper left panel. Center and right: position angle (PA⋆ − PA⋆,e; above) and ellipticity (ε⋆ − ε⋆,e; below) plotted vs. radius after removing the values PA⋆,e and ε⋆,e measured at the half-light radius Re, normalized to Re, for lenticular (center) and elliptical (right) galaxies, respectively. The position angle and ellipticity values are plotted starting just beyond the dust-disk extent (i.e., for all R ≥ Rdust,H ). The only exception is NGC 612 (plotted in orange), for which Rdust,H > Re. Galaxies labeled and highlighted in red are also contained in the MASSIVE survey, some of which are clear outliers in PA⋆ − PA⋆,e.
Download figure:
Standard image High-resolution imageBeyond the CND, the stellar J − H colors along the major axis show a gradual blueward trend with increasing radius. These (linear in ) trends are consistent with inside-out growth for (mostly) relaxed ETGs, with the bluer colors expected to arise from significant dry merger(s) (e.g., Saracco et al. 2012; Kim & Im 2013). To better compare these gradients to previous work (e.g., La Barbera et al. 2010), we adopt a logarithmic color gradient formalism:


where here Δ(J − H) refers to the difference in J − H color over a large radial range. Inner and outer R were set to slightly beyond Rdust,H (to avoid residual dust contamination) and 2 Re, respectively, in all cases except NGC 612, where we set the outer R = 3.5 Re because of the large Rdust,H ≈ 2 Re. The median ∇J−H ∼ −0.045 mag and fairly tight standard deviation of 0.034 mag are consistent with established near-IR color gradients of local ETGs (e.g., Aaronson 1977; La Barbera et al. 2010) and do not suggest steeper gradients for ETGs with dust features (see Kim & Im 2013). Our selection criteria avoided both lower-mass ETGs and those with more diffuse dust, which may explain the relatively tight ∇J−H distribution.
In general, these CNDs are expected to be relatively thin and flat, and so the (outer) disk kinematic angle i should satisfy (e.g., Barth et al. 2016a; Davis et al. 2017). We note that the observed axis ratio will tend to be more round than the intrinsic one due to beam smearing, especially for the smallest (projected) adust,H . As a result, the inferred i may be systemically smaller than the true value. Estimating i by kinemetric analysis of the observed CO velocity maps (Krajnović et al. 2006) is similarly fraught, as beam smearing tends to circularize the apparent kinematics except in cases where the outer CO extent RCO is much larger than the synthesized beam and the disk is not viewed too edge-on (e.g., Boizelle et al. 2017). This picture is further complicated by both photometric and kinematic evidence for disk warping. Color maps can identify some disk-warping signatures (e.g., NGC 612, NGC 3268, and NGC 4797 in Figure 4), although they cannot easily detect twists of Δi ≲ 10° or those within the inner couple of resolution elements. The prevalence and degree of disk warping has not yet been explored for a large sample of well-resolved CNDs. For four of our ETGs, however, Boizelle et al. (2017) find a shift in CO velocity line-of-nodes position angle (PA) of ΔPA ∼ 5°–10° across the entire CNDs. Boizelle et al. (2019) find a central Δi ∼ 20° for NGC 3258 from gas-dynamical modeling, although for most of the disk area Δi is low and i is consistent with the (b/a)dust,H estimate to within about 5°.

For the CNDs in our sample, we find a median i ∼ 65° estimated from (b/a)dust,H , with individual values ranging from 18° to 86°. The apparent preference for higher i in this sample likely stems from the greater ease of identifying more inclined disks in optical/near-IR imaging. Highly inclined disks do allow for more straightforward dust masking that removes fewer overall pixels and gives an essentially unobscured view along the minor axis. Despite the benefits when constructing stellar luminosity models, however, disks with i ≳ 75° are susceptible to substantial modeling degeneracies (e.g., Barth et al. 2016a, 2016b). Similar difficulties arise for nearly face-on orientations (i ≲ 15°; Smith et al. 2019). As a result, more intermediate i are preferred for the gas-dynamical approach.
4.2. Isophotal Analysis
To better compare to the stellar behavior of other ETGs and to quantify the discrepancies between dust disk and stellar alignment, we analyzed the H-band isophotal behavior using the IRAF (Tody 1986, 1993) ellipse task. This task returns the stellar intensity, PA⋆, ellipticity (ε⋆ = 1 − b/a), and deviation from a true ellipse (a4/a) at logarithmically spaced radius intervals. Bad pixel maps were passed into the IRAF task using the primary and dust masks. In Figure 6, we plot changes in PA⋆ and ε⋆ respective to their values at Re. Individual radial PA⋆ and ε⋆ results, as well as the a4/a measurements, are provided in Appendix A.
In Table 3, we report the weighted-average stellar photometric PA⋆, which was calculated as

between Rdust,H and Re. We followed an identical approach to determine the weighted-average . The only exceptions are NGC 612 and NGC 4797, whose Rdust,H are ∼2 Re and Re, respectively, and for which the radial ranges were extended out to 3 Re and 1.5 Re. We also report the degree of isophotal twisting (ΔPA⋆) using the method described by Goullaud et al. (2018):


Here, PAi and PAj are the maximum and minimum stellar PA values from just beyond Rdust,H to near the edge of the H-band mosaic. The range in ellipticity (Δε⋆) was computed in an identical manner. Some of the final ellipse results were not included in these ΔPA⋆ and Δε⋆ ranges due to unusually large uncertainties or considerable discrepancies between neighboring points, most often near the edge of the H-band coverage.
In most cases, photometric twists are small, with over half our targets showing ΔPA⋆ < 20° and only about a fifth reaching ΔPA⋆ > 40°. Figure 6 separates the PA⋆ and ε⋆ responses for different morphological types, with lenticular and elliptical galaxy groups having fairly consistent PA⋆ from Rdust,H to ∼2 Re and Re, respectively. Some systems' PA⋆ and ε⋆ remain flat over the entire WFC3/IR FOV. However, there are some notable exceptions: NGC 3862 shows consistent stellar PA⋆ gradients (and increasingly flattened isophotes) with radius, both within and beyond Re; NGC 612 shows similar behavior that is likely due to recent accretion or a major merger (Emonts et al. 2008; Duah Asabere et al. 2016); and Hydra A shows a consistent PA⋆ beyond ∼2Rdust,H but a rapid ΔPA⋆ ∼ 40° over a radial extent of just 2 kpc. Overall, our sample shows photometric PA behavior similar to that seen in many of the ETGs in the MASSIVE survey (Goullaud et al. 2018), although the latter includes a few cases with more extreme ΔPA⋆.
Unsurprisingly, the largest Δε⋆ are found in lenticular galaxies, whose ε⋆ typically increases from the nucleus to ∼Re due to an increasingly dominant disky stellar component. Beyond ∼Re, the lenticular population trend bifurcates, with ε⋆ continuing to increase for a few galaxies while the majority show negative trends as the more circular stellar halo begins to dominate the isophotal behavior. Elliptical galaxies have more moderate Δε⋆. To quantify the difference between morphological types, we computed the isophotal axis ratio 1 − ε⋆ over the entire radial range for each galaxy to measure the ratio of the maximum/minimum values. The median and scatter in the ratio of extremal 1 − ε⋆ values for elliptical galaxies is 1.19 ± 0.13, while for lenticular galaxies we find a ratio of 1.57 ± 0.42. The typical lenticular galaxy in our sample shows a factor of ∼3 greater change in the isophotal axis ratio than does the typical elliptical galaxy. The half of our sample that have mild isophotal twists (ΔPA⋆ < 20°) but have Δε⋆ ≥ 0.2 correspond to lenticular galaxies, with increasing ε⋆ following the transition from bulge- to disk-dominated regions. In the remaining half with more substantial isophotal twists (ΔPA⋆ > 20°), every case of high Δε⋆ ≥ 0.2 is either a lenticular galaxy or, in the cases of NGC 3862 and NGC 6958, an elliptical galaxy that shows ΔPA⋆ ≳ 45°, which is suggestive of recent merger activity or tidal disruption. In many cases, those lenticular galaxies with high Δε⋆ also show elevated ΔPA⋆ values.
Most of our targets show this good agreement between stellar and CND photometric axes argues either for in situ formation of the CNDs or sufficient elapsed time for gas to settle into the galaxy midplane (of order ∼1 Gyr; e.g., Tran et al. 2001; Lauer et al. 2005; Davis et al. 2013; van de Voort et al. 2015). Despite general agreement, four ETGs show more extreme . As mentioned earlier, the Hydra A only matches PAdust,H near Rdust,H ; for NGC 1387 and NGC 3271, the stellar isophotes always appear to be misaligned; and NGC 5084 appears to have a polar-oriented CND that is a strong candidate for external origin. Still other systems show good agreement out to ∼(1–3) Re, followed by high PA⋆ shifts beyond. This group includes four elliptical galaxies (NGC 3258, NGC 4061, NGC 4786, and NGC 6958) and three lenticular galaxies (NGC 612, NGC 4435, and NGC 6861).


In Table 3, we also include the median a4/a parameter along with its minimum and maximum values over the same radial ranges. Following Rest et al. (2001), we computed isophotal codes (ICs) for radial bins to determine the prevalence of boxy (a4/a < −0.01) and disky (a4/a > +0.01) components through the stellar bulges and into the halos of these luminous ETGs. We find roughly equal numbers of ICs that show neither disky/boxy behavior out to the edge of the H-band FOV and ICs that show some preference for either disky or boxy isophotes. Nearly one in five systems show both disky and boxy behavior, almost always transitioning quickly between the two. Those that show the strongest disky or boxy isophotes (with ∣a4/a∣ > 0.03; NGC 612, NGC 3271, NGC 4373a, NGC 4429, and NGC 4435) are all lenticular galaxies with a very disky stellar component.
4.3. Nuker Fits
To characterize the core versus cuspy nature of our sample, we also fit the H-band stellar surface-brightness profiles with a Nuker profile (Lauer et al. 1995) of the form

This functional form is well suited to model the light distributions of massive elliptical galaxies, which typically follow log-linear behavior. The Nuker profile connects inner and outer power-law slopes γ and β, respectively, with a transition sharpness α at the break radius Rb.
A 2D approach to fitting the stellar surface brightnesses is challenging due to the observed ΔPA⋆ and Δε⋆. Instead, we optimized the Nuker parameters using the isophotal intensity curves shown in Appendix A. Upon inspection, the H-band I(R) of several galaxies shows more complicated behavior that would require additional components (or different parameterizations) for adequate global fits. Since we are primarily concerned with the circumnuclear stellar behavior, we restricted these Nuker fits to radial ranges that best matched a broken power law (generally out to ∼Re). We followed Lauer et al. (1995) in not fitting to the centermost data points (for the WFC3/IR data, points with R ≲ 012 were removed) due to potential PSF inaccuracies. We also required Rb > 02 to ensure the solutions are robust against HST PSF effects and do not hinge on a singular central data point. To recover intrinsic γ and Rb values from the optimization process, we convolved the model surface-brightness profile with a one-dimensional (1D) approximation of the H-band PSF by extracting the Tiny Tim response along the major axis.
For completeness, we also computed the intrinsic Nuker slope:

at the resolution limit of the H-band data, i.e., at half the PSF FWHM (). Since we have already restricted the Nuker fit to start at this projected distance, it is not surprising that few galaxies in this sample returned . Because of this close agreement in most cases, the statistics discussed below do not depend on the choice of γ or . For a broader range of ETGs, however, γ and are more commonly discrepant (Lauer et al. 2005). Fits to bluer mosaics would allow for more central measurements, but dust would further complicate the interpretation.


The best-fitting Nuker parameters in Table 4 show the outer slopes to be fairly steep, with a median and standard deviation β ∼ 1.6 ± 0.4, although a few cases (especially NGC 612 and NGC 6861) prefer much steeper outer slopes. In every case, we see a distinct break between the inner and outer power-law slopes. Over half our targets have a shallow inner power-law slope with γ ≤ 0.3, often used to identify centrally cored galaxies (Faber et al. 1997). Unsurprisingly for the typically higher stellar masses in our sample, only a few systems show an inner power-law behavior of γ ≥ 0.5. The remainder (nearly a quarter) of the sample are "intermediate" cases with 0.3 < γ < 0.5 (for additional examples, see Ravindranath et al. 2001 and Rest et al. 2001). When split into elliptical and lenticular subclassifications, we find distinct medians γ = 0.04 and 0.31, respectively, but similar overall scatters. This behavior is easily seen in the surface-brightness plots of Figure 7, especially after scaling the isophotal intensities by μb,H and Rb. A restricted analysis of the most cored ETGs (with γ < 0.2) gives a median MK ∼ −25.29 mag that is ∼60% more luminous than for the entire sample. These most cored ETGs also show a closer correspondence between the break radius and CND extent, with a median Rb/adust,H ≈ 1, although individual ratios range from 0.1 to 2.1.

Figure 7. H-band surface-brightness profiles for this ETG sample, showing best-fitting MGE models (left) and the isophotal intensities (right). The isophotal results are normalized to their respective break radii Rb and corresponding surface brightness μb,H , with the (intrinsic) Nuker profiles shown for comparison (inset). Highlighted BCGs/BGGs tend to show lower μb,H , especially for the only BCG, Hydra A. NGC 6861 is the only exception, largely due to its slightly more cuspy profile.
Download figure:
Standard image High-resolution imageTable 4. Nuker Fitting Parameters
| Galaxy | μb,H | Rb | α | β | γ | |
|---|---|---|---|---|---|---|
| Name | (mag arcsec−2) | (arcsec) | ||||
| (1) | (2) | (3) | (4) | (5) | (6) | (7) |
| Hydra A | 16.28 | 1.16 | 3.73 | 1.31 | 0.04 | 0.04 |
| NGC 612 | 15.72 | 4.12 | 1.66 | 2.71 | 0.27 | 0.28 |
| NGC 997 | 13.97 | 0.69 | 1.25 | 1.74 | 0.00 | 0.18 |
| NGC 1332 | 13.28 | 1.65 | 0.98 | 1.54 | 0.31 | 0.40 |
| NGC 1387 | 14.35 | 3.25 | 0.98 | 2.23 | 0.37 | 0.44 |
| NGC 3245 | 13.01 | 0.91 | 1.41 | 1.55 | 0.36 | 0.42 |
| NGC 3258 | 14.43 | 1.96 | 1.44 | 1.96 | 0.01 | 0.04 |
| NGC 3268 | 14.09 | 1.43 | 2.67 | 1.59 | 0.05 | 0.05 |
| NGC 3271 | 14.80 | 3.50 | 5.90 | 1.81 | 0.64 | 0.64 |
| NGC 3557 | 13.53 | 1.69 | 1.75 | 1.63 | 0.01 | 0.03 |
| NGC 3862 | 14.56 | 1.00 | 2.29 | 1.76 | 0.00 | 0.01 |
| NGC 4061 | 14.48 | 0.97 | 1.50 | 1.88 | 0.04 | 0.12 |
| NGC 4261 | 13.83 | 1.86 | 2.14 | 1.49 | 0.02 | 0.02 |
| NGC 4373a | 12.94 | 0.39 | 2.15 | 1.24 | 0.25 | 0.32 |
| NGC 4429 | 14.34 | 3.51 | 10.00* | 1.26 | 0.64 | 0.64 |
| NGC 4435 | 13.63 | 1.76 | 1.11 | 1.66 | 0.23 | 0.30 |
| NGC 4697 | 13.63 | 2.40 | 0.97 | 1.47 | 0.40 | 0.46 |
| NGC 4751 | 12.46 | 0.55 | 2.32 | 1.28 | 0.45 | 0.47 |
| NGC 4786 | 13.58 | 0.65 | 2.99 | 1.24 | 0.15 | 0.16 |
| NGC 4797 | 13.55 | 0.24 | 3.01 | 1.20 | 0.27 | 0.37 |
| NGC 5084 | 12.90 | 1.04 | 2.21 | 1.18 | 0.25 | 0.26 |
| NGC 5193 | 14.01 | 1.10 | 2.71 | 1.48 | 0.41 | 0.41 |
| NGC 5208 | 14.84 | 2.47 | 10.00* | 1.35 | 0.70 | 0.70 |
| NGC 5838 | 14.34 | 3.01 | 1.15 | 1.82 | 0.64 | 0.67 |
| NGC 6861 | 15.07 | 6.64 | 0.73 | 2.94 | 0.13 | 0.27 |
| NGC 6958 | 12.79 | 0.63 | 1.06 | 1.78 | 0.22 | 0.45 |

Notes. Results of Nuker fits to the H-band isophotal surface-brightness intensities, which account for telescope resolution effects by blurring the intrinsic Nuker function by the Tiny Tim PSF. The above Rb and γ represent the intrinsic break radius and inner power-law slope, respectively. The slope is the slope of the intrinsic Nuker function evaluated at the resolution limit of ∼012. Cases denoted with * indicate α was fixed to avoid unphysical solutions.

Download table as: ASCIITypeset image
5. Stellar Luminosity Models
We modeled the sky-subtracted H-band surface brightnesses of our galaxies using the MGE formalism (Emsellem et al. 1994), which is convenient for analytical purposes and has been shown to accurately reproduce the stellar profiles of ETGs (see also Cappellari 2002). This series expansion recovers the peak surface brightness (in L⊙ pc−2 units) of each Gaussian component, together with projected dispersions (in arcsec) and axis ratios . In addition to the benefits of the speed and usability of MGEs, this approach also enables simple and efficient convolution with a PSF model to account for blurring effects. In this project, we have employed a 2D concentric MGE and focus on fits that keep the PAs of all Gaussian components tied together during optimization. The ensuing deprojection using the inclination angle i (assuming oblate axisymmetry to determine intrinsic σ and q; Cappellari 2002) then results in an intrinsic stellar luminosity density profile. We note that nonparametric approaches allow for more careful deprojection analysis (e.g., reconstruction of intrinsic densities and comparison of the relative likelihood of different deprojections; de Nicola et al. 2020). Since the ALMA CO kinematics do not typically probe beyond ∼1 kpc and rarely close to Re (Boizelle et al. 2017; Ruffa et al. 2019b; Sansom et al. 2019), however, uncertainties in the deprojection and the large-scale stellar figure are not expected to be of significant concern for gas-dynamical modeling efforts.


We first modeled the 2D surface-brightness values using the MGE method presented by Cappellari (2002), using a linear decomposition to determine initial MGE component numbers and Gaussian parameters. However, the Cappellari (2002) code requires a symmetric approximation to the PSF shape. For our final H-band MGE solutions, we perform the decomposition using the 2D parametric galaxy-fitting algorithm GALFIT (Peng et al. 2010), including the Tiny Tim F160W PSF to account for blurring effects. The final MGE solutions presented in Table 5 include between seven and 16 components. In both MGE approaches, we corrected for foreground Galactic reddening (AGal,H ; Table 1) and employed the primary and dust masks described in Section 3.1 to mitigate the impact of circumnuclear dust during the optimization. The best-fitting MGEs are overlaid on the observed images in zoom-in plots in Figure 5 and nearly full-frame mosaics in Figure 8. Comparisons between 1D surface-brightness profiles extracted from the 2D HST data and MGE models are provided in Appendix A. Three ETGs (NGC 3557, NGC 3862, and NGC 4261) are Fanaroff–Riley type I (or FR-I; i.e., edge-darkened; Fanaroff & Riley 1974) radio galaxies, while another (NGC 4429) is sometimes classified as a low-luminosity AGN (Ho et al. 1997; Nyland et al. 2016). For these targets, preliminary MGE fits preferred the inclusion of nearly unresolved components, which plausibly are due to nonstellar processes. In the final MGEs for these four galaxies, we included PSF components to model and remove possible AGN contributions. Interestingly, only one galaxy (NGC 3862) possesses a prominent H-band point source; for another two (NGC 3557 and NGC 4261), the PSF component is entirely negligible, while for one galaxy (NGC 4429), the point source may represent a very compact stellar component.

Figure 8. Nearly full-frame HST WFC3/F160W mosaics, together with the (dust-masked) GALFIT MGE solutions (overplotted in red) that fit a uniform PA for all components. At larger radii, some galaxies exhibit highly flattened stellar isophotes and/or PA⋆ twists, resulting in unavoidable discrepancies. Contours are shown at logarithmic intensity intervals.
Download figure:
Standard image High-resolution imageTable 5. MGE Parameters (with a Uniform PA)
| j | ||||||||||||
|---|---|---|---|---|---|---|---|---|---|---|---|---|
| (L☉ pc−2) | (arcsec) | (L☉ pc−2) | (arcsec) | (L☉ pc−2) | (arcsec) | (L☉ pc−2) | (arcsec) | |||||
| (1) | (2) | (3) | (4) | (2) | (3) | (4) | (2) | (3) | (4) | (2) | (3) | (4) |
| PA = −41.2 | PA = −6.3 | PA = 32.3 | PA = −63.5 | |||||||||
| Hydra A | NGC 612 | NGC 997 | NGC 1332 | |||||||||
| 1 | 3.4550 | 1.1649 | 0.9952 | 4.2391 | 0.1104 | 1.0000 | 4.5670 | 0.2489 | 0.9100 | 5.7035 | 0.1397 | 0.3338 |
| 2 | 2.9155 | 2.9399 | 0.9060 | 4.1763 | 0.3079 | 0.7770 | 4.2751 | 0.7090 | 0.9118 | 4.2340 | 0.2494 | 0.6765 |
| 3 | 2.1662 | 6.4848 | 0.9790 | 3.8616 | 0.5813 | 1.0000 | 3.9212 | 1.4545 | 0.9387 | 4.9782 | 0.4911 | 0.9816 |
| 4 | 2.0350 | 7.2705 | 0.6890 | 3.4430 | 0.9568 | 1.0000 | 3.4301 | 3.1261 | 0.9100 | 4.6117 | 1.5227 | 0.7291 |
| 5 | 2.1566 | 13.133 | 0.7992 | 3.3977 | 2.3868 | 0.6227 | 2.9587 | 6.5902 | 0.9100 | 4.2075 | 3.4156 | 0.7281 |
| 6 | 1.4121 | 26.732 | 0.6940 | 3.4692 | 3.8908 | 0.2553 | 2.4483 | 13.696 | 0.9100 | 3.8332 | 7.3989 | 0.7688 |
| 7 | 0.9438 | 58.893 | 0.6676 | 3.2055 | 5.0384 | 0.5201 | 1.8333 | 33.844 | 0.9260 | 3.1562 | 17.528 | 0.3178 |
| 8 | ⋯ | ⋯ | ⋯ | 2.9094 | 4.9285 | 0.9815 | ⋯ | ⋯ | ⋯ | 3.0689 | 32.944 | 0.2910 |
| 9 | ⋯ | ⋯ | ⋯ | 3.3356 | 4.1166 | 0.2400 | ⋯ | ⋯ | ⋯ | 2.5357 | 52.074 | 0.3259 |
| 10 | ⋯ | ⋯ | ⋯ | 2.3213 | 12.502 | 0.6161 | ⋯ | ⋯ | ⋯ | 1.8995 | 78.066 | 0.4190 |
| 11 | ⋯ | ⋯ | ⋯ | 2.1723 | 16.296 | 0.9293 | ⋯ | ⋯ | ⋯ | 0.9968 | 165.32 | 0.9901 |
| 12 | ⋯ | ⋯ | ⋯ | 1.3514 | 40.481 | 1.0000 | ⋯ | ⋯ | ⋯ | ⋯ | ⋯ | ⋯ |
| 13 | ⋯ | ⋯ | ⋯ | 0.2425 | 72.318 | 0.9973 | ⋯ | ⋯ | ⋯ | ⋯ | ⋯ | ⋯ |
| PA = −73.2 | PA = –4.3 | PA = 74.6 | PA = 69.7 | |||||||||
| NGC 1387 | NGC 3245 | NGC 3258 | NGC 3268 | |||||||||
| 1 | 5.3554 | 0.1517 | 0.9973 | 5.5227 | 0.1388 | 0.6686 | 4.1386 | 0.7662 | 0.9671 | 3.6153 | 0.2802 | 0.6700 |
| 2 | 4.8519 | 0.5218 | 0.9994 | 4.2977 | 0.2578 | 0.5378 | 4.0292 | 1.1586 | 0.7200 | 3.9109 | 0.9996 | 0.9918 |
| 3 | 4.5377 | 1.6441 | 0.9999 | 4.7789 | 0.3163 | 0.5205 | 3.9129 | 2.0040 | 0.7633 | 3.9752 | 1.0794 | 0.7425 |
| 4 | 4.0769 | 4.0668 | 0.9500 | 4.7368 | 0.3776 | 0.9647 | 3.6336 | 2.9726 | 0.8064 | 3.8462 | 1.9852 | 0.7188 |
| 5 | 3.4977 | 7.1948 | 0.9500 | 4.6770 | 0.6348 | 0.8459 | 3.5087 | 4.8344 | 0.8513 | 3.7069 | 2.2767 | 0.8903 |
| 6 | 2.8663 | 14.983 | 0.9500 | 4.5074 | 1.1201 | 0.9631 | 2.6360 | 8.9900 | 0.8158 | 3.4637 | 3.8058 | 0.7805 |
| 7 | 2.4841 | 40.343 | 0.9624 | 4.0375 | 2.5263 | 0.6386 | 2.9576 | 11.511 | 0.9348 | 3.2626 | 6.3293 | 0.8090 |
| 8 | ⋯ | ⋯ | ⋯ | 3.8275 | 3.2671 | 0.7809 | 2.2148 | 22.281 | 0.9800 | 2.8091 | 12.075 | 0.7841 |
| 9 | ⋯ | ⋯ | ⋯ | 3.5080 | 8.9091 | 0.5200 | 2.0012 | 47.787 | 0.7872 | 2.4624 | 21.504 | 0.8048 |
| 10 | ⋯ | ⋯ | ⋯ | 2.9232 | 26.569 | 0.5200 | ⋯ | ⋯ | ⋯ | 2.0247 | 51.639 | 0.7253 |
| 11 | ⋯ | ⋯ | ⋯ | 1.7579 | 44.971 | 0.5681 | ⋯ | ⋯ | ⋯ | 1.5208 | 87.993 | 0.9289 |
| 12 | ⋯ | ⋯ | ⋯ | 1.5658 | 52.299 | 0.6091 | ⋯ | ⋯ | ⋯ | ⋯ | ⋯ | ⋯ |
| 13 | ⋯ | ⋯ | ⋯ | 1.1653 | 162.32 | 0.7948 | ⋯ | ⋯ | ⋯ | ⋯ | ⋯ | ⋯ |
| PA = −67.9 | PA = 33.5 | PA = 20.1 | PA = −4.5 | |||||||||
| NGC 3271 | NGC 3557* | NGC 3862* | NGC 4061 | |||||||||
| 1 | 4.9009 | 0.1000 | 0.7376 | 4.2304 | 0.8510 | 0.9866 | 4.1542 | 0.7628 | 0.9900 | 4.1285 | 0.1755 | 0.6600 |
| 2 | 5.1274 | 0.1299 | 0.7300 | 4.3214 | 1.2778 | 0.7500 | 3.7966 | 1.4370 | 0.9940 | 4.2827 | 0.5379 | 0.6600 |
| 3 | 4.5963 | 0.3489 | 0.8362 | 3.9536 | 2.0599 | 0.7500 | 3.4906 | 2.9353 | 0.9910 | 3.7328 | 1.0829 | 0.9533 |
| 4 | 4.2135 | 0.9666 | 0.7307 | 4.0190 | 2.9514 | 0.7500 | 2.7847 | 7.0954 | 0.9933 | 3.6122 | 1.2839 | 0.6600 |
| 5 | 4.0445 | 2.4260 | 0.7300 | 3.7178 | 4.5401 | 0.7613 | 2.2149 | 18.472 | 0.9900 | 3.5582 | 2.1409 | 0.8016 |
| 6 | 3.7112 | 3.8030 | 0.7300 | 3.4740 | 6.8297 | 0.7535 | 1.7046 | 58.754 | 0.9900 | 3.1855 | 3.7517 | 0.8240 |
| 7 | 3.3835 | 6.9061 | 0.7300 | 2.8595 | 11.632 | 0.7500 | PSF mag = 15.86 | 2.4901 | 6.1372 | 0.9569 | ||
| 8 | 2.8441 | 18.027 | 0.7300 | 3.0156 | 13.000 | 0.7500 | ⋯ | ⋯ | ⋯ | 2.2961 | 8.1515 | 0.6600 |
| 9 | 1.9464 | 26.205 | 0.7300 | 2.6283 | 22.466 | 0.7500 | ⋯ | ⋯ | ⋯ | 2.2072 | 12.643 | 0.8367 |
| 10 | 1.8515 | 52.723 | 0.7300 | 2.5442 | 36.827 | 0.7500 | ⋯ | ⋯ | ⋯ | 1.5922 | 20.997 | 0.7836 |
| 11 | 1.2997 | 74.622 | 0.7300 | 2.0470 | 77.856 | 0.8731 | ⋯ | ⋯ | ⋯ | 1.5933 | 34.329 | 0.6985 |
| 12 | ⋯ | ⋯ | ⋯ | PSF mag = 18.08 | ⋯ | ⋯ | ⋯ | 1.0584 | 85.239 | 0.7238 | ||
| PA = −22.4 | PA = −30.8 | PA = −87.0 | PA = 3.3 | |||||||||
| NGC 4261* | NGC 4373a | NGC 4429* | NGC 4435 | |||||||||
| 1 | 4.3308 | 1.1185 | 0.8196 | 5.1773 | 0.1233 | 0.5200 | 5.3069 | 0.1099 | 0.8506 | 5.1425 | 0.1893 | 0.4802 |
| 2 | 4.0992 | 2.1932 | 0.7100 | 4.8418 | 0.3496 | 0.5200 | 4.8497 | 0.3361 | 0.5700 | 4.6328 | 0.5244 | 0.7973 |
| 3 | 3.9663 | 3.7243 | 0.7296 | 4.2347 | 1.0068 | 0.5751 | 4.2484 | 0.7858 | 0.7150 | 4.3501 | 1.2024 | 0.7934 |
| 4 | 3.0013 | 6.4422 | 0.7197 | 3.9133 | 2.1370 | 0.5750 | 4.2296 | 2.4506 | 0.5700 | 4.2373 | 2.3678 | 0.6816 |
| 5 | 3.3153 | 8.3663 | 0.7143 | 3.4648 | 4.7480 | 0.7467 | 3.5629 | 2.8757 | 0.8448 | 3.9737 | 4.4603 | 0.7654 |
| 6 | 3.1800 | 12.611 | 0.8225 | 3.0984 | 12.208 | 0.5200 | 3.8536 | 5.5932 | 0.6529 | 3.2103 | 11.771 | 0.4306 |
| 7 | 2.7880 | 19.928 | 0.8384 | 2.2347 | 29.124 | 0.5200 | 3.1773 | 11.419 | 0.5802 | 3.0833 | 16.253 | 0.4100 |
| 8 | 1.7008 | 40.664 | 0.8175 | 1.7128 | 55.969 | 0.5200 | 3.2655 | 16.358 | 0.5700 | 2.5444 | 17.346 | 0.9515 |
| 9 | 2.3330 | 45.887 | 0.8349 | 0.5813 | 131.04 | 0.9992 | 2.8525 | 48.696 | 0.5700 | 2.4697 | 31.458 | 0.5049 |
| 10 | 1.7869 | 94.857 | 0.9587 | ⋯ | ⋯ | ⋯ | 1.9408 | 118.45 | 0.5700 | 1.8732 | 49.121 | 0.9890 |
| 11 | PSF mag = 20.07 | ⋯ | ⋯ | ⋯ | PSF mag = 16.21 | 1.3577 | 101.44 | 0.5399 | ||||
| PA = 66.2 | PA = −5.0 | PA = −16.8 | PA = 26.3 | |||||||||
| NGC 4697 | NGC 4751 | NGC 4786 | NGC 4797 | |||||||||
| 1 | 5.5120 | 0.1000 | 0.7453 | 6.0202 | 0.1000 | 0.3500 | 4.3138 | 0.3212 | 0.9949 | 4.9958 | 0.1333 | 0.5900 |
| 2 | 5.4715 | 0.1236 | 0.6153 | 5.5755 | 0.2453 | 0.3500 | 4.4351 | 0.5693 | 0.7301 | 4.2163 | 0.4415 | 0.7869 |
| 3 | 4.8797 | 0.4738 | 0.7300 | 4.4010 | 0.5827 | 0.9960 | 4.1774 | 1.2630 | 0.8189 | 3.7328 | 0.8758 | 0.9757 |
| 4 | 4.5620 | 1.0639 | 0.7217 | 4.4902 | 0.9176 | 0.6279 | 3.5661 | 2.7314 | 0.7362 | 3.3653 | 1.8072 | 0.9995 |
| 5 | 3.7315 | 2.2062 | 0.9995 | 4.2328 | 1.8856 | 0.6385 | 3.4393 | 4.7352 | 0.8107 | 2.3105 | 3.5312 | 0.9926 |
| 6 | 4.2744 | 2.5638 | 0.4424 | 3.8944 | 4.2760 | 0.4700 | 2.5924 | 5.7134 | 0.8857 | 2.6645 | 4.2037 | 0.9986 |
| 7 | 3.8680 | 5.3112 | 0.4314 | 3.3600 | 8.4109 | 0.4177 | 2.5916 | 7.8986 | 0.6900 | 2.8346 | 7.7950 | 0.7230 |
| 8 | 3.5558 | 5.7133 | 0.6784 | 3.0034 | 15.594 | 0.4118 | 2.6872 | 12.792 | 0.6900 | 2.2715 | 15.781 | 0.6797 |
| 9 | 3.5033 | 9.6667 | 0.6891 | 2.5027 | 34.328 | 0.3974 | 2.3202 | 14.940 | 0.8763 | 1.6517 | 27.516 | 0.9771 |
| 10 | 2.9935 | 13.712 | 0.4000 | 1.7134 | 73.467 | 0.5006 | 2.1339 | 23.646 | 0.6900 | ⋯ | ⋯ | ⋯ |
| 11 | 2.9662 | 22.580 | 0.5165 | 0.7030 | 146.91 | 0.9050 | 1.7691 | 27.513 | 0.9666 | ⋯ | ⋯ | ⋯ |
| 12 | 2.7202 | 24.715 | 0.4000 | ⋯ | ⋯ | ⋯ | 0.5270 | 45.221 | 0.6900 | ⋯ | ⋯ | ⋯ |
| 13 | 2.8995 | 34.303 | 0.5967 | ⋯ | ⋯ | ⋯ | 1.3639 | 59.220 | 0.6900 | ⋯ | ⋯ | ⋯ |
| 14 | 2.5434 | 55.874 | 0.6750 | ⋯ | ⋯ | ⋯ | 1.0990 | 113.70 | 0.9629 | ⋯ | ⋯ | ⋯ |
| 15 | 2.0244 | 124.23 | 0.7377 | ⋯ | ⋯ | ⋯ | ⋯ | ⋯ | ⋯ | ⋯ | ⋯ | ⋯ |
| PA = 82.3 | PA = 71.6 | PA = −16.0 | PA = 51.0 | |||||||||
| NGC 5084 | NGC 5193 | NGC 5208 | NGC 5838 | |||||||||
| 1 | 5.1227 | 0.1000 | 0.7858 | 5.2662 | 0.1000 | 0.7500 | 4.7950 | 0.1000 | 0.3100 | 5.5656 | 0.1000 | 0.8742 |
| 2 | 4.6764 | 0.4351 | 0.8559 | 4.3592 | 0.4554 | 0.7500 | 4.8307 | 0.2316 | 0.6493 | 5.3226 | 0.1947 | 0.5600 |
| 3 | 4.5923 | 0.8891 | 0.8820 | 4.3354 | 0.9520 | 0.7521 | 4.1829 | 0.5332 | 0.6768 | 4.9145 | 0.4656 | 0.9589 |
| 4 | 4.4636 | 1.9107 | 0.7429 | 3.9680 | 2.0043 | 0.8089 | 3.8734 | 1.2505 | 0.5766 | 4.4015 | 1.1427 | 0.7839 |
| 5 | 4.0177 | 4.6884 | 0.5300 | 3.4391 | 4.6440 | 0.7500 | 3.8380 | 1.6389 | 0.3100 | 4.2892 | 2.1774 | 0.7211 |
| 6 | 3.6368 | 8.7730 | 0.5300 | 3.0292 | 9.7925 | 0.8458 | 3.5770 | 2.3291 | 0.5421 | 3.8977 | 4.4992 | 0.8763 |
| 7 | 3.1031 | 19.560 | 0.5300 | 2.5007 | 18.614 | 0.9834 | 3.5117 | 5.6546 | 0.3100 | 3.3867 | 9.6607 | 0.5895 |
| 8 | 2.4936 | 36.864 | 0.5300 | 1.6639 | 46.271 | 0.9489 | 3.1005 | 6.0425 | 0.5237 | 2.8370 | 16.244 | 0.5721 |
| 9 | 2.3514 | 67.627 | 0.5300 | ⋯ | ⋯ | ⋯ | 2.3435 | 11.394 | 0.3100 | 2.6329 | 40.231 | 0.5600 |
| 10 | ⋯ | ⋯ | ⋯ | ⋯ | ⋯ | ⋯ | 2.4322 | 14.318 | 0.3100 | 1.0379 | 77.003 | 0.5600 |
| 11 | ⋯ | ⋯ | ⋯ | ⋯ | ⋯ | ⋯ | 2.3642 | 16.032 | 0.4188 | ⋯ | ⋯ | ⋯ |
| 12 | ⋯ | ⋯ | ⋯ | ⋯ | ⋯ | ⋯ | 1.6524 | 5.3184 | 0.3100 | ⋯ | ⋯ | ⋯ |
| 13 | ⋯ | ⋯ | ⋯ | ⋯ | ⋯ | ⋯ | 1.4263 | 31.042 | 0.3904 | ⋯ | ⋯ | ⋯ |
| 14 | ⋯ | ⋯ | ⋯ | ⋯ | ⋯ | ⋯ | 1.6982 | 33.695 | 0.4090 | ⋯ | ⋯ | ⋯ |
| 15 | ⋯ | ⋯ | ⋯ | ⋯ | ⋯ | ⋯ | 0.6420 | 95.995 | 0.8543 | ⋯ | ⋯ | ⋯ |
| 16 | ⋯ | ⋯ | ⋯ | ⋯ | ⋯ | ⋯ | 0.6480 | 155.22 | 0.9660 | ⋯ | ⋯ | ⋯ |
| PA = −37.8 | PA = −70.0 | |||||||||||
| NGC 6861 | NGC 6958 | |||||||||||
| 1 | 4.8218 | 0.1000 | 0.9551 | 4.1856 | 0.3370 | 0.9522 | ||||||
| 2 | 4.8781 | 0.1848 | 0.9616 | 5.3515 | 0.1778 | 0.9821 | ||||||
| 3 | 4.8722 | 0.4997 | 0.3800 | 4.7191 | 0.5959 | 0.9500 | ||||||
| 4 | 4.5842 | 0.6501 | 0.9987 | 4.3206 | 1.4124 | 0.9500 | ||||||
| 5 | 4.3006 | 1.5022 | 0.7994 | 3.9184 | 3.0309 | 0.9500 | ||||||
| 6 | 4.2191 | 3.5366 | 0.4737 | 3.1345 | 7.0509 | 0.9500 | ||||||
| 7 | 3.6247 | 4.2202 | 0.8086 | 2.8078 | 13.863 | 0.9500 | ||||||
| 8 | 3.6606 | 7.1797 | 0.4464 | 1.9595 | 32.998 | 0.9500 | ||||||
| 9 | 3.2430 | 11.910 | 0.4823 | 1.5971 | 41.903 | 0.9500 | ||||||
| 10 | 2.7818 | 12.513 | 0.6765 | 0.7920 | 101.15 | 0.9500 | ||||||
| 11 | 2.6121 | 24.214 | 0.4561 | ⋯ | ⋯ | ⋯ | ||||||
| 12 | 2.3514 | 27.307 | 0.7340 | ⋯ | ⋯ | ⋯ | ||||||
| 13 | 1.6972 | 52.467 | 0.9997 | ⋯ | ⋯ | ⋯ | ||||||
| 14 | 1.6257 | 50.880 | 0.4998 | ⋯ | ⋯ | ⋯ | ||||||
| 15 | 1.1636 | 116.86 | 0.9908 | ⋯ | ⋯ | ⋯ | ||||||


Notes. Individual Gaussian components (indexed by j) from the best-fitting MGE for each galaxy in this H-band sample, after masking out neighboring galaxies, foreground stars, and the most dust-obscured regions of the CND. Projected terms are indicated by a . During these fits, the individual values were constrained to be equal to or greater than the limit (listed for each galaxy), which ensured the solution could be deprojected for a range of inclination angles. Inner were constrained to ≳01 to avoid overly compact stellar distributions. For four of these ETGs (indicated with a *), we included an unresolved point source in the modeling process to remove contamination from known, prominent AGNs in the H band. The magnitudes of these PSF components are given in such cases.


From these MGEs, we estimated an effective radius by calculating the radius enclosing half the light, so L( < Re) = Ltot/2. Following standard practice (e.g., ATLAS3D; Cappellari et al. 2013), we integrated the light on elliptical annuli to find the half-light radius, which corresponds to the circularized . We report these Re in Table 1, and use them to compare PA⋆ and ε⋆ trends in Figure 6. We note that the H-band Re for targets also contained in ATLAS3D are ∼20% smaller on average than r-band estimates, which is expected due to the observed color gradients (Ma et al. 2014). For the three targets in MASSIVE, we find systemically higher Re than those measured from near-IR Two Micron All Sky Survey (2MASS) data, although for the two with the largest discrepancies (∼3× higher) the limiting 2MASS depth may not probe sufficiently far into the stellar halo.

Left unconstrained, the MGE optimization process often drives the innermost component(s) to low values. Some CND regions that fall below the Δ(J − H) masking criteria may contribute to modestly attenuated stellar light just beyond the nucleus. The result may be the illusion of a centrally compact source (e.g., Bonfini et al. 2018) that is better fit using MGE component(s) with small dispersions (, typically corresponding to 10−30 pc for this sample). When deprojected, these inner component(s) translate to very centrally concentrated stellar luminosity densities. If relatively isolated from adjacent component(s), these compact Gaussian(s) result in peaky circular velocity contributions vc,⋆ in the inner few × 10 pc without clear justification given the PSF FWHM and the inner power-law slope γ. To avoid complications, we limited to ensure these vc,⋆ did not translate to stellar mass structure within the H-band resolution limit. Other approaches do allow for smaller (e.g., fitting tightly spaced MGE components to analytic functions; Yıldırım et al. 2017) but are best suited to ETGs without dusty CNDs or with higher γ ≳ 1, for which a truncated could produce very inaccurate central stellar luminosity densities.


Individual Gaussian components generally do not have physical meaning. However, low for individual components may fall below for an assumed i, effectively preventing deprojection for oblate axisymmetry. Full gas-dynamical modeling is beyond the scope of this paper, so instead we estimated . In a limited number of comparisons between and the average kinematic inclination angle, this proxy has been accurate to within ∼4° (see Barth et al. 2016b; Boizelle et al. 2017, 2019). To ensure that the MGE solutions can be deprojected for a range of reasonable inclination angles about the assumed i, we set a limiting , where Δi increases approximately uniformly from 5° to 15° for disks with i ≥ 80° down to i ≤ 25°, respectively. In most cases, this constraint does not severely limit the MGE optimization process, although best-fitting MGEs are sometimes noticeably affected as a result, (especially for NGC 997, NGC 3271, NGC 3557, NGC 3862, and NGC 6958). However, this buffer Δi is unavoidable and better ensures that gas-dynamical models can explore the full parameter space without deprojection errors. We note that stellar-dynamical modeling typically requires a larger buffer due to the intrinsic galaxy thickness and the optimization of additional intrinsic galaxy viewing angles. Since our primary goal is to aid future ALMA CO work, we restrict ourselves to the Δi ranges noted above.


![$i\approx {\cos }^{-1}[{(b/a)}_{\mathrm{dust},H}]$](https://content.cld.iop.org/journals/0004-637X/972/1/127/revision1/apjad5be4ieqn71.gif)
![${\cos }^{-1}[{(b/a)}_{\mathrm{dust},H}]$](https://content.cld.iop.org/journals/0004-637X/972/1/127/revision1/apjad5be4ieqn72.gif)
![${q}^{{\prime} }{}_{\min }=\cos [{\cos }^{-1}{(b/a)}_{\mathrm{dust},H}-{\rm{\Delta }}i]$](https://content.cld.iop.org/journals/0004-637X/972/1/127/revision1/apjad5be4ieqn73.gif)

The MGE parameter values change slightly when we use the Tiny Tim rather than the empirical PSF. To quantify the maximal impact of adopting only Tiny Tim PSFs, we also constructed an MGE of the NGC 3862 H-band mosaic using the empirical PSF following the outlined method. This target has the most prominent AGN in the sample, and any mismatch of the point-source component is expected to affect the peak surface brightness and FWHM of the centermost MGE component(s). In Figure 9, we demonstrate the overall good agreement for the two PSFs. The empirical PSF results in a somewhat better fit to the inner 1'', although the MGEs become practically identical much further out. The empirical PSF also leads to vc,⋆(r) with slightly smaller velocities (≲10 km s−1) out to 2.5 kpc or ∼6Rdust,H . These findings are consistent with the conclusion of Zhao et al. (2021) that an empirical PSF leads to (slightly) better fits. Since our targets do not have strong central point sources at near-IR wavelengths, we expect the Tiny Tim–derived MGEs will be sufficiently accurate for ongoing gas-dynamical modeling.

Figure 9. The H-band Tiny Tim PSF response for NGC 3862, showing both drizzled Tiny Tim (upper left) and empirical (lower left) PSFs that extend to at least an arcsecond. For this target, GALFIT models simultaneously fit both a point source and an MGE using the Tiny Tim and empirical PSFs in turn (middle). These show minimal differences in the central PSF and minor changes in the inner couple of MGE components, with generally good agreement (lower middle) with the data. The corresponding midplane circular velocity curves (right) arising from the different stellar MGE approaches show only small (≲10 km s−1) discrepancies at all radii.
Download figure:
Standard image High-resolution imagePhotometric PA twists are common in this sample, and accounting for these PA twists results in better overall fits and can be useful for stellar-dynamical efforts that explore triaxality (e.g., van den Bosch et al. 2008; Krajnović et al. 2011; Liepold et al. 2023). However, allowing for a variable PA between Gaussian components prevents a simple deprojection. In Appendix B, we report GALFIT MGE solutions that allow for PAs that differ between components.
6. Discussion
6.1. Goodness-of-fit
As is shown in Figure 8, the 2D GALFIT fits to each H-band mosaic typically give good global agreement, with formal χ2 per degree of freedom approaching unity. More importantly, fractional residuals along the galaxy major axis are typically smaller than ∼10%. Cases with more serious discrepancies result from either steep rises in ε⋆ or large ΔPA⋆, and we discuss each in turn. However, we demonstrate in Figure 5 that these large-scale discrepancies have negligible impact on the fidelity of the central MGE fit.
In contrast, limitations affect nearly every MGE solution here, with two-thirds of our sample having two or more components whose . However, these are needed to allow for reasonable deprojection in gas-dynamical modeling. For most elliptical galaxies, does not seem to affect the quality of the MGE fits, while other stellar properties like ΔPA⋆ and increasing ε⋆ from nearly round isophotes (e.g., NGC 3862) create tension with the CND properties. Large increases in ε⋆ for a third of the lenticular galaxies (Δε⋆ > 0.2; NGC 1387, NGC 3271, NGC 4373a, NGC 4429, and NGC 5838) result in poorer overall fits at intermediate (or larger) R. MGE fits for two of the three barred lenticular galaxies (NGC 1387 and NGC 3271) are good examples (see also Figures 15 and 19): over R ∼ 10''–35'', the poorest-fit regions result from sharp rises in ellipticity (and, for NGC 3271, a PA⋆ shift) near where the stellar bar becomes dominant (Bettoni & Galletta 1997; Gadotti & de Souza 2005), with ε⋆ greatly exceeding the maximum allowable ∼0.05 level.


Fully half of the ETGs have much smaller ΔPA⋆ < 15°, which is more indicative of relaxed systems; just under a quarter have ΔPA⋆ ≳ 40°, with most of the shift manifesting at large R. However, such large ΔPA⋆ does not always result in visibly worse MGE fits. For example, Hydra A and NGC 3862 show circular inner isophotes with most of the ΔPA⋆ occurring where ε⋆ remains low. In others (e.g., NGC 4061 and NGC 5193; Figures 22 and 32) this ΔPA⋆ is largely confined to the outermost few radial bins.
The large angular extents and high Δ(J − H) of some CNDs preclude minimal dust masking, possibly leading to less robust central MGE components. The primary example is NGC 612, which contains a large dusty disk (Rdust,H ∼ 20'') that shows evidence for star formation (Duah Asabere et al. 2016) and moderate (∼20°) disk warping in both PA and i. Even in its H-band mosaic, excess light from star formation and opaque dust necessitates masking nearly the entire disk region and nucleus (see Figures 4 and 5). As reported in Table 5, the first nine MGE components have that are smaller than the semimajor axis extent (∼10'') of the more regularly shaped inner disk. Because of the heavy masking, the innermost MGE components are constrained by relatively few data points. At least two other cases have large projected disk sizes (Rdust,H ∼ 5''–10'') and roughly uniform near-IR colors. First, NGC 997 hosts a more face-on (i ∼ 5°) CND for which we masked all of the near side (and much of the far side) of the disk. Second, NGC 1387 is similarly inclined, and its near-IR colors approach (but do not exceed) the Δ(J − H) ≳ 0.08 mag masking criterion. As a result, we do not mask any dust regions for NGC 1387.

Internal dust-disk structure gives rise to additional complications when evaluating an MGE. For a galaxy with moderate disk warping, most noticeably within NGC 612 and NGC 4797, it is not clear that (b/a)dust,H measured from near the CND edge is always a good proxy for the galaxy's midplane inclination. Even in beam-smeared ALMA CO moment 1 (velocity) maps, Boizelle et al. (2017, 2019) found that (where qCO is the CO kinematic axis ratio) changes by 5°–10° at larger radii for four CNDs in our sample. Two targets (NGC 3557 and NGC 4261) show CO kinematics that are moderately misaligned with the radio jet orientation (at the 10°−50° level; Ruffa et al. 2019b, 2020; Boizelle et al. 2021), at least at the resolution limit, suggesting there may be sharp twists in the PA (and plausibly i) of the innermost CO kinematics.
![$i(R)\approx {\cos }^{-1}[{q}_{\mathrm{CO}}(R)]$](https://content.cld.iop.org/journals/0004-637X/972/1/127/revision1/apjad5be4ieqn80.gif)
6.2. Accuracy and Consistency of the MGE Solutions
It is not trivial to compare the efficacy of MGE solutions that differ significantly in wavelength and/or construction given sparse case studies in dynamical modeling (see, e.g., Barth et al. 2016b). Nor do we attempt to compare the MGE-derived circular velocity profiles to the ALMA CO kinematics. Instead, we use a few MGE solutions and a circular velocity profile from the literature to explore the accuracy and consistency of the MGE solutions in Table 5.
The same underlying H-band data were used by Boizelle et al. (2019, 2021) to construct dust-masked MGEs for two ETGs in this sample (NGC 3258 and NGC 4261), albeit with slight differences in mosaic construction, dust masking, and the number of Gaussian components. We used the different H-band MGEs to derive both the stellar-only (vc,⋆) and total (vc) circular velocities and the enclosed (spherical) mass distribution M(<r) as a function of the physical distance r in the galaxy's midplane. These vc(r) and M(<r) were constructed using codes in the Jeans Anisotropic Models package (Cappellari 2008) after assuming oblate axisymmetry, an inclination angle , (literature or estimated) MBH values, and a uniform M/LH = 1.5 M⊙/L⊙ ,H based on single stellar population models (Vazdekis et al. 2010). Dark matter contributions were assumed to be negligible within the central few kiloparsecs for such galaxies (De Bruyne et al. 2004), and gas mass contributions likewise contribute little to vc (e.g., Boizelle et al. 2019, 2021; Cohn et al. 2021; Kabasares et al. 2022). Within the disk extent, we find the different vc,⋆ disagree by at most 10% and become indistinguishable much beyond Rdust,H , suggesting little impact on gas-dynamical modeling. For NGC 3258, Boizelle et al. (2021) find that the intrinsic velocity due to all extended mass components is higher than the dust-masked vc,⋆, as expected, reaching a maximum discrepancy of ∼40 km s−1 but a typical discrepancy closer to 20 km s−1 over most of the disk.
![$i\approx {\cos }^{-1}[{(b/a)}_{\mathrm{dust},H}]$](https://content.cld.iop.org/journals/0004-637X/972/1/127/revision1/apjad5be4ieqn81.gif)
The velocity differences become more serious when comparing near-IR and optically derived MGEs. Two cases (NGC 3557 and NGC 4429) provide useful case studies. Using the optical MGEs and best-fit M/L—F555W, ignoring the first component (Ruffa et al. 2019a) and F606W (Davis et al. 2018)—we scaled M/LH so that the M(<r) profiles match a little beyond Rdust,H , where the CO-bright emission ends. These optical and near-IR MGEs had similar dust masks. We find that the H-band MGEs prefer higher stellar mass and vc,⋆ throughout the CND, reaching excess ∼40 km s−1 at the NGC 3557 disk edge and ∼90 km s−1 near the NGC 4429 nucleus. For both ETGs, the discrepancy seems largely driven by (∼5×) greater dust attenuation at optical wavelengths in the unmasked regions of the CND, together with some evident M/L gradients. The H-band MGEs for both NGC 3557 and NGC 4261 have two Gaussian components with smaller than those of the optical MGEs.

While these dust-masked MGEs provide good overall fits to the H-band mosaics, they may somewhat underestimate the stellar luminosity distributions in the CND regions. Even after careful masking, some residual dust attenuation remains. Based on the Δ(J − H) ≳ 0.08 mag criterion and the discussion in Section 4.1, unmasked dust should suppress the background H-band stellar light by at most ∼25%, and likely much less on average. To explore the maximal possible impact on the stellar luminosity models, we tried increasing the innermost MGE component(s) intensity by up to ∼25% to compensate for remaining dust obscuration in the H band, with the corresponding vc,⋆ typically increasing by only 20−30 km s−1 within or near Rdust,H . Relying on a single (dust-masked) stellar luminosity model may therefore bias a BH mass measurement, and including both dust-masked and dust-corrected MGEs provides a broader but more accurate MBH error budget. For a few cored galaxies, the impact has been relatively minor (Boizelle et al. 2019, 2021), with the MBH shifts ranging between ΔMBH ∼ 10%–20% about a fiducial MBH value and the dust-masked MGEs giving a best-fit MBH at the upper end of this mass range. Those particularly cored galaxies are not fully representative of ΔMBH for the present sample: They have strong, Keplerian-like CO velocity upturns, insulating these BH mass measurements against changes in the stellar mass model. For a few more cuspy ETGs with CO emission that extends down to ∼rg, different stellar mass models (e.g., MGEs constructed in different filters, or using different dust-masking or correction techniques) returns a ΔMBH ranging between 30% and a factor of more than 2 (Barth et al. 2016a, 2016b; Davis et al. 2018; Cohn et al. 2021; Kabasares et al. 2022). However, we stress that none of these more cuspy galaxies unambiguously show CO emission arising from deep within rg, which likely contributes in part to the relatively larger ΔMBH shifts. We anticipate the dust-masked MGE presented here will enable MBH determined with accuracies at the 30% level or slightly better.
Lastly, the near-IR data presented here may not be sufficient to deliver MBH precision even at the 20%–30% level for ETGs with larger-angular-diameter CNDs (especially when viewed more face-on; Davis et al. 2018; Kabasares et al. 2022) and/or for cuspier surface-brightness profiles with higher central Δ(J − H) (see the discussion by Yoon 2017). In such cases, extensive masking at the adopted Δ(J − H) ≳ 0.08 mag level leads to less secure constraints on inner MGE components. For ETGs with large Rdust,H and (b/a)dust,H ∼1, masking difficulties likely result in H-band MGEs that underestimate the intrinsic central stellar light contributions. JWST NIRCam imaging at 4.5−5 μm is likely the best avenue to mitigate the impact of dust and can allow high-quality MGEs to be constructed from data with an angular resolution ∼rg.
6.3. Circular Velocities and the CO Tully–Fisher Relationship
In addition to providing a kinematic tracer of the innermost gravitational potential, ALMA CO measurements are also being used to explore larger-scale baryonic and dark matter properties in the context of the Tully–Fisher (TF) relation (Tully & Fisher 1977). Traditionally, a TF analysis employs large-scale gas disks (often from H i emission at 21 cm) that probe the asymptotic or flat portion of a disk galaxy's rotation curve. Since initial proposals by Dickey & Kazes (1992) and Sofue (1992), CO emission has also been calibrated as a probe of rotational velocity (e.g., Ho 2007; Davis et al. 2011, 2016; Tiley et al. 2016, 2019; Topal et al. 2018), resulting in the CO TF relation. CO velocity profiles are more irregular in general than traditionally used H i profiles (Ho 2007; Smith et al. 2021b), although morphologically round CNDs typically show the characteristic double-horned, sharp-edged CO profiles (sometimes with high-velocity emission in the wings due to central, Keplerian rotation; Boizelle et al. 2017, 2019, 2021; Ruffa et al. 2019b). Previous studies assumed the CO-bright disk probed out to either a maximum circular speed vmax (followed by a turnover) or an asymptotic circular velocity (occurring beyond the vmax radius), and therefore the integrated CO line width would be a good proxy for the bulge mass. However, the CO emission in compact CNDs is unlikely to extend far enough to probe vmax, resulting in smaller integrated CO line widths and incorrect estimation of correlated galaxy properties (e.g., σ⋆, M⋆, MBH; Smith et al. 2021b). Indeed, the CNDs in our sample have a median Rdust,H ∼ 0.4 kpc that is at least half the median CO extent found in volume-limited surveys (Davis et al. 2013). It may be that many of the smaller disks in the volume-limited surveys might have been missed entirely due to sensitivity limitations (e.g., NGC 4261; Young et al. 2011; Boizelle et al. 2021).
To assess the extent to which CO-bright CNDs can masquerade as extended gas disks in spatially unresolved TF relation studies, we explored the resolved vc,⋆ and vc behavior for our sample following the method outlined in Section 6.2. In Figure 10, we plot both vc,⋆ and vc for each ETG as a function of r and after scaling distance by the respective Rdust,H . While the vc velocities upturn within each BH-dominated region (≲rg), this region typically has little to no significant CO emission that could lead to higher integrated CO line widths. In most cases, rg < Rdust,H , and the inferred rotation curves increase noticeably between rg and Rdust,H . Even in cases where CO emission extends well within rg (e.g., NGC 3258; Boizelle et al. 2017, 2019), this Keplerian signature provides at most faint wings to the integrated line profiles and little—if any—change to the measured line widths. Still, the (literature or estimated) MBH help to flatten vc within Rdust,H . About half of these vc reach vmax within the CND (but only for those with Rdust,H ≥ 0.9 kpc), while only ∼20% of the sample reach an asymptotic velocity at these radii. The more cored ETGs (γ < 0.2) typically have sufficiently small Rdust,H ∼ 0.1–1 kpc such that most reach vmax beyond the CND extent. Cuspy ETGs tend to reach asymptotic velocities within (or just beyond) the disk edge. Unsurprisingly for the fairly compact molecular gas disks that are contained in our sample, we find that the CNDs in at least a third do not probe sufficiently far out to reach a maximum (or asymptotic) circular velocity. Future CO TF studies will benefit from a similar vc analysis or resolved CO kinematics to confirm the suitability of a target within a broader sample.

Figure 10. Circular velocity curves from stellar-only vc,⋆ and total vc gravitational potentials, constructed by deprojecting the H-band MGEs and numerically integrating the stellar luminosity densities. Solutions for r > Rdust,H are included (red dotted lines) along with the extents of each dust disk (dashed lines). To better compare the inner curves of these results, the same vc,⋆ curves are normalized (right panel) to their respective dust-disk radii, together with vc curves (orange solid lines) that include the influence of the expected BH masses. With the exception of four BH masses already measured by stellar (Rusli et al. 2013) or gas-dynamical modeling (Barth et al. 2016b; Davis et al. 2018; Boizelle et al. 2021), BH masses were estimated using MBH–σ⋆ or MBH–LK relations.
Download figure:
Standard image High-resolution image7. Conclusion
ALMA CO imaging of dynamically cold CO kinematics in ETGs provides an appealing avenue to more completely and securely populating the high-mass end of MBH–galaxy correlations. For many ETGs with dusty CNDs, the CO-bright emission is coincident with optically thick dust, limiting the accuracy of stellar luminosity models derived from optical data alone. In this paper, we presented new near-IR HST data for 26 ETGs whose ALMA CO measurements show clean kinematics and good prospects for eventual MBH determination. We detailed masking efforts and constructed stellar luminosity models using the MGE formalism. When fully utilized, these stellar luminosity models will help to expand the number of accurate MBH measurements using ALMA by up to a factor of ∼3 from the present number. When considering all methods to determine BH masses, these dust-masked MGEs could increase the number of ETGs galaxies with accurate MBH by up to ∼25%. BH mass error budgets are often dominated by uncertainties in the central stellar surface-brightness slope due to CND dust attenuation, and few studies have explored the effects that these uncertainties have on stellar luminosity models and final MBH measurements. Future work will explore dust-attenuation modeling to create corrected MGEs.
Of course, more complicated CNDs and stellar light distributions may provide challenges to simple interpretation and application of these MGEs. The CNDs in this sample were selected because of an expectation of dynamically relaxed CO kinematics. Most gas disks do appear to have settled into their respective galaxy's midplanes, and the corresponding MGEs can be applied in a straightforward manner in dynamical modeling efforts. However, disk warping is evident in some dust features as well as CO kinematics, both of which can only reveal warping on scales larger than the angular resolution of the data. CO kinematics suggest warping at the 5°−10° level throughout the CND is typical, although moderate-to-high disk warping has been seen. The constraints on MGE component axis ratio were based on the axis ratio of the outer dust features, so larger changes in the disk inclination angle or misalignments of the outer CND disk structure with the galaxy midplane may impact the MGE solutions presented here. Users of these dust-masked MGEs should evaluate their appropriateness given the observed gas and/or stellar kinematics. Lastly, dust attenuation still influences the MGE goodness-of-fit in the central regions despite our best masking efforts, leading to inner components that may slightly underestimate the intrinsic stellar distribution.

Comparing these stellar luminosity models to other dust-masked MGEs using same-filter data, we find minimal (≲10%) differences between the derived circular velocity profiles vc and the corresponding enclosed mass profiles M(<r). When we compare H-band to optically derived MGEs with nearly identical dust masks, however, the vc and M(<r) profiles show more significant differences that may impact gas-dynamical modeling of the ALMA CO data. The H-band MGEs suggest greater stellar mass within the CNDs, as near-IR data better recover the intrinsic light in unmasked regions.
The HST data files and products arising from this project will prove useful beyond their primary goal of supporting the existing ALMA data sets. These dust-masked MGEs will facilitate other dynamical modeling efforts, including those using stellar kinematic data or those that will pursue a reanalysis of past ionized gas-dynamical modeling (Beifiori et al. 2009). Because of their depth and wavelength coverage, the optical and near-IR HST data and ongoing analysis will have additional legacy value in studies of stellar population gradients, central star formation, and globular cluster populations in ETGs. These multiwavelength HST data will be key to constraining dust attenuation across the disk, and forthcoming dust-corrected MGEs will ensure robust exploration of BH mass measurement errors.
Acknowledgments
This work is based on observations made with the NASA/ESA Hubble Space Telescope, obtained at the Space Telescope Science Institute, which is operated by the Association of Universities for Research in Astronomy, Inc., under NASA contract NAS5-26555. New observations are associated with GO programs 14920, 15226, and 15909. Support for HST GO program number 15909 was provided through a grant from the STScI under NASA contract NAS5-26555. Archival data were based on observations made with the Hubble Space Telescope in GO programs 5124, 5446, 5476, 5910, 5927, 5999, 6587, 6791, 6837, 7450, 8686, 9069, 9106, 9401, 9427, 10003, 10217, 11339, 11583, 12220, 14159, and 15444. This work has made use of archival data obtained with the Spitzer Space Telescope, which was operated by the Jet Propulsion Laboratory, California Institute of Technology under a contract with NASA. This work has made use of observations made with the NASA/ESA Hubble Space Telescope, and obtained from the Hubble Legacy Archive, which is a collaboration between the Space Telescope Science Institute (STScI/NASA), the Space Telescope European Coordinating Facility (ST-ECF/ESA), and the Canadian Astronomy Data Centre (CADC/NRC/CSA). This research has made use of the HyperLEDA database and the NASA/IPAC Extragalactic Database (NED), which is operated by the Jet Propulsion Laboratory, California Institute of Technology, under contract with the National Aeronautics and Space Administration. J.R.D. thanks the Brigham Young University Department of Physics and Astronomy for their Graduate Assistance Awards. J.L.W. is supported by NSF AST-2206219. A.J.Bak. acknowledges support from the Radcliffe Institute for Advanced Study at Harvard University. L.C.H. was supported by the National Science Foundation of China (grant Nos. 11721303, 11991052, 12011540375, and 12233001) and the China Manned Space Project (grant Nos. CMS-CSST-2021-A04 and CMS-CSST-2021-A06).
Facilities: HST - Hubble Space Telescope satellite (WFPC2,ACS,WFC3), IRSA - , MAST - .
Software: AstroDrizzle (Gonzaga et al. 2012), GALFIT (Peng et al. 2010), IRAF (Tody 1986, 1993), PyRAF (Science Software Branch at STScI 2012), Astropy (Astropy Collaboration et al. 2018), MgeFit (Cappellari 2002), Tiny Tim (Krist & Hook 2004).
Appendix A: Surface-brightness Profiles and Isophotal Analysis Results
Here, we provide more detailed and individual analysis of the H-band surface brightnesses. In Figures 11–36, we provide isophotal analysis results for each ETG as a function of radius nearly out to the edge of the WFC3/IR mosaic FOV. These figures also include 1D surface brightnesses extracted along the major axis from both the H-band data and the best-fitting 2D MGE decomposition using GALFIT.

Figure 11. Isophotal analysis (left panels) and MGE (shown along the major axis; right panels) for Hydra A after masking the most dust-obscured regions of the CND. Each panel gives the dust-disk extent (vertical dotted line), beyond which the fitted PA⋆ and ellipticity ε⋆ from the ellipse task are reliable and show generally smooth variations. The CND PAdust,H is also shown for reference (horizontal dotted line). The a4/a deviations from a perfect ellipse are likewise generally small. The full MGE shows generally good agreement (lower-right panel) to the major-axis surface-brightness measurements.
Download figure:
Standard image High-resolution imageThese surface-brightness measurements were made after masking out the most dust-obscured regions with Δ(J − H) ≳ 0.08 mag, which leads to (sometimes large) gaps in major-axis plots but only a reduced number of data points for the 2D fits. The majority of our MGE fits show good agreement to the H-band data, with fractional differences generally at the 10% level or less across all (relevant) radii. The major axes of the dust disks tend to be fairly well aligned with the respective stellar photometric axes, although some targets do show significant (>20°) divergence between PA⋆ and PAdust,H . The isophotal analyses for these targets are unreliable within the CND radii but reveal smoother variations in the fitted ellipse PA and ellipticity beyond the respective dust extents. The a4/a deviations are likewise small, with some tending toward boxy or disky isophotes at large radii. In nearly every case, the best-fit MGE reproduces the central stellar light distribution quite well, and should therefore be useful in future/ongoing ALMA CO dynamical modeling efforts. For just under a third of the sample, however, constraints on the MGE components worsen the global goodness-of-fit. Below, we briefly discuss particulars for all fits individually.
- 1.Hydra A (Figure 11). Despite showing close agreement between the stellar and disk orientation at R ∼ Rdust,H , the isophotal analysis shows a rapid shift in PA⋆ and a steady increase in ε⋆ starting just afterwards. The a4/a deviations are generally small but show some preference for boxy isophotes. Such gradients and boxiness are consistent with the dense galactic environment and merger history for BCGs. The best-fit MGE has PAs that align with , which here hinges on the greater number of measurements at larger radii. Nevertheless, the generally good agreement (with data − MGE fractional differences of ≲5%) is due to fairly circular isophotes at small R.
- 2.NGC 612 (Figure 12). The MGE shows passable agreement to the H-band data out to R ∼ 70'' despite the challenges inherent in fitting such a large dust disk. Of course, the high ΔPA⋆ > 45° cannot be reproduced by the MGE, but the low ε⋆ over most of this ΔPA⋆ range allows for MGE components with a uniform PA to still fit the data without large discrepancies. The a4/a values show clear preference for disky isophotes between 40'' and 50'' with no clear trend beyond, although higher ε⋆ toward the mosaic edge suggests overall greater flattening. Interior to these radii, the outer dust-disk features are generally aligned to within ∼20° of PA⋆.
- 3.NGC 997 (Figure 13). This elliptical galaxy shows close agreement between dust and stellar orientation until R ∼ 20''. This radius coincides with the angular distance of a possible companion, PGC 200205. NGC 997 is tidally interacting with NGC 998, and these two other galaxies may both contribute to the apparent shift in PA⋆. The MGE shows excellent agreement in the central couple × 10 pc, but the fit remains good out to R ∼ 70''. While ε⋆ remains flat, the limiting still limits most of the MGE components, although the global fit only appears slightly affected. In addition, the a4/a values show a clear preference for boxy isophotes with increasing radius. In either case, the global fit appears to be only slightly affected. We note that Dominiak et al. (2024) ran an independent MGE model in the H band for this galaxy, finding an additional compact component (with ) at lower luminosity that does not appear necessary based on the MGE residuals in Figure 13. However, these differences can likely be explained by the choice of PSF and lack of masking.
- 4.NGC 1332 (Figure 14). The dust-disk orientation remains closely aligned to PA⋆ at all radii, even while the isophotes become increasingly flattened. Despite having disk-dominated outskirts, this lenticular galaxy shows slightly boxy isophotes. The MGE reproduces the observed H-band stellar light distribution well, although a slight PA⋆ shift and flattened isophotes beyond R ∼ 60'' accentuate this discrepancy along the major axis.
- 5.NGC 1387 (Figure 15). The measured PA⋆ reveals one of the most misaligned (>50°) dust disks in our sample, with the stellar isophotes lining up well with the stellar bar instead of PAdust,H . Given the nearly face-on CND orientation, this 2D MGE cannot match the flattened isophotes around the bar-dominated regions. Because of the CND shape and uniformly low Δ(J − H) observed for this ETG, we do not create any dust mask. The nearly face-on CND should not affect either the isophotal results or the MGE or values; however, MGE central surface brightness IH may be slightly suppressed, especially for the innermost components that lie almost entirely within the large-scale Rdust,H .
- 6.NGC 3245 (Figure 16). The dust disk is generally well aligned with PA⋆ except in the first couple arcseconds after Rdust,H . However, the more circular isophotes at these radii limit the data − MGE discrepancies. At larger radii, the more flattened isophotes do result in a couple of MGE component values settling to , but the overall fit does not seem to be affected.
- 7.NGC 3258 (Figure 17). The best-fit MGE is good at all radii, as is demonstrated along the major axis, although the data do show a moderate PA⋆ shift from PAdust,H past R ∼ 20''. The data − MGE discrepancy that would otherwise arise from this ΔPA⋆ is lessened for surface-brightness measurements between ∼20'' and 50'' because of more circular isophotes at these radii.
- 8.NGC 3268 (Figure 18): This galaxy shows nearly perfect power-law surface-brightness behavior beyond Rdust,H with only minor changes in PA⋆ and ε⋆ and no significant a4/a deviations from pure elliptical isophotes. As a result, the MGE provides a very good global fit.
- 9.NGC 3271 (Figure 19). The consistent and moderate-amplitude PA⋆ − PAdust,H offset arises in part due to the MGE fitting to a prominent, misaligned stellar bar, although the PA⋆ of the stellar disk remains persistently high out to R ∼ 50''. The generally poorer MGE for this cuspy galaxy also reflects the a4/a values changing from very disky behavior around the bar to boxy features with increasing radius.
- 10.NGC 3557 (Figure 20). Good alignment between PAdust,H and PA⋆ at all radii helps this cored radio galaxy be fit well with an MGE. While we include a central PSF component in the fit, at these wavelengths the AGN contributions are essentially negligible. Beyond R ∼ 50'', the ε⋆ decrease is coincident with a gradual increase in a4/a toward disky behavior.
- 11.NGC 3862 (Figure 21). This galaxy shows a nearly uniform PA⋆ gradient while becoming increasingly disk dominated beyond Re. Despite the large change in PA⋆, the MGE does not result in a poorer fit until R ≳ 20'', when the isophotes become less circular. The measured a4/a values show some preference for boxy shapes only near the edge of the WFC3/IR FOV. The central surface brightnesses for this radio galaxy are consistent with a point source, and including a PSF component recovers the expected core behavior.
- 12.NGC 4061 (Figure 22). Out to ∼2 Re, the stellar isophotal behavior remains consistent and the measured PA⋆ aligns with the observed dust-disk orientation. At larger radii, an abrupt shift in PA⋆ is accompanied by boxy isophotes. The more disturbed features appear to be due to interactions with the nearby NGC 4065. However, the tidal influence is limited to the outer regions of the WFC3/IR FOV, and the GALFIT MGE reproduces the inner 2D stellar surface brightnesses well.
- 13.NGC 4261 (Figure 23). The relatively close agreement between stellar isophotal and outer dust orientations, together with overall low ε⋆, allows for a good global fit without any preference for disky or boxy isophotes. Interestingly, the CND and stellar PAs remain offset by ∼5° out to Re. Boizelle et al. (2021) show that the outer CO kinematics appear to match PAdust,H reported in Table 3. However, the CO kinematic line-of-nodes PA approaches ∼0° toward the disk center, which only increases the PA⋆ − PAdust,H offset. We note that the MGE includes a central PSF component fitted simultaneously in GALFIT, but this point source is negligible at these wavelengths.
- 14.NGC 4373a (Figure 24). The MGE fit shows generally good agreement out to R ∼ 13''. At larger radii, high for R ≳ 15'' and isophotes with a4/a > 0.01 for 15'' ≲ R ≲ 40'' lead to a poorer overall fit. Indeed, most of the MGE components have that are constrained by . Inside the disky isophotes, the stellar isophotal analysis returns a4/a ≈ −0.01 and the inner MGE fit around R ∼ 10'' struggles to match the more boxy features. The dust disk is aligned to within ∼10° of the stellar photometric axis at most radii; at large R, PA⋆ may begin to diverge significantly from PAdust,H , although the certainty of these final measurements is not high.
- 15.NGC 4429 (Figure 25). Overall, the MGE shows generally good agreement out to R ∼ 45''. PA⋆ ∼ PAdust,H just beyond Rdust,H ∼ 13'', although PA⋆ increases thereafter to a maximum 10° offset. The isophotal analysis shows an I(R) bump for 50'' ≲ R ≲ 90'' that corresponds to increased PA⋆, ε⋆, and a4/a values. Figure 8 reveals this feature arises from the (inner) stellar ring. All of the outer MGE components have , and the global MGE does not reproduce the outer stellar light distribution as well as it does the inner regions. This GALFIT fit includes a PSF component to account for moderate AGN contamination, although the central MGE component(s) exceed(s) the central surface brightness of this unresolved source.
- 16.NGC 4435 (Figure 26). This barred lenticular galaxy shows only modest PA⋆ changes and moderate ε⋆ fluctuations that are below for R < 70'', allowing the MGE to reproduce the inner stellar light distribution well. In this region, fluctuating a4/a indicates both disky and boxy isophotal behavior at different radii. In the outer regions (at R ≳ 80''), the PA⋆ abruptly shifts while the isophotes become very disky. Some portion of this shift may be due to the stellar light distribution of (or perhaps interactions with) neighboring NGC 4438.
- 17.NGC 4697 (Figure 27). The MGE provides very good fits to both inner and global stellar light distributions, with PA⋆ ∼ PAdust,H at all R. The measured a4/a values approach boxy behavior toward the outer parts of this galaxy without a noticeable impact on the MGE goodness-of-fit. Positive data − MGE residuals along the major axis for R ≳ 15'' are evidence of a disk-like stellar component (εdisk,⋆ > 0.7) for this fast-rotating ETG (Spiniello et al. 2015) that is not fully fit with this MGE approach.
- 18.NGC 4751 (Figure 28). This cuspy lenticular galaxy is moderately well fit by an MGE at all radii, with PA⋆ ≈ PAdust,H across most of the WFC3/IR FOV. At larger radii, the a4/a values hint at slightly more boxy features, which result in negative data − MGE fractional residuals along the major axis.
- 19.NGC 4786 (Figure 29). For this more cored galaxy, the PA⋆ ∼ PAdust,H and ε⋆ values are consistent across nearly the entire FOV, only showing discrepancies for R ≳ 90'' coincident with the start of disky isophotes. The MGE reproduces the stellar light distributions well on both inner and global scales.
- 20.NGC 4797 (Figure 30). This fairly compact lenticular galaxy shows consistent PA⋆ out to >4 Re even as the stellar ellipticity fluctuates. Beyond that radius, PA⋆ and a4/a both increase, with the isophotes transitioning from boxy to disky behavior. The data − MGE residuals are around the 10% level for many of the major-axis measurements, although the 2D fits show generally good agreement throughout the WFC3/IR FOV.
- 21.NGC 5084 (Figure 31). The MGE shows good agreement to the data only out to ∼7'', beyond which the highly elliptical stellar light distribution and constrained lead to a poor fit, especially along the major-axis direction. Beyond the dust extent, the isophotal analysis shows fairly constant PA⋆. However, PAdust,H is nearly orthogonal to , indicating a polar-ring CND. In such a case, the MGE may still be useful, but one cannot simply assume the CND lies in the galaxy's midplane when calculating vc,⋆. At the transition between disk-dominated regions (out to R ∼ 70'') and the stellar halo, the stellar isophotes show a clear trend toward boxy behavior.
- 22.NGC 5193 (Figure 32). This peculiar elliptical galaxy is well fit by the standard MGE. The stellar and dust-disk orientation angles agree just beyond Rdust,H , although an increasing PA⋆ leads to a ∼15° offset between R ∼ 20'' and 30''. This discrepancy may be due to a companion galaxy to the southwest whose light may not be fully masked. This PA⋆ shift does not result in a noticeably worse MGE goodness-of-fit, due to a coincident drop in ε⋆ to nearly circular isophotes.
- 23.NGC 5208 (Figure 33). For this cuspy galaxy with a large (projected) disk size, the remaining unmasked H-band data show only mild gradients in PA⋆ and ε⋆. Despite slightly larger data − MGE residuals along the major axis, the overall MGE is not a poor representation of the H-band mosaic.
- 24.NGC 5838 (Figure 34). The MGE shows generally good agreement with the data out to R ∼ 35'', beyond which highly elliptical isophotes and constrained lead to a poorer fit, especially along the major axis. Modest changes in PA⋆ for 1 < R/Rdust,H ≲ 3 exacerbate the discrepancies. However, PA ∼ PAdust,H both near the CND edge and for R ≳ 5Rdust,H . At more intermediate radii, the isophotes show boxy behavior.
- 25.NGC 6861 (Figure 35). The MGE for this BGG is able to reproduce the observed surface-brightness distribution fairly well. Despite close agreement between PA⋆ and PAdust,H in the inner regions, PA⋆ begins to noticeably decrease for R ≳ 50'', leading to large-scale data − MGE discrepancies. The disky isophotes at large R complicate the global fit, but not more than the observed ΔPA⋆.
- 26.NGC 6958 (Figure 36). In this cD galaxy, the very face-on [(b/a)dust,H ∼ 1] disk orientation severely limits the values that the MGE components can assume at all radii, leading to high major-axis data − MGE residuals. As a result of a large PA⋆ decrease and a moderate ε⋆ increase for R ≳ 40'', the MGE solution beyond this radius becomes less reliable.


Figure 12. Same as for Figure 11 but for NGC 612.
Download figure:
Standard image High-resolution image
Figure 13. Same as for Figure 11 but for NGC 997.
Download figure:
Standard image High-resolution image
Figure 14. Same as for Figure 11 but for NGC 1332.
Download figure:
Standard image High-resolution image
Figure 15. Same as for Figure 11 but for NGC 1387.
Download figure:
Standard image High-resolution image
Figure 16. Same as for Figure 11 but for NGC 3245.
Download figure:
Standard image High-resolution image
Figure 17. Same as for Figure 11 but for NGC 3258.
Download figure:
Standard image High-resolution image
Figure 18. Same as for Figure 11 but for NGC 3268.
Download figure:
Standard image High-resolution image
Figure 19. Same as for Figure 11 but for NGC 3271.
Download figure:
Standard image High-resolution image
Figure 20. Same as for Figure 11 but for NGC 3557.
Download figure:
Standard image High-resolution image
Figure 21. Same as for Figure 11 but for NGC 3862.
Download figure:
Standard image High-resolution image
Figure 22. Same as for Figure 11 but for NGC 4061.
Download figure:
Standard image High-resolution image
Figure 23. Same as for Figure 11 but for NGC 4261.
Download figure:
Standard image High-resolution image
Figure 24. Same as for Figure 11 but for NGC 4373a.
Download figure:
Standard image High-resolution image
Figure 25. Same as for Figure 11 but for NGC 4429.
Download figure:
Standard image High-resolution image
Figure 26. Same as for Figure 11 but for NGC 4435.
Download figure:
Standard image High-resolution image
Figure 27. Same as for Figure 11 but for NGC 4697.
Download figure:
Standard image High-resolution image
Figure 28. Same as for Figure 11 but for NGC 4751.
Download figure:
Standard image High-resolution image
Figure 29. Same as for Figure 11 but for NGC 4786.
Download figure:
Standard image High-resolution image
Figure 30. Same as for Figure 11 but for NGC 4797.
Download figure:
Standard image High-resolution image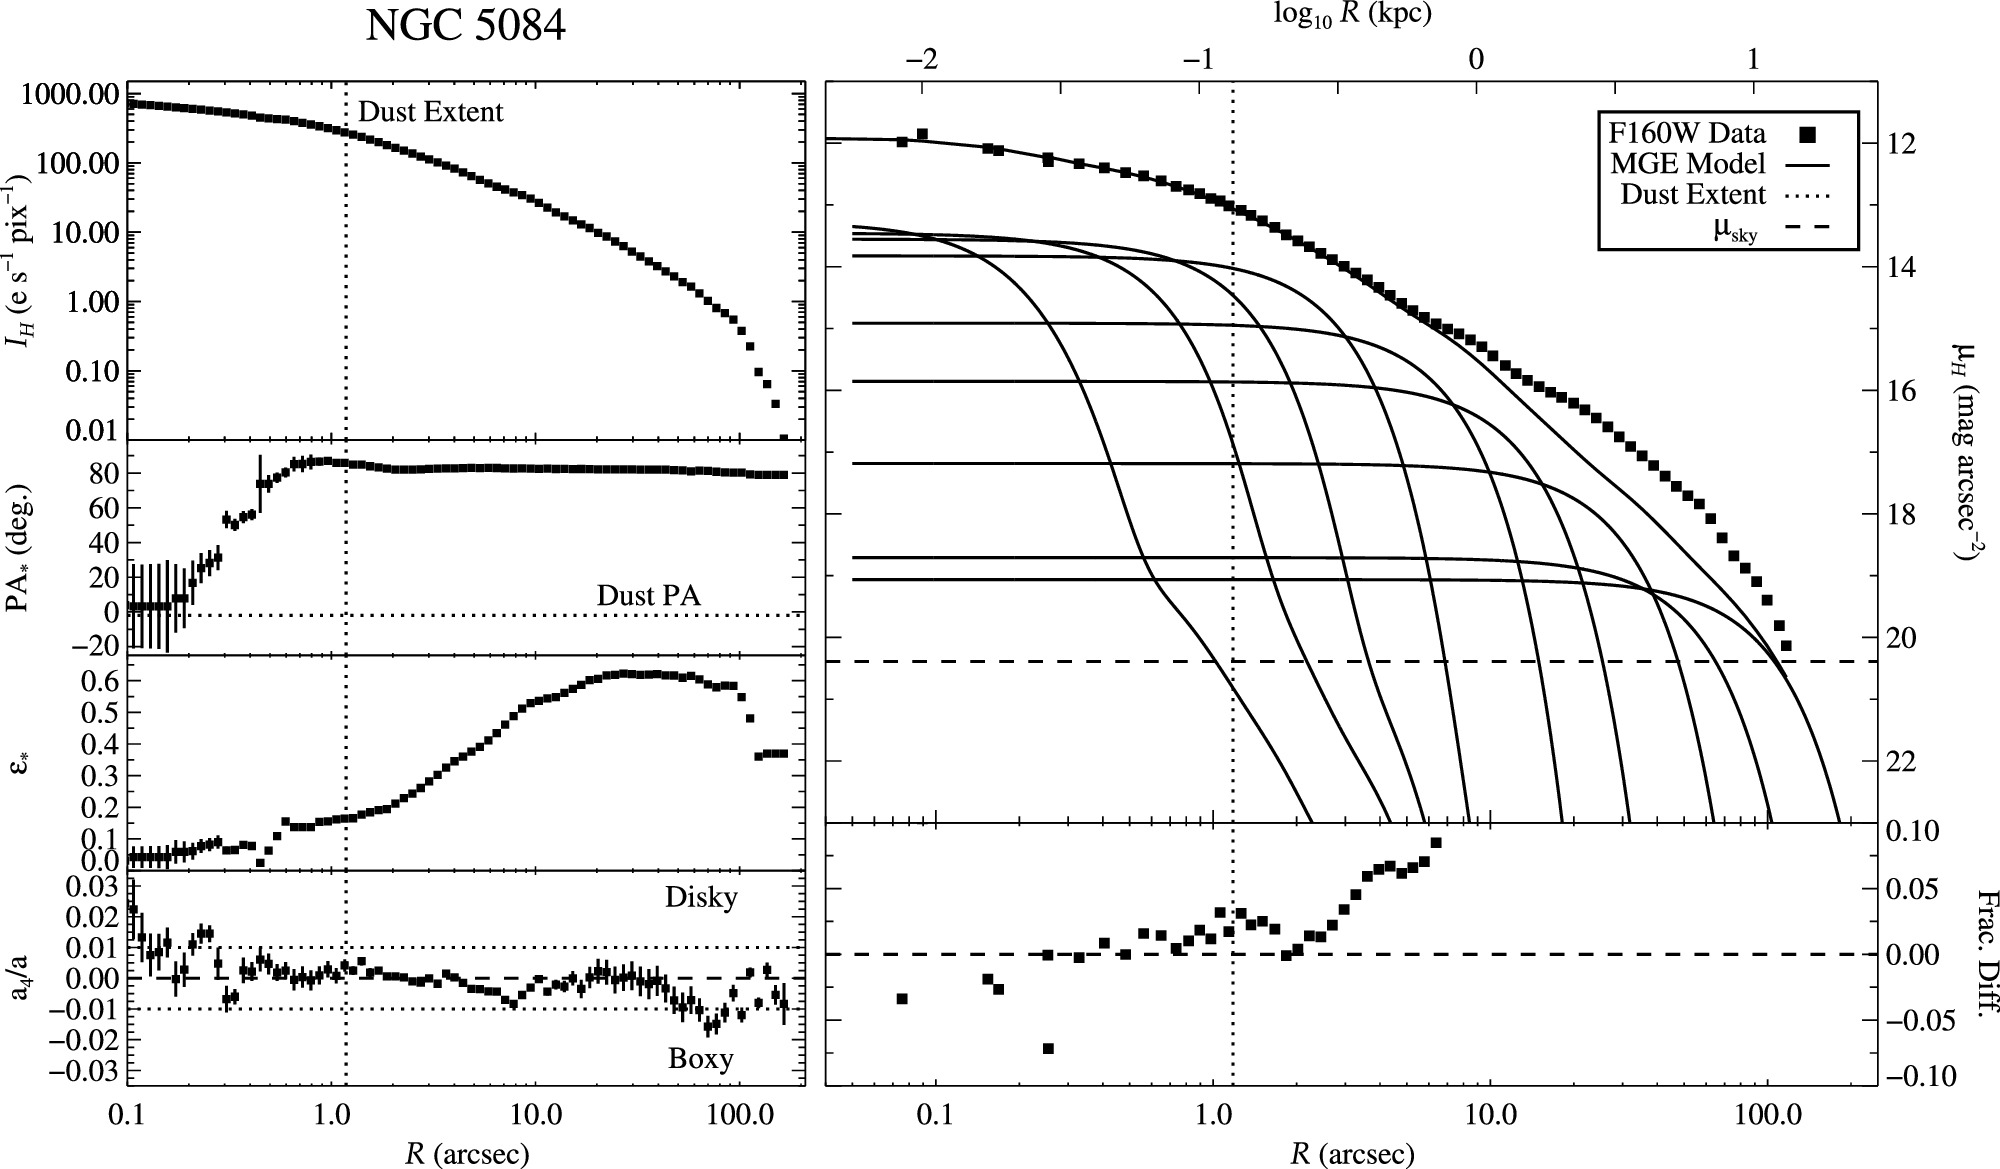
Figure 31. Same as for Figure 11 but for NGC 5084.
Download figure:
Standard image High-resolution image
Figure 32. Same as for Figure 11 but for NGC 5193.
Download figure:
Standard image High-resolution image
Figure 33. Same as for Figure 11 but for NGC 5208.
Download figure:
Standard image High-resolution image
Figure 34. Same as for Figure 11 but for NGC 5838.
Download figure:
Standard image High-resolution image
Figure 35. Same as for Figure 11 but for NGC 6861.
Download figure:
Standard image High-resolution image
Figure 36. Same as for Figure 11 but for NGC 6958.
Download figure:
Standard image High-resolution imageAppendix B: Multi-Gaussian Expansions with a Free Position Angle
We report GALFIT MGE solutions that allow for PA to vary between components in Table 6 and show the resulting contour plots in Figure 37. Photometric PA twists are common in this sample, and accounting for these PA twists results in better overall fits. For uniformity with our previous MGE solutions, we restrict these models to an appropriate range of inclination angles, which can still result in some discrepancies. Accounting for PA twists can also be useful for stellar-dynamical efforts that explore triaxality (e.g., van den Bosch et al. 2008; Krajnović et al. 2011; Liepold et al. 2023). However, allowing for a variable PA between Gaussian components prevents a simple deprojection. Isophotal centroids are not always consistent for different radii (e.g., Goullaud et al. 2018), likely due to ongoing settling of a recent merger or tidal interaction. However, nonconcentric series expansions are not currently viable for standard gas-dynamical modeling efforts, so we opt to force a concentric MGE solution. Compared to the MGE solutions with a fixed PA, changes in χ2 are minimal in most cases, reaching up to ∼4% improvement at best.

Figure 37. Nearly full-frame HST WFC3/F160W mosaics, together with the (dust-masked) GALFIT MGE solutions (overplotted in red) that fits a variable PA for all components. At larger radii, some galaxies exhibit highly flattened stellar isophotes, resulting in unavoidable discrepancies. Contours are shown at logarithmic intensity intervals.
Download figure:
Standard image High-resolution imageTable 6. MGE Parameters (with a Free PA)
| j | PA | PA | PA | |||||||||
|---|---|---|---|---|---|---|---|---|---|---|---|---|
| (L☉ pc−2) | (arcsec) | (deg) | (L☉ pc−2) | (arcsec) | (deg) | (L☉ pc−2) | (arcsec) | (deg) | ||||
| (1) | (2) | (3) | (4) | (5) | (2) | (3) | (4) | (5) | (2) | (3) | (4) | (5) |
| Hydra A | NGC 612 | NGC 997 | ||||||||||
| 1 | 3.4568 | 1.2335 | 0.8913 | −79.83 | 4.3281 | 0.1903 | 0.7587 | −39.44 | 4.5662 | 0.2499 | 0.9100 | 36.57 |
| 2 | 2.9176 | 2.9311 | 0.9040 | −30.96 | 3.8095 | 0.9655 | 0.2893 | −23.97 | 4.2771 | 0.7129 | 0.9127 | 34.68 |
| 3 | 2.1985 | 6.6571 | 0.9179 | 6.58 | 3.6600 | 1.0974 | 0.2400 | 40.32 | 3.9215 | 1.4906 | 0.9309 | 35.48 |
| 4 | 2.0283 | 7.7789 | 0.6524 | −44.11 | 3.7754 | 0.8971 | 0.5199 | −87.74 | 3.4213 | 3.2687 | 0.9100 | 30.44 |
| 5 | 2.1393 | 13.591 | 0.7972 | −34.43 | 3.1582 | 2.3074 | 0.8134 | 84.61 | 2.9231 | 7.1770 | 0.9100 | 29.83 |
| 6 | 1.3498 | 27.250 | 0.7011 | −29.73 | 3.8082 | 3.8546 | 0.2658 | 4.70 | 2.3616 | 15.141 | 0.9100 | 21.84 |
| 7 | 0.9367 | 59.514 | 0.6606 | −33.63 | 3.0907 | 4.7088 | 0.6825 | 9.43 | 1.7550 | 36.268 | 0.9100 | 10.67 |
| 8 | ⋯ | ⋯ | ⋯ | ⋯ | 2.5885 | 5.9420 | 0.9211 | 86.23 | ⋯ | ⋯ | ⋯ | ⋯ |
| 9 | ⋯ | ⋯ | ⋯ | ⋯ | 2.7923 | 7.1097 | 0.2400 | −8.91 | ⋯ | ⋯ | ⋯ | ⋯ |
| 10 | ⋯ | ⋯ | ⋯ | ⋯ | 2.3449 | 12.666 | 0.4365 | −9.20 | ⋯ | ⋯ | ⋯ | ⋯ |
| 11 | ⋯ | ⋯ | ⋯ | ⋯ | 2.2925 | 16.064 | 0.8224 | −22.72 | ⋯ | ⋯ | ⋯ | ⋯ |
| 12 | ⋯ | ⋯ | ⋯ | ⋯ | 1.1335 | 52.983 | 0.6825 | −31.82 | ⋯ | ⋯ | ⋯ | ⋯ |
| 13 | ⋯ | ⋯ | ⋯ | ⋯ | 1.1010 | 53.895 | 0.5797 | −84.96 | ⋯ | ⋯ | ⋯ | ⋯ |
| NGC 1332 | NGC 1387 | NGC 3245 | ||||||||||
| 1 | 5.8054 | 0.1279 | 0.3348 | −63.74 | 5.3558 | 0.1549 | 0.9500 | 7.45 | 5.6183 | 0.1000 | 0.7331 | −39.10 |
| 2 | 4.9808 | 0.4945 | 0.9725 | −49.77 | 4.8527 | 0.5285 | 0.9744 | 12.38 | 5.1971 | 0.1626 | 0.5200 | 13.55 |
| 3 | 4.6118 | 1.5343 | 0.7284 | −62.34 | 4.5401 | 1.6483 | 0.9922 | 42.47 | 4.9520 | 0.4882 | 0.8925 | 3.04 |
| 4 | 4.2028 | 3.4563 | 0.7279 | −64.51 | 4.0631 | 4.0942 | 0.9500 | −73.88 | 4.3391 | 1.0742 | 0.8129 | 36.30 |
| 5 | 3.8253 | 7.4695 | 0.7682 | −60.44 | 3.5116 | 6.8412 | 0.9500 | −71.07 | 4.2465 | 1.1928 | 0.9226 | 19.57 |
| 6 | 3.1793 | 18.073 | 0.3133 | −64.62 | 2.9294 | 14.219 | 0.9500 | −70.62 | 4.0351 | 2.5475 | 0.6392 | −3.27 |
| 7 | 3.0388 | 34.972 | 0.2839 | −66.38 | 2.4982 | 39.993 | 0.9599 | −73.20 | 3.8187 | 3.2562 | 0.7724 | −7.94 |
| 8 | 2.1287 | 55.919 | 0.2547 | −52.75 | ⋯ | ⋯ | ⋯ | ⋯ | 3.5250 | 8.6738 | 0.5200 | −3.53 |
| 9 | 2.3712 | 60.489 | 0.3236 | −71.54 | ⋯ | ⋯ | ⋯ | ⋯ | 2.8619 | 26.303 | 0.5200 | −2.97 |
| 10 | 1.5591 | 86.725 | 0.6815 | −55.92 | ⋯ | ⋯ | ⋯ | ⋯ | 2.1463 | 42.513 | 0.5269 | −4.76 |
| 11 | ⋯ | ⋯ | ⋯ | ⋯ | ⋯ | ⋯ | ⋯ | ⋯ | 2.0451 | 18.731 | 0.5200 | 3.92 |
| 12 | ⋯ | ⋯ | ⋯ | ⋯ | ⋯ | ⋯ | ⋯ | ⋯ | 1.3133 | 109.00 | 0.9668 | 15.42 |
| NGC 3258 | NGC 3268 | NGC 3271 | ||||||||||
| 1 | 4.1544 | 0.7817 | 0.9534 | 81.66 | 3.8018 | 0.2295 | 0.6700 | 64.47 | 4.9283 | 0.1000 | 0.7300 | −56.05 |
| 2 | 3.9772 | 1.1312 | 0.7200 | 75.57 | 3.9040 | 1.0116 | 0.9786 | −44.81 | 5.1004 | 0.1420 | 0.7300 | −71.75 |
| 3 | 3.9493 | 1.9658 | 0.7573 | 77.43 | 3.9745 | 1.0911 | 0.7336 | 70.80 | 4.5431 | 0.3628 | 0.8602 | −85.05 |
| 4 | 3.6280 | 3.0048 | 0.8116 | 75.10 | 3.8481 | 1.9805 | 0.7185 | 66.30 | 4.2114 | 0.9708 | 0.7300 | −64.29 |
| 5 | 3.4937 | 4.7532 | 0.8475 | 74.75 | 3.7059 | 2.2801 | 0.8904 | 73.63 | 4.0583 | 2.4108 | 0.7300 | −60.23 |
| 6 | 2.7343 | 8.3235 | 0.8346 | 84.57 | 3.4643 | 3.8046 | 0.7788 | 68.70 | 3.7306 | 3.7406 | 0.7300 | −66.85 |
| 7 | 2.9480 | 11.477 | 0.9222 | 67.16 | 3.2627 | 6.3286 | 0.8091 | 67.99 | 3.3797 | 7.0013 | 0.7300 | −69.50 |
| 8 | 2.2619 | 20.600 | 0.9724 | 61.57 | 2.8096 | 12.068 | 0.7836 | 65.37 | 2.9196 | 17.385 | 0.7300 | −63.39 |
| 9 | 2.0426 | 47.745 | 0.7563 | 56.47 | 2.4636 | 21.539 | 0.8038 | 69.14 | 1.7699 | 33.410 | 0.7300 | −73.50 |
| 10 | ⋯ | ⋯ | ⋯ | ⋯ | 2.0176 | 51.615 | 0.7267 | 64.49 | 1.9335 | 50.589 | 0.7300 | −81.49 |
| 11 | ⋯ | ⋯ | ⋯ | ⋯ | 1.5354 | 89.674 | 0.8499 | 45.60 | 0.72101 | 119.88 | 0.7390 | −86.53 |
| NGC 3557 | NGC 3862 | NGC 4061 | ||||||||||
| 1 | 4.3101 | 0.8964 | 0.8939 | 40.58 | 4.1623 | 0.7526 | 0.9900 | 24.23 | 4.2038 | 0.1643 | 0.6600 | −7.04 |
| 2 | 4.2852 | 1.3284 | 0.7500 | 32.82 | 3.8002 | 1.4249 | 0.9913 | 16.53 | 4.2872 | 0.5382 | 0.6600 | −4.16 |
| 3 | 3.9338 | 2.0829 | 0.7500 | 33.04 | 3.4945 | 2.9143 | 0.9900 | 1.82 | 3.7492 | 1.1051 | 0.9019 | −5.77 |
| 4 | 4.0034 | 3.0179 | 0.7500 | 34.30 | 2.7925 | 7.0073 | 0.9900 | −16.24 | 3.6006 | 1.2674 | 0.6600 | −3.32 |
| 5 | 3.7192 | 4.5527 | 0.7606 | 32.91 | 2.2356 | 17.893 | 0.9900 | −21.13 | 3.5601 | 2.1423 | 0.8069 | −6.01 |
| 6 | 3.4630 | 7.0489 | 0.7509 | 34.41 | 1.6486 | 63.145 | 0.9900 | −47.07 | 3.1868 | 3.7987 | 0.8128 | −5.24 |
| 7 | 2.6865 | 17.322 | 0.7500 | 32.86 | ⋯ | ⋯ | ⋯ | ⋯ | 2.4864 | 6.3725 | 0.9544 | 11.23 |
| 8 | 3.1593 | 12.247 | 0.7500 | 31.70 | ⋯ | ⋯ | ⋯ | ⋯ | 2.3310 | 8.5164 | 0.6600 | −9.11 |
| 9 | 2.6519 | 31.261 | 0.7500 | 32.73 | ⋯ | ⋯ | ⋯ | ⋯ | 2.1361 | 13.776 | 0.8540 | −6.35 |
| 10 | 2.0201 | 47.821 | 0.8375 | 33.35 | ⋯ | ⋯ | ⋯ | ⋯ | 1.6802 | 24.945 | 0.6938 | −2.47 |
| 11 | 1.9106 | 91.520 | 0.7986 | 38.25 | ⋯ | ⋯ | ⋯ | ⋯ | 1.4371 | 50.149 | 0.6600 | −26.66 |
| 12 | ⋯ | ⋯ | ⋯ | ⋯ | ⋯ | ⋯ | ⋯ | ⋯ | 0.55051 | 144.60 | 0.7209 | −50.73 |
| NGC 4261 | NGC 4373a | NGC 4429 | ||||||||||
| 1 | 4.3300 | 1.1171 | 0.8200 | −22.92 | 5.1906 | 0.1133 | 0.5200 | −18.92 | 5.2744 | 0.1133 | 0.8697 | 89.55 |
| 2 | 4.0998 | 2.1901 | 0.7100 | −20.82 | 4.8712 | 0.3296 | 0.5200 | −27.01 | 4.8345 | 0.3249 | 0.5700 | −89.49 |
| 3 | 3.9659 | 3.7306 | 0.7257 | −24.13 | 4.2773 | 0.9670 | 0.5505 | −21.93 | 4.3016 | 0.7510 | 0.7012 | −85.52 |
| 4 | 2.9954 | 6.5190 | 0.7100 | −2.520 | 3.9327 | 2.1215 | 0.5788 | −27.10 | 4.2403 | 2.4643 | 0.5700 | 89.96 |
| 5 | 3.3170 | 8.3750 | 0.7100 | −29.93 | 3.4518 | 4.6950 | 0.7496 | −35.00 | 3.6811 | 3.1301 | 0.8392 | 85.91 |
| 6 | 3.1818 | 12.620 | 0.8165 | −17.42 | 3.1189 | 11.913 | 0.5200 | −29.96 | 3.8262 | 6.6209 | 0.6155 | −87.26 |
| 7 | 2.7878 | 19.976 | 0.8322 | −28.76 | 2.2540 | 28.705 | 0.5200 | −28.46 | 2.9329 | 19.703 | 0.5700 | −75.08 |
| 8 | 1.7203 | 41.033 | 0.7560 | 7.40 | 1.7247 | 54.713 | 0.5200 | −29.52 | 3.2075 | 15.868 | 0.5700 | 88.27 |
| 9 | 2.3330 | 45.969 | 0.8291 | −20.43 | 0.6228 | 137.36 | 0.9964 | −38.48 | 2.4565 | 52.720 | 0.5700 | −81.74 |
| 10 | 1.7945 | 95.693 | 0.9336 | −14.80 | ⋯ | ⋯ | ⋯ | ⋯ | 2.2329 | 42.422 | 0.5700 | −81.01 |
| 11 | ⋯ | ⋯ | ⋯ | ⋯ | ⋯ | ⋯ | ⋯ | ⋯ | 2.4152 | 71.394 | 0.5700 | −83.12 |
| NGC 4435 | NGC 4697 | NGC 4751 | ||||||||||
| 1 | 5.1424 | 0.1773 | 0.4820 | 9.47 | 5.7171 | 0.1000 | 0.4000 | −32.04 | 6.1303 | 0.1136 | 0.3500 | −1.66 |
| 2 | 4.6677 | 0.5383 | 0.6624 | 32.01 | 5.4697 | 0.1805 | 0.4117 | 63.62 | 5.2241 | 0.3007 | 0.3500 | −4.49 |
| 3 | 4.3822 | 1.1710 | 0.8042 | 4.91 | 4.8204 | 0.5119 | 0.7567 | 65.81 | 4.4520 | 0.5333 | 0.9973 | −27.53 |
| 4 | 4.2347 | 2.4201 | 0.6675 | 16.38 | 4.5250 | 1.0984 | 0.7124 | 66.88 | 4.4722 | 0.9159 | 0.6330 | −3.20 |
| 5 | 3.9720 | 4.5892 | 0.7299 | −6.98 | 3.7593 | 2.2197 | 0.9620 | 63.31 | 4.2449 | 1.7674 | 0.6551 | −5.38 |
| 6 | 3.2195 | 12.116 | 0.4100 | 10.66 | 4.2598 | 2.5815 | 0.4380 | 65.90 | 3.9386 | 4.1249 | 0.4735 | −5.52 |
| 7 | 3.0735 | 16.582 | 0.4100 | 11.94 | 3.8533 | 5.3273 | 0.4277 | 65.67 | 3.3793 | 8.3846 | 0.4188 | −4.49 |
| 8 | 2.5324 | 16.508 | 0.9569 | 28.45 | 3.5599 | 5.5314 | 0.6935 | 66.59 | 2.9959 | 15.765 | 0.4111 | −5.25 |
| 9 | 2.4556 | 31.778 | 0.5339 | 11.20 | 3.4864 | 9.5203 | 0.7144 | 67.14 | 2.4976 | 34.652 | 0.3970 | −6.04 |
| 10 | 1.7724 | 64.592 | 0.7168 | −70.50 | 3.0765 | 12.411 | 0.4000 | 65.41 | 1.7031 | 75.996 | 0.4970 | −9.94 |
| 11 | 1.5648 | 88.297 | 0.4140 | 9.91 | 2.8323 | 22.877 | 0.4000 | 65.10 | 0.60477 | 181.39 | 0.8516 | −19.76 |
| 12 | ⋯ | ⋯ | ⋯ | ⋯ | 2.9443 | 23.326 | 0.5089 | 66.05 | ⋯ | ⋯ | ⋯ | ⋯ |
| 13 | ⋯ | ⋯ | ⋯ | ⋯ | 2.9126 | 34.276 | 0.6047 | 66.95 | ⋯ | ⋯ | ⋯ | ⋯ |
| 14 | ⋯ | ⋯ | ⋯ | ⋯ | 2.5195 | 58.878 | 0.6590 | 66.11 | ⋯ | ⋯ | ⋯ | ⋯ |
| 15 | ⋯ | ⋯ | ⋯ | ⋯ | 1.9977 | 118.41 | 0.8048 | 69.42 | ⋯ | ⋯ | ⋯ | ⋯ |
| NGC 4786 | NGC 4797 | NGC 5084 | ||||||||||
| 1 | 4.3086 | 0.3298 | 0.9381 | 75.16 | 4.9673 | 0.1404 | 0.5900 | 43.03 | 5.2766 | 0.1000 | 0.5300 | 21.32 |
| 2 | 4.4393 | 0.5740 | 0.7206 | −15.72 | 4.2167 | 0.4608 | 0.8116 | 36.34 | 4.7053 | 0.4536 | 0.8297 | 87.62 |
| 3 | 4.1755 | 1.2669 | 0.8197 | −18.02 | 3.6904 | 0.9806 | 0.9678 | 43.52 | 4.5468 | 0.8996 | 0.8877 | 83.20 |
| 4 | 3.5620 | 2.7412 | 0.7348 | −17.26 | 3.2996 | 2.0556 | 0.9337 | −79.20 | 4.4677 | 1.8366 | 0.7501 | 82.48 |
| 5 | 3.4411 | 4.7184 | 0.8148 | −17.94 | 2.7301 | 5.4252 | 0.8406 | −50.53 | 4.0750 | 4.5063 | 0.5300 | 82.62 |
| 6 | 2.5653 | 5.9174 | 0.8593 | −22.41 | 2.7371 | 7.4784 | 0.6212 | 31.61 | 3.6607 | 8.4099 | 0.5300 | 82.35 |
| 7 | 2.5992 | 7.7617 | 0.6900 | −14.24 | 2.3562 | 12.931 | 0.6168 | 32.26 | 3.2294 | 18.160 | 0.5300 | 82.10 |
| 8 | 2.6956 | 12.806 | 0.6900 | −16.27 | 1.9419 | 18.686 | 0.8588 | 29.80 | 2.6726 | 47.305 | 0.5300 | 80.74 |
| 9 | 2.3145 | 14.855 | 0.9089 | −16.79 | 1.3603 | 33.385 | 0.9183 | 58.23 | 1.5243 | 105.20 | 0.5300 | 80.05 |
| 10 | 2.1400 | 23.637 | 0.6900 | −14.79 | ⋯ | ⋯ | ⋯ | ⋯ | ⋯ | ⋯ | ⋯ | ⋯ |
| 11 | 1.7393 | 28.847 | 0.9223 | −20.55 | ⋯ | ⋯ | ⋯ | ⋯ | ⋯ | ⋯ | ⋯ | ⋯ |
| 12 | 1.3589 | 55.304 | 0.6900 | −17.07 | ⋯ | ⋯ | ⋯ | ⋯ | ⋯ | ⋯ | ⋯ | ⋯ |
| 13 | 1.1908 | 109.29 | 0.8174 | −39.18 | ⋯ | ⋯ | ⋯ | ⋯ | ⋯ | ⋯ | ⋯ | ⋯ |
| NGC 5193 | NGC 5208 | NGC 5838 | ||||||||||
| 1 | 5.2531 | 0.1000 | 0.7500 | 61.39 | 4.7132 | 0.1000 | 0.6486 | 3.62 | 5.3228 | 0.1000 | 0.7369 | −30.22 |
| 2 | 4.3480 | 0.4486 | 0.7500 | 62.53 | 4.7639 | 0.2374 | 0.6454 | −13.42 | 5.5671 | 0.1567 | 0.5600 | 38.57 |
| 3 | 4.3466 | 0.9357 | 0.7500 | 67.88 | 4.2336 | 0.5364 | 0.6789 | −13.20 | 4.9070 | 0.3916 | 0.9063 | 73.40 |
| 4 | 3.9765 | 1.9775 | 0.8096 | 69.80 | 3.7478 | 1.3023 | 0.6911 | −14.50 | 4.5814 | 0.7877 | 0.8646 | 37.26 |
| 5 | 3.4464 | 4.6026 | 0.7500 | 73.33 | 3.9250 | 1.6661 | 0.3100 | −16.77 | 4.4185 | 1.9833 | 0.7133 | 36.51 |
| 6 | 3.0327 | 9.7373 | 0.8422 | 74.22 | 3.4542 | 2.3510 | 0.5494 | −15.21 | 3.9404 | 4.5365 | 0.8312 | 58.05 |
| 7 | 2.5116 | 18.578 | 0.9809 | 83.30 | 3.5274 | 5.4322 | 0.3100 | −16.49 | 3.4456 | 10.621 | 0.6015 | 41.87 |
| 8 | 1.6530 | 47.070 | 0.9401 | 64.60 | 3.0443 | 6.0382 | 0.5683 | −14.00 | 2.7230 | 32.183 | 0.5600 | 41.58 |
| 9 | ⋯ | ⋯ | ⋯ | ⋯ | 2.5614 | 9.2453 | 0.3100 | −17.57 | 2.0282 | 57.223 | 0.5600 | 41.57 |
| 10 | ⋯ | ⋯ | ⋯ | ⋯ | 2.5448 | 13.568 | 0.3100 | −17.33 | ⋯ | ⋯ | ⋯ | ⋯ |
| 11 | ⋯ | ⋯ | ⋯ | ⋯ | 2.2904 | 17.293 | 0.4537 | −16.36 | ⋯ | ⋯ | ⋯ | ⋯ |
| 12 | ⋯ | ⋯ | ⋯ | ⋯ | 1.8148 | 22.700 | 0.3100 | −21.79 | ⋯ | ⋯ | ⋯ | ⋯ |
| 13 | ⋯ | ⋯ | ⋯ | ⋯ | 1.5476 | 44.782 | 0.3775 | −21.63 | ⋯ | ⋯ | ⋯ | ⋯ |
| 14 | ⋯ | ⋯ | ⋯ | ⋯ | 0.8870 | 129.08 | 0.8838 | −29.79 | ⋯ | ⋯ | ⋯ | ⋯ |
| NGC 6861 | NGC 6958 | |||||||||||
| 1 | 5.0115 | 0.1240 | 0.5642 | 19.16 | 5.3939 | 0.1000 | 0.9500 | 61.22 | ||||
| 2 | 4.8017 | 0.2137 | 0.8592 | −24.84 | 5.3091 | 0.1893 | 0.9500 | 67.25 | ||||
| 3 | 4.8535 | 0.5023 | 0.3800 | −35.82 | 4.6775 | 0.6404 | 0.9500 | −70.95 | ||||
| 4 | 4.5926 | 0.6724 | 0.9826 | −25.22 | 4.2927 | 1.4673 | 0.9500 | −69.61 | ||||
| 5 | 4.2607 | 1.5157 | 0.8176 | −36.10 | 3.8961 | 3.0894 | 0.9500 | −70.56 | ||||
| 6 | 4.2174 | 3.4836 | 0.4681 | −37.45 | 3.1265 | 7.1427 | 0.9500 | −70.24 | ||||
| 7 | 3.7291 | 4.4471 | 0.7497 | −38.68 | 2.7974 | 14.133 | 0.9500 | −77.93 | ||||
| 8 | 3.5860 | 7.5404 | 0.4153 | −37.57 | 1.9274 | 33.343 | 0.9500 | 89.82 | ||||
| 9 | 3.2756 | 11.558 | 0.5075 | −38.29 | 1.5789 | 42.066 | 0.9500 | 85.45 | ||||
| 10 | 2.6651 | 13.092 | 0.6773 | −37.38 | 0.87033 | 90.065 | 0.9942 | −73.57 | ||||
| 11 | 2.6056 | 23.592 | 0.4402 | −39.64 | ⋯ | ⋯ | ⋯ | ⋯ | ||||
| 12 | 2.3448 | 26.382 | 0.7077 | −42.19 | ⋯ | ⋯ | ⋯ | ⋯ | ||||
| 13 | 1.8380 | 43.342 | 0.5320 | −39.05 | ⋯ | ⋯ | ⋯ | ⋯ | ||||
| 14 | 1.6966 | 46.380 | 0.8709 | 84.57 | ⋯ | ⋯ | ⋯ | ⋯ | ||||
| 15 | 1.4120 | 153.99 | 0.5012 | −70.61 | ⋯ | ⋯ | ⋯ | ⋯ | ||||


Notes. Individual Gaussian components from the best-fitting MGE for each galaxy in this H-band sample, after masking out neighboring galaxies, foreground stars, and the most dust-obscured regions of the CND. The PA for each component was allowed to vary freely. Projected terms are indicated by a . During these fits, the individual values were constrained to be equal to or greater than the listed limit .


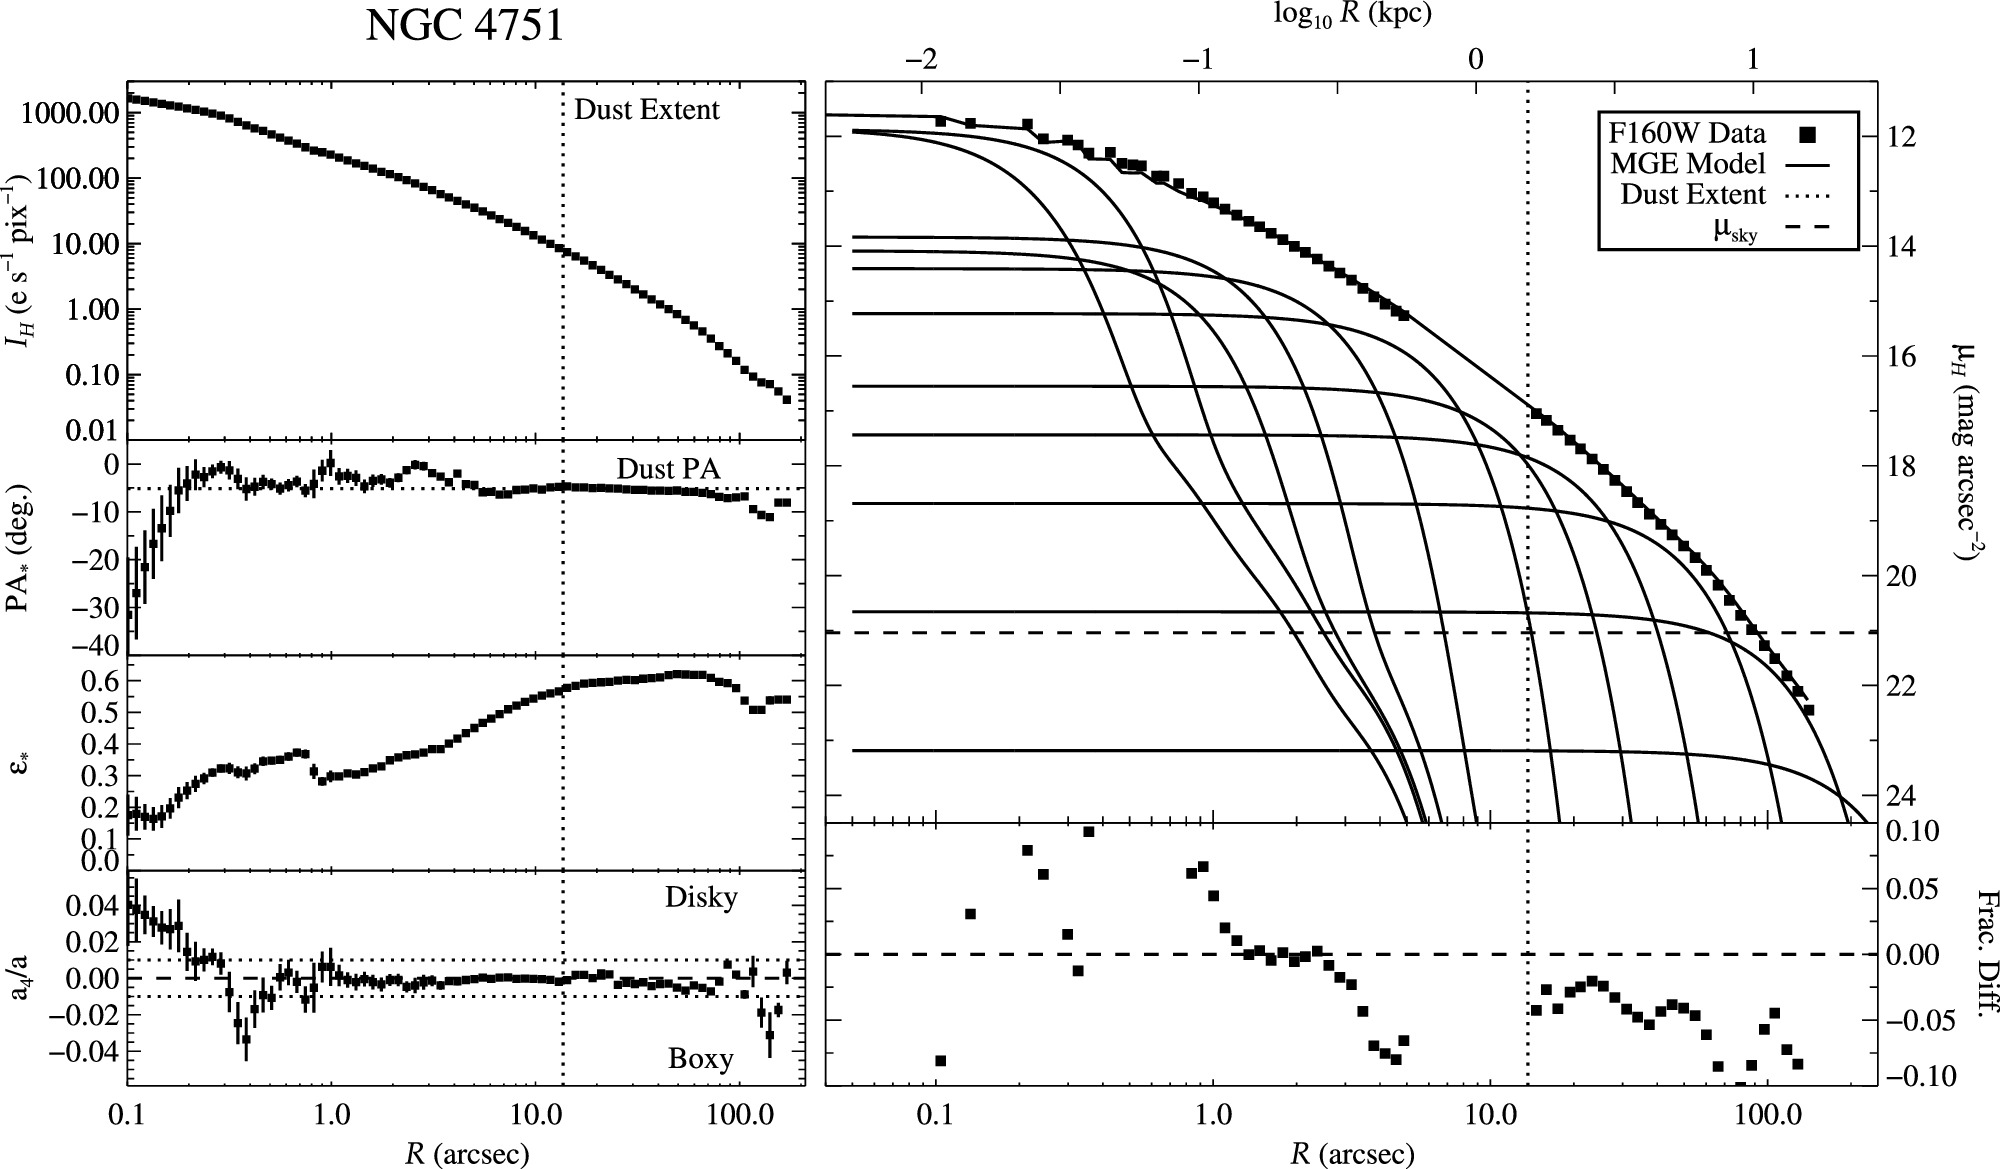
Footnotes
- 12
- 13
- 14
- 15