


Abstract
We report the results of the CO J = 1–0 and SiO J = 2–1 mapping observations toward the broad-velocity-width molecular feature (BVF) CO 16.134–0.553 with the Nobeyama Radio Observatory 45 m telescope. The high-quality CO map shows that the 5 pc size BVF bridges two separate velocity components at VLSR ≃ 40 km s−1 and 65 km s−1 in the position–velocity space. The kinetic power of CO 16.134–0.553 amounts to 7.8 × 10²L⊙, whereas no apparent driving sources were identified. Prominent SiO emission was detected from the BVF and its root in the VLSR ≃ 40 km s−1 component. In the CO Galactic plane survey data, CO 16.134–0.553 appears to correspond to the Galactic eastern rim of a 15 pc diameter expanding CO shell. A 1° diameter H i emission void and 4° long vertical H i filament were also found above and below the CO shell, respectively. We propose that the high-velocity plunge of a dark matter subhalo with a clump of baryonic matter was responsible for the formation of the H i void, CO 16.134–0.553/CO shell, and the H i filament.
Export citation and abstract BibTeX RIS

Original content from this work may be used under the terms of the Creative Commons Attribution 4.0 licence. Any further distribution of this work must maintain attribution to the author(s) and the title of the work, journal citation and DOI.
1. Introduction
CO 16.134–0.553 is a broad-velocity-width molecular feature (BVF) found in the Galactic plane with a spatial size of 3 × 4 pc2 and a velocity width of ∼40 km s−1 (Yokozuka et al. 2021). This was discovered through a systematic, unbiased search for compact (d < 10 pc) broad-velocity-width (ΔV > 5 km s−1) features in the CO J = 1–0 Galactic plane survey data obtained with the Nobeyama Radio Observatory (NRO) 45 m telescope (the FUGIN survey; Umemoto et al. 2017). The virial theorem mass of CO 16.134–0.553, MVT ≃ 2 × 10⁵ M☉, is 1.5 orders of magnitude higher than the gas mass, M ≃ 7 × 10³ M☉. It exhibits huge kinetic energy, Ekin ∼ 1049 erg, and short dynamical time, tdyn ≃ 1 × 10⁵ yr, which results in a kinetic power as high as ∼103 L☉.
This is only one out of 58 BVFs that has no counterpart either in the radio continuum (1.4 GHz, Beuther et al. 2016; Wang et al. 2020; 10 GHz, Handa et al. 1987), far-infrared (60–110 μm; Doi et al. 2015; Takita et al. 2015), or mid-infrared (3.4 and 4.6 μm; Wright et al. 2010) images (Yokozuka et al. 2021). Referring to the infrared luminosity (LIR) versus kinetic power (Pkin) plot, the 57 BVFs other than CO 16.134–0.553 were likely driven by protostellar outflows (Beuther et al. 2002; Maud et al. 2015; Li et al. 2018; Zhang et al. 2020). Despite the huge kinetic power of CO 16.134–0.553, its driving source is currently unidentified. This situation is quite similar to that of many high-velocity dispersion compact clouds found in the central molecular zone (CMZ) of our Galaxy (e.g., Oka et al. 2022).
To unveil the nature and origin of CO 16.134–0.553, we conducted follow-up observations using the NRO 45 m telescope (Section 2). This paper presents the newly obtained high-quality CO J = 1–0 line images and reports on the detection of SiO J = 2–1 line emission from this peculiar BVF (Section 3). We also revisited the FUGIN CO and H i survey data sets to determine the relationship between the large-scale structures and the BVF. Based on these data sets, we proposed a formation scenario for CO 16.134–0.553 (Section 4). The study is summarized in the last section (Section 5). The distance to CO 16.134–0.553 was assumed to be D = 4.0 kpc (Yokozuka et al. 2021).
2. Observations
We observed CO J = 1–0 (115.271 GHz) and SiO J = 2–1 (86.847 GHz) lines using the NRO 45 m telescope. A 382'' × 382'' area, which covers the entire CO 16.134–0.553, was mapped in 2020 February 17–18. The four-beam receiver system on the 45 m telescope (FOREST; Minamidani et al. 2016) with the spectral analysis machine on the 45 m telescope (SAM45; Kuno et al. 2011; Kamazaki et al. 2012) system were used in the observations. The half-power beamwidths of the telescope with FOREST were approximately 14'' and 19'' at 115 GHz and 86 GHz, respectively. We used the SAM45 spectrometer in the 1 GHz bandwidth (244.14 kHz resolution) mode. This frequency resolution corresponds to 1 km s−1 velocity resolution at 115 GHz. The system noise temperature (Tsys) ranged from 100 to 900 K during the CO observations and from 100 to 150 K during the SiO observations. The telescope pointing accuracy was checked and corrected every 2 hr by observing the SiO maser source VX-Sgr at 43 GHz. The pointing accuracy was maintained within 3'' in both azimuth and elevation. The intensity calibration of the antenna temperature was accomplished using the standard chopper-wheel method.
The obtained data sets were reduced using the NOSTAR reduction package. Linear fittings were used to subtract the baseline offsets from all the obtained spectra. The maps were convolved using the Bessel–Gaussian function and resampled onto a 7 5 × 75 × 2 km s−1 regular grid. We scaled the antenna temperature (
 ) by multiplying it with 1/ηMB to obtain the main-beam temperature (TMB).
3. Results
3.1. Morphology and Kinematics
Figures 1(a), (c) show the velocity-integrated and longitude–velocity (l–V) maps of CO J = 1–0 line emission. CO 16.134–0.553 comprises of a 5 pc length ridge elongated from Galactic southwest to northeast (hereafter referred to as "ridge") and a 2 pc size clump in the north of the ridge ("northern clump"). The ridge turns southward at (l, b) ≃ (16 11, − 058). A faint, filamentary structure ("northwestern filament") elongates toward the northwest from the center of the ridge. In the l–V plane, the ridge spreads in a fan shape toward higher velocities and connects two spatially extended emission components at VLSR ≃ 40 km s−1 and 65 km s−1. The 40 km s−1 component corresponds to molecular gas in the Norma Arm, while the 65 km s−1 component is not associated with the known Galactic spiral arm. Faint high-velocity features appear to penetrate the 65 km s−1 component, reaching VLSR ≃ 80 km s−1.
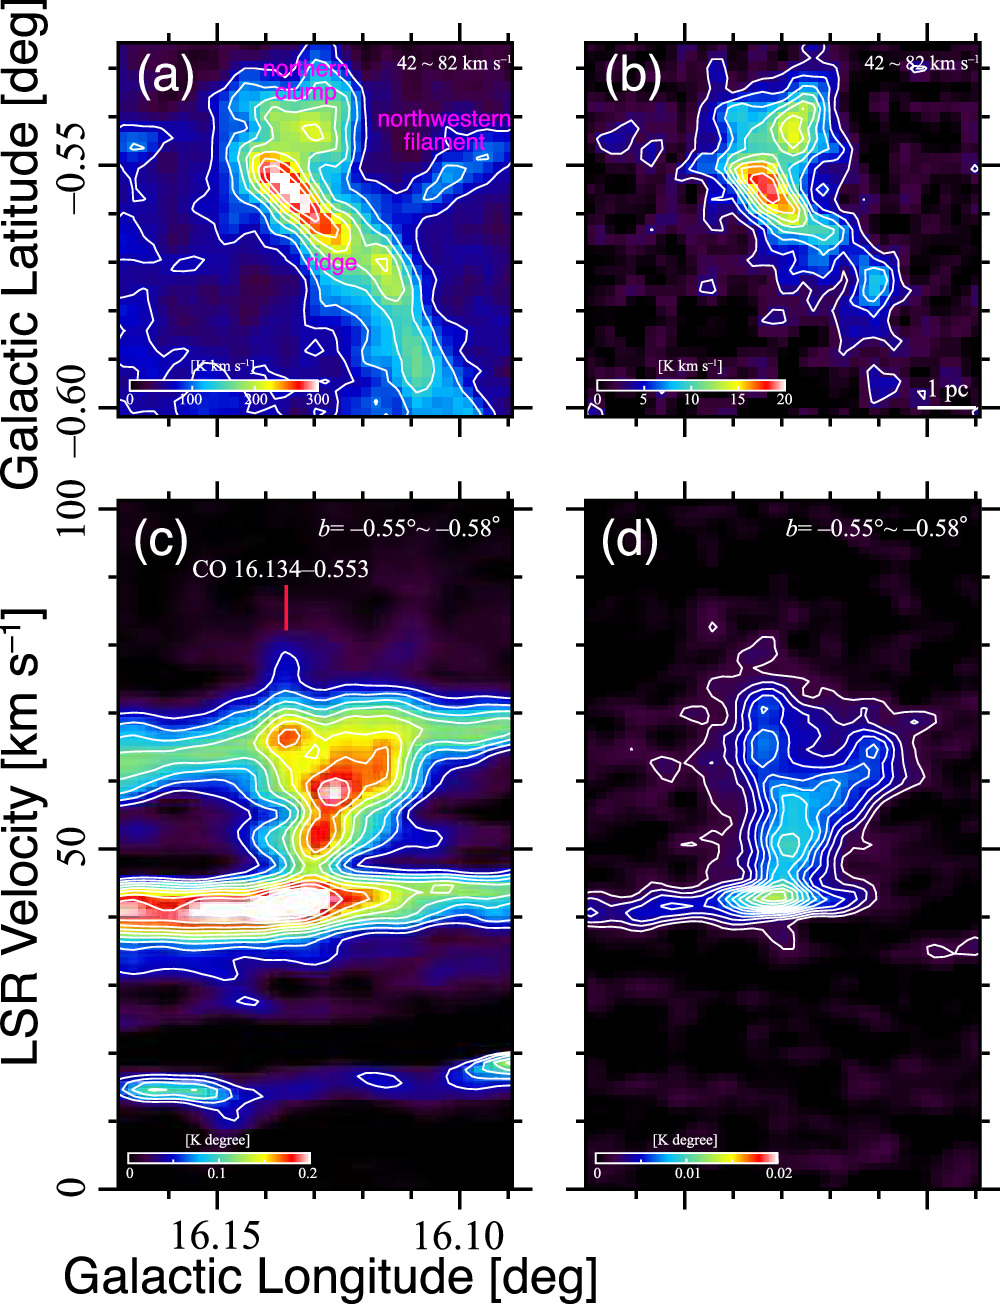
Figure 1. (a), (b) Maps of the velocity-integrated CO J = 1–0 and SiO J = 2–1 line emission, respectively. The velocity range for the integration is VLSR = 42–82 km s−1. Contours are drawn at 35 K km s−1 and 2 K km s−1 intervals for CO and SiO, respectively. (c), (d) Longitude–velocity maps of the CO J = 1–0 and SiO J = 2–1 line emission, respectively. Each emission was integrated at latitudes from b = −055 to −058. Contours are drawn at 0.02 K° and 0.001 K° intervals for CO and SiO, respectively.
Download figure:
Standard image High-resolution imageProminent SiO J = 2–1 line emission was detected from the ridge and northern clump of CO 16.134–0.553 (Figures 1(b), (d)). The SiO emission is less spatially extended than the CO emission. The southern half of the ridge is faint and clumpy. In the l–V plane, the ridge bifurcates at VLSR ≃ 55 km s−1, forming a V shape, which traces the edge of the fan shape in the CO l–V map. The spatially extended 40 km s−1 component is barely visible in the SiO l–V map, while the 65 km s−1 component appears to be absent. The positive high-velocity end of SiO emission also reaches to VLSR ≃ 80 km s−1.
3.2. Velocity-channel Maps
Figures 2 and 3 show the velocity-channel maps of the CO J = 1–0 and SiO J = 2–1 line emissions. In the CO velocity-channel maps, the ridge of CO 16.134–0.553 comprises several clumps of 1–2 pc in size. The northern clump appears in the velocity range of VLSR = 44–64 km s−1 and merges with the ridge at the higher velocities. The highest CO intensity was observed in the northern clump at (l, b, VLSR) = (1613, − 054, 51 km s−1). The 40 km s−1 component and faint 65 km s−1 component spread over the frames at VLSR = 40–44 km s−1 and VLSR = 64–68 km s−1 channels, respectively. The northwestern filament appears at VLSR = 64–72 km s−1. A pair of faint, compact high-velocity features originate from the northwestern filament at (l, b) ∼ (1610, − 055) on both velocity sides. The velocity extent of this pair of compact high-velocity features is VLSR ≃ 48–80 km s−1.
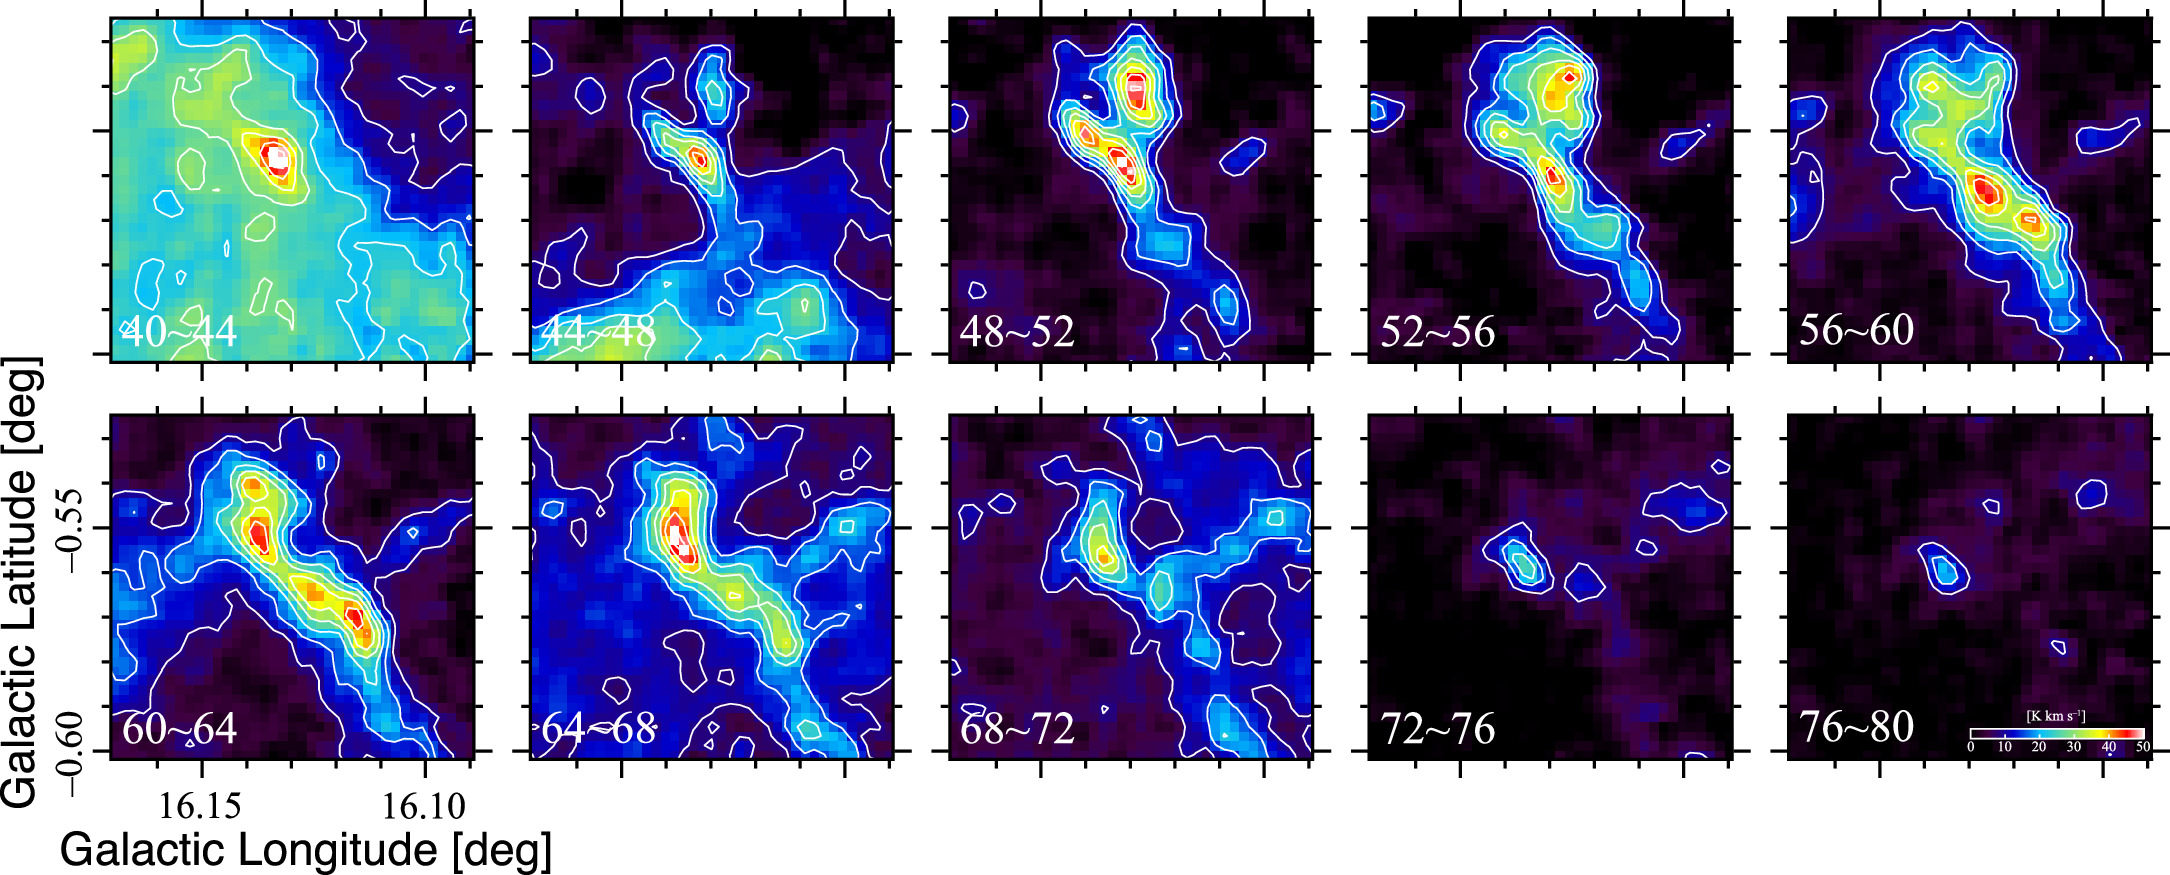
Figure 2. CO J = 1–0 integrated intensity channel maps calculated over a 4 km s−1 local standard of rest (LSR) velocity width. The intensity unit is K km s−1. A pair of numbers in the bottom left of each panel denotes the velocity range of integration. Contours are drawn at 6.5 K km s−1 intervals.
Download figure:
Standard image High-resolution image
Figure 3. SiO J = 2–1 integrated intensity channel maps calculated over a 4 km s−1 LSR velocity width. The format is the same as Figure 2. Contours are drawn at 0.5 K km s−1 intervals.
Download figure:
Standard image High-resolution imageThe SiO velocity-channel maps (Figure 3) delineate the less-extended spatial distribution of SiO emission. The northern clump and the northern two-thirds of the ridge are prominent in the SiO maps. The highest SiO intensity was observed at the center of the northern clump, with almost the same l–b–V position as that of the CO emission peak, (l, b, VLSR) = (1613, − 054, 50 km s−1). The 40 km s−1 component in the SiO map is less spatially extended and distributed around the northern part of the ridge. The 65 km s−1 component, the northwestern filament, and the southern one-third of the ridge are absent from the SiO maps.
4. Discussion
4.1. Physical Parameters
Using the newly obtained CO J = 1–0 data in the range of 1610 ≤ l ≤ 1615, −060 ≤ b ≤ − 052, and 42 km s−1 ≤ VLSR ≤ 82 km s−1, we recalculated the physical parameters of CO 16.134–0.553. The size parameter and velocity dispersion (definitions in Solomon et al. 1987) were calculated as S = 1.2 pc and σV
= 8.5 km s−1, respectively. These yield a dynamical time as tdyn = 1.4 × 10⁵ yr. Assuming the local thermodynamic equilibrium (LTE), the molecular gas mass (MLTE) of CO 16.134–0.553 was obtained as 5.1 × 10³
M☉. Here, we employed an optical depth of τ = 3.6 and excitation temperature of Tex = 18 K, which were derived from the FUGIN CO and 13CO J = 1–0 data using Equations (1)–(2) in Oka et al. (1998) with [CO]/[13CO] = 60. The kinetic energy was calculated using the definition,  , and obtained as 1.3 × 1049 erg. The kinetic energy and the dynamical time calculated above correspond to the kinetic power (Pkin ≡ Ekin/tdyn) as high as 7.8 × 10²
L⊙ (=3.0 × 1036 erg). This is at least 1 order of magnitude higher than that of bipolar outflows from massive protostars observed to date (e.g., Maud et al. 2015). Moreover, the absence of infrared counterpart resulted in a large departure of CO 16.134–0.553 from the infrared luminosity to kinetic power (LIR–Pkin) trend of protostellar outflows (Yokozuka et al. 2021).
, and obtained as 1.3 × 1049 erg. The kinetic energy and the dynamical time calculated above correspond to the kinetic power (Pkin ≡ Ekin/tdyn) as high as 7.8 × 10²
L⊙ (=3.0 × 1036 erg). This is at least 1 order of magnitude higher than that of bipolar outflows from massive protostars observed to date (e.g., Maud et al. 2015). Moreover, the absence of infrared counterpart resulted in a large departure of CO 16.134–0.553 from the infrared luminosity to kinetic power (LIR–Pkin) trend of protostellar outflows (Yokozuka et al. 2021).
4.2. Shock Signatures
Gas-phase SiO is a well-established probe for strong shock in interstellar space (e.g., Ziurys et al. 1982), and the critical density of SiO J = 2–1 line is as high as ∼105 cm−3 (e.g., Huang et al. 2022). Thus, the detection of widespread, broad-velocity-width SiO J = 2–1 emission from CO 16.134–0.553 indicates the presence of dense molecular gas that is affected by strong interstellar shock. Here we referred to the SiO J = 2–1/CO J = 1–0 intensity ratio (hereafter RSiO/CO) to assess the abundance of dense/shocked gas (Table 1). Ratios were calculated from velocity-integrated line intensities in units of kelvin kilometers per second. Apparently, RSiO/CO is determined with high significance across the whole of CO 16.134–0.553, being comparable to or even higher than those found at protostellar outflows (e.g., IRAS 00338+6312, IRAS 00494+5617). The ratio is the highest in the northern clump and is slightly lower in the northwestern filament. The 40 km s−1 component exhibits a very low RSiO/CO, while the 65 km s−1 component exhibits a value similar to the typical value in the CMZ of our Galaxy (S. Takekawa et al. 2024, in preparation). These results indicate that CO 16.134–0.553, and possibly the 65 km s−1 component, have recently experienced the passage of a strong interstellar shock.
Table 1. SiO J = 2–1/CO J = 1–0 Intensity Ratios
| Component | Ratio a |
|---|---|
| Ridge | 0.038 ± 0.005 |
| Northern clump | 0.059 ± 0.008 |
| Northwestern filament | 0.017 ± 0.002 |
| 40 km s−1 component | 0.0034 ± 0.0004 b |
| 65 km s−1 component | 0.0066 ± 0.0010 b |
| IRAS 00338+6312 | 0.028 c |
| IRAS 00494+5617 | 0.018 c |
| CMZ | 0.009 d |
Notes.
a Uncertainties come from the absolute calibration error of the data, which were estimated from the intensity reproducibility during observations (≃10%). b Calculated by using pixels with TMB(SiO) ≤ 0.15 K. Velocity ranges for integration were VLSR = 38–48 km s−1 and 60–75 km s−1 for 40 km s−1 component and 65 km s−1 component, respectively. c Calculated from peak temperatures at each protostellar outflow presented in Harju et al. (1998) and Snell et al. (1990). d Typical value in the CMZ of our Galaxy (S. Takekawa et al. 2024, in preparation).Download table as: ASCIITypeset image
4.3. Large-scale Views
The presence of the spatially extended 65 km s−1 component and evidence for a widespread, strong shock indicate that a large-scale process is responsible for the acceleration of CO 16.134–0.553. Again, we referred to CO J = 1–0 data from the FUGIN survey (Umemoto et al. 2017) to reexamine the large-scale distribution and kinematics of molecular gas around CO 16.134–0.553. In the velocity-integrated CO map (Figure 4(a)), we noticed a shell-like structure with a diameter of ∼15 pc. Here, CO 16.134–0.553 appears to define the eastern edge of this 15 pc diameter CO shell (hereafter, "CO shell"). The 65 km s−1 component exhibits a spatial extent as large as that of the CO shell, while the 40 km s−1 component spreads over the frame (Figures 4(a), (b)). Several BVFs, including CO 16.134–0.553, connect the 40 km s−1 and 65 km s−1 components (Figures 4(b), (c)). The total molecular gas mass of the CO shell is ∼2 × 10⁴
M☉ (assuming  ), and the kinetic energy amounts to ∼1051 erg. The situation of CO 16.134–0.553/CO shell is very similar to that of Smith Cloud (Smith 1963), which is a high-velocity cloud plunging into the H i disk of our Galaxy (Lockman 1984; Lockman et al. 2008); however, the scale (size, mass, and kinetic energy) is far smaller (details in Section 4.4).

Figure 4. (a) Map of velocity-integrated CO J = 1–0 data obtained via the FUGIN survey. The velocity range for the integration is from VLSR = 55 to 80 km s−1. (b) Map of latitude-integrated CO J = 1–0 line emission. The latitude range for integration is from b = − 065 to −045. (c) Map of the longitude-integrated CO J = 1–0 line emission. The longitude range for integration is from l = 1593 to 1615.
Download figure:
Standard image High-resolution imageWe also referred to H i 21 cm line data obtained from the H i 4π survey (HI4PI Collaboration et al. 2016). Figure 5 shows two large-scale maps of the H i 21 cm line emission with different area sizes and velocity ranges for integration. We noticed a local decrease of emission at velocities from VLSR = 60 km s−1 to 100 km s−1 in the intense H i disk of the Galaxy (Figure 5(a)). This "H i void" is located at ∼05 above the CO shell, having a longitudinal size of ∼1° (=70 pc at a distance of 4 kpc). Far below the H i void/CO shell, we found a large filament with faint H i emission at velocities from VLSR = 40 km s−1 to 120 km s−1 (Figure 5(b)). This "H i filament" has the apparent length and width of ∼4° and ∼1°, respectively, corresponding to 280 pc and 70 pc at 4 kpc, respectively. This extends from the Galactic H i disk, from the position of the H i void/CO shell, toward negative Galactic latitudes. The total atomic gas mass of the H i filament is ∼105
M☉ (using the method in Dickey 1990). This situation may indicate that the high-velocity plunging of a massive object from the Galactic halo was responsible for the formation of the H i void/CO shell (CO 16.134–0.553)/H i filament.

Figure 5. Maps of H i 21 cm line emission around the CO shell denoted by white or black contours. The intensity unit is kelvin kilometers per second. (a) A 4° × 4° map of H i emission integrated over velocities between VLSR = 60 km s−1 and 100 km s−1. (b) A 10° × 12° map of H i emission integrated over velocities between VLSR = 40 km s−1 and 120 km s−1. Red contours show H i emission integrated from 60 km s−1 to 100 km s−1 at levels 100, 150, and 200 K km s−1.
Download figure:
Standard image High-resolution image4.4. Plunging Massive Halo Object Hypothesis
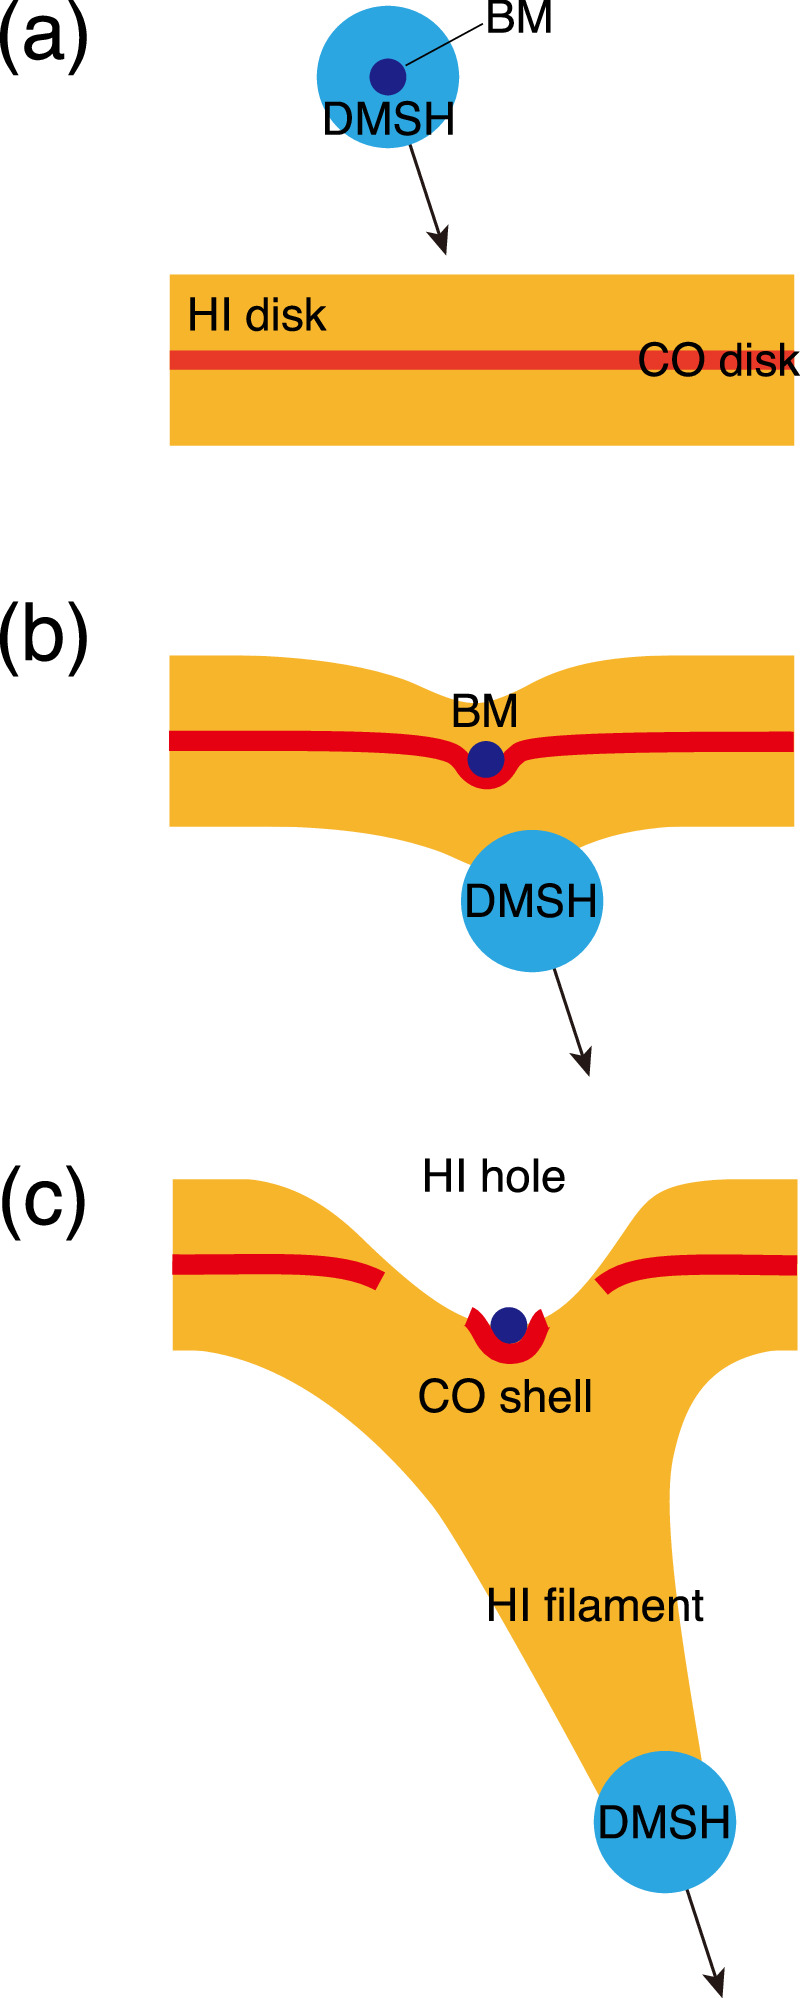
Based on the observational facts presented above, we propose the following scenario (Figure 6):
- 1.A small dark matter subhalo (DMSH) accompanied by a baryonic matter clump (BM) plunged into the Galactic disk.
- 2.The BM was stopped by the CO disk, forming the CO shell and CO 16.134–0.553, while the DMSH penetrated the Galactic disk.
- 3.The DMSH formed the H i filament by gravitational attraction, leaving the H i void in the Galactic disk.
This scenario was invoked by an analogy with the Smith Cloud (Lockman et al. 2008) and theoretical works that simulate a DMSH with BM impacting the Galactic disk (e.g., Bekki & Chiba 2006; Tepper-Garcia & Bland-Hawthorn 2018; Shah et al. 2019). The plunging scenario naturally explains all the observed kinematical features as well as the signatures of strong shock, whereas it assumed the presence of invisible objects (DMSH and BM).
Figure 6. Schematic image of the massive halo object plunging scenario. The cyan and blue filled circles show a dark matter subhalo (DMSH) and a clump of baryonic matter (BM), respectively. The orange area represents the atomic gas (H i) distribution, and the thick red line shows the molecular gas (CO) distribution.
Download figure:
Standard image High-resolution image
According to this scenario, the clump of BM, which is responsible for the formation of the CO shell, should measure ∼15 pc and predominantly consist of atomic hydrogen with an internal pressure comparable to that of molecular clouds, p/k ≳ 103 cm−3 K. Limited angular resolution of H i surveys ( for HI4PI) and widespread H i emission in the Galactic plane prevents the direct detection of the BM in the CO shell. We assume that the velocity width of the CO shell (VCO ≃ 30 km s−1) roughly represents the line-of-sight (LOS) component of the plunging velocity and that its longitudinal component is similar to the LOS component (∣Vl
∣ ≃ ∣VLOS∣). Using the longitudinal and latitudinal extents of the H i filament (Δl: Δb = 1: 4), we roughly estimated the latitudinal component of the plunging velocity as ∣Vb
∣ ≃ 4 × ∣Vl
∣ = 120 km s−1. Thus, the total plunging velocity of the BM/DMSH relative to the Galactic disk can be estimated as
for HI4PI) and widespread H i emission in the Galactic plane prevents the direct detection of the BM in the CO shell. We assume that the velocity width of the CO shell (VCO ≃ 30 km s−1) roughly represents the line-of-sight (LOS) component of the plunging velocity and that its longitudinal component is similar to the LOS component (∣Vl
∣ ≃ ∣VLOS∣). Using the longitudinal and latitudinal extents of the H i filament (Δl: Δb = 1: 4), we roughly estimated the latitudinal component of the plunging velocity as ∣Vb
∣ ≃ 4 × ∣Vl
∣ = 120 km s−1. Thus, the total plunging velocity of the BM/DMSH relative to the Galactic disk can be estimated as  km s−1. Considering the Galactic rotational velocity at the CO shell (≃220 km s−1), the total plunging velocity with respect to the Galactic center is ≃250 km s−1, which is a reasonable value for Galactic halo objects (e.g., Lockman 2002). Since the BM is left far behind the DMSH, it may have almost been stopped by the CO shell. The conservation of momentum of the BM+CO shell system, MBM
VBM ≲ (MBM + MCO)VCO, provides a mass estimate of the BM, approximately MBM ≲ 6 × 10³
M☉. The estimated parameters of the BM and Smith Cloud are summarized in Table 2, which demonstrates a sharp discrepancy in scale between these two objects.
km s−1. Considering the Galactic rotational velocity at the CO shell (≃220 km s−1), the total plunging velocity with respect to the Galactic center is ≃250 km s−1, which is a reasonable value for Galactic halo objects (e.g., Lockman 2002). Since the BM is left far behind the DMSH, it may have almost been stopped by the CO shell. The conservation of momentum of the BM+CO shell system, MBM
VBM ≲ (MBM + MCO)VCO, provides a mass estimate of the BM, approximately MBM ≲ 6 × 10³
M☉. The estimated parameters of the BM and Smith Cloud are summarized in Table 2, which demonstrates a sharp discrepancy in scale between these two objects.
Table 2. Comparison between the BM and Smith Cloud
| Parameter | BM | Smith Cloud |
|---|---|---|
| Size (pc) | 15 | 3000 × 1000 |
| Gas mass (M⊙) | ≲6 × 10³ | >4 × 10⁶ |
| Velocity (km s−1) | ∼250 | ∼300 |
| Kinetic energy (erg) | ≲7 × 1051 | >4 × 1054 |
| DMSH size (pc) | 15–70 | >3000 |
| DMSH mass (M⊙) | ∼6 × 10⁷ | >108 |
Download table as: ASCIITypeset image
The size of the DMSH should fall in the range from 15 to 70 pc, corresponding to the diameter of the CO shell and the thickness of the H i filament (see Figure 6). Equating the size of the H i void with twice the Hoyle–Littleton radius (Equation (6) in Edgar 2004 with v∞ = 130 km s−1), we can roughly estimate the mass of the DMSH as ∼6 × 10⁷ M☉. This value lies at the middle of the theoretically hypothesized "small" DMSH mass range of 106–9 M☉ (e.g., Bovy et al. 2017; Garrison-Kimmel et al. 2017). The detection and quantification of such small DMSHs is one of the most important goals of the ΛCDM cosmology (Bullock & Boylan-Kolchin 2017). It is expected that the high-velocity plunge of such an object, which makes a H i void and filament, would have left certain signatures in the Galactic disk stellar population as well. The detection of a "vertical-velocity-field anomaly" toward the root of the H i filament in the Gaia astrometric data will be presented in a separate paper (K. Udagawa et al. 2024, in preparation).
5. Summary
We have performed mapping observations toward the BVF CO 16.134–0.553 in the CO J = 1–0 and SiO J = 2–1 lines using the NRO 45 m telescope. The results are summarized as follows.
- 1.The new CO maps showed that the 5 pc size BVF bridges two separate velocity components at VLSR ≃ 40 km s−1 and 65 km s−1 in the position–velocity space.
- 2.Prominent SiO emission was detected from the BVF and its root in the VLSR ≃ 40 km s−1 component, indicating the passage of strong interstellar shock.
- 3.Referring to the large-scale CO data, CO 16.134–0.553 appeared to correspond to the Galactic eastern rim of a 15 pc diameter expanding CO shell.
- 4.An 70 pc diameter H i void and 280 pc long vertical H i filament were also found above and below the CO shell, respectively.
- 5.A DMSH plunging scenario that has formed the H i void, CO 16.134–0.553/CO shell, and H i filament was proposed.
Acknowledgments
This study is based on observations at the Nobeyama Radio Observatory (NRO). We are grateful to the NRO staff for facilitating the operation of the telescope. The NRO is a branch of the National Astronomical Observatory of Japan, National Institutes of Natural Sciences. We used the FUGIN data (https://nro-fugin.github.io/release/). The data were retrieved from the JVO portal (http://jvo.nao.ac.jp/portal/) operated by ADC/NAOJ. T.O. acknowledges the support from JSPS Grant-in-Aid for Scientific Research (A) No. 20H00178.