


Abstract
The presence of water condensation in the lunar polar region has been reported. However, the origin and amount of water remain unknown, and information on the migration mechanism of water is key for understanding the delivery of water to the Earth–Moon system. We herein report the first identification of the migration process observed as localized and condensed plumes of water ice/gas mixtures ejected from the lunar surface to space in the polar region based on spectral data derived by SELENE/Kaguya. We identified water and other volatile absorption in 10,200 spectra at the nonpermanent shadowed region during the nighttime when no illumination reached the lunar surface, while nearly horizontal solar light at these regions could illuminate the sky. Ray-tracing analyses suggested that the majority of the observed volatile signal did not come from the lunar surface but from the sky (space). The majority of the identified plumes were observed at or near the hydrogen distribution reported previously. Volatile materials were repeatedly identified in some locations and most of the plume events did not coincide with the major meteoroid streams. Rather, more signals were identified during the winter season in each pole. The timing, duration, location, and temperature simulations all suggest that impact events cannot be their main origin, but rather the volatile sublimation from the subsurface (∼10 cm depth). Overall, it was revealed that the lunar polar region is active in terms of volatile migration, which is significant for understanding water delivery to the Earth–Moon system.
Export citation and abstract BibTeX RIS

Original content from this work may be used under the terms of the Creative Commons Attribution 4.0 licence. Any further distribution of this work must maintain attribution to the author(s) and the title of the work, journal citation and DOI.
1. Introduction
Multiple recent remote sensing data demonstrated water ice condensation in the lunar polar region (Pieters et al. 2009; Sunshine et al. 2009; Sanin et al. 2017). Possible sources of water in the lunar polar region are comets, asteroids, solar wind implantation, and volcanic gas. Most of the previous reports suggested water ice presence at the surface of the Moon in its permanently shadowed regions (PSRs; e.g., Li et al. 2018). Moreover, an artificial impact experiment conducted by the Lunar Crater Observation and Sensing Satellite (LCROSS; Schultz et al. 2010) suggested the presence of water at a depth of several meters in the impacted site (Colaprete et al. 2010). However, the origin, amount, and input/output flux of volatile materials at the lunar surface remain unknown, and obtaining information about the migration (condensation/sublimation) mechanism is important to understand the current and possibly ancient delivery system of water (the origin, amount, and input/output flux of water) to the Earth–Moon system. Thus, in this work, we investigated the migration of volatile materials in the lunar polar region.
2. Methodology
2.1. Data
In this study, we analyzed data obtained by the Spectral Profiler (SP; Matsunaga et al. 2008) on board the Selenological and Engineering Explorer (SELENE/Kaguya; Kato et al. 2010). The analyzed SP data includes visible and near-infrared wavelengths with a spatial resolution of 500 m. We used SP level 2c data, which contains radiance and reflectance data (Yamamoto et al. 2011). The SP data is open to the public at https://data.darts.isas.jaxa.jp/pub/pds3/sln-l-sp-4-level2c-v3.0/. The spacecraft's altitude was 100 ± 30 km during the 1 yr nominal mission, and it was reduced to ∼15 km in the extended mission (Kato et al. 2010). Although SP covers a wavelength ranging from 512 up to 2600 nm, we focused on the wavelength range of 513–1644 nm because the higher signal-to-noise ratio (S/N) at this wavelength (≥1000 at 5% reflectance) is highly advantageous for spectral analyses at the darker polar region. SP essentially observed the daytime (dayside) lunar surface in every satellite's orbit with a small margin (a few degrees) in the nighttime (nightside) in the polar region (Yamamoto et al. 2011). Moreover, in some orbits (roughly once a day to once a week), SP further continued observation toward the nighttime at 10° (corresponding to ±80° in latitude) or more with the aim of obtaining dark level signal data. The distribution of the available nighttime data before screening was calculated and is presented as a density map (available nighttime data number per degree) for both poles (Figure 1). These maps indicate that enough nighttime observations are available in most of the polar region (≥ ±80°). Moreover, the observation density tended to increase toward higher latitudes, as the satellite orbits became closer to each other toward the poles.
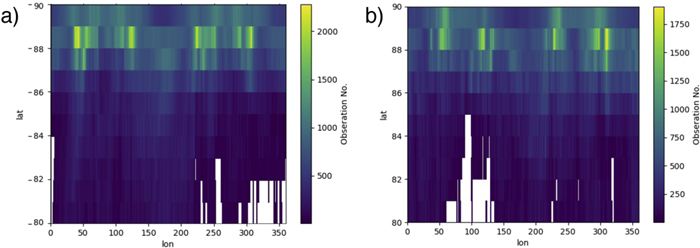
Figure 1. Observation density of the available nighttime (i > 90°) SP data (after Step 0). (a) and (b) are the south and north poles. The density was calculated for each 1 × 1 longitude and latitude degree. The white part corresponds to the area with no available data.
Download figure:
Standard image High-resolution image2.2. Data Screening and Identification of Absorption
First, the nighttime SP data observed in the polar region was selected. We focused on nighttime data because identifying the weak absorption signals of volatile materials (assuming a small amount of volatile materials) can be easier with nighttime data (Appendices A and B). Afterward, we performed data screening to identify the data with enough signal and low noise in the analyzed wavelength range. Then, the identification of absorption was conducted by using the data of wavelength range of 955.4–1644.2 nm, which corresponds to the near-infrared shorter wavelength (NIR 1) sensor range of SP due to the absorption of the volatile materials located in this wavelength range. Moreover, we used this range to prevent false identification of absorption, which can be caused by a residual error in the data calibration/correction procedure at the visible and NIR 1 sensor switch (around 950 nm).
Because the SP data analyzed in this study is from nighttime observations, where basically no sunlight reaches the lunar surface at nominal elevations and no signals are expected under normal circumstances (though we did identify clear signal presence), we conducted a careful evaluation to check if the absorption identified in this study really originates from volatile materials, which might be located somewhere between the lunar surface and the spacecraft or might have artificial origins, such as calibration errors or stray light. In this study, nighttime refers to the instance in which the incidence angle is larger than 90°. The incidence angle was calculated assuming a spherical Moon; therefore, this criterion alone cannot guarantee an unilluminated terrain as there may be illumination at a high elevation area. Thus, to confirm the unilluminated conditions, we conducted ray-tracing analyses with the local topography included. The results clearly indicated that an artificial origin is unlikely and that the identified absorption is real; thus, we proceeded with our data analysis based on this knowledge (the identified absorption is real). The detailed description and results of this evaluation (including the possibility evaluation of stray light) procedure are summarized in Appendix C.
Step (0). To collect nighttime observation data, it is necessary that the latitude is higher than ± 80° and that the incidence angle is larger than 90°. The incidence angle is the angle between the Sun and the normal vector from a satellite to an observed spot. Affected by the local topography and orbital inclination of the Moon, an incidence angle larger than 90° does not guarantee nighttime observation, and solar illumination may reach the local topographic high or a high latitude area (larger than ± ∼88 5) during the summer season in selected data. Therefore, the local time and solar illumination conditions may differ from normal perceptions (e.g., local midnight location, which is calculated by assuming a spherical Moon that can be illuminated by the Sun). However, for this study, nighttime data is not vital, as the purpose of this study is to find spectra with volatile absorption, and it is fine if volatile absorption is identified in the data observed under the illuminated condition.
Step (1). We selected a valid data set with a signal level larger than the dark level and low noise by using 0.02 W/m2/μm/str (corresponding to 1 DN of SP instrument) as a criterion at more than 80% wavelength band data in the range of 512–1644 nm. Radiance data was used for this process, as it is linearly correlated with the original signal strength. Then, by calculating the moving average of the scaled radiance data at the wavelength of 750 nm, we evaluated the noise level and selected low noise data (RMS ≤ 0.2). The incrementation number of the moving average was set to 5 in this study in all steps. We confirmed that different RMS values do not affect the results and main conclusion.
Step (2). The saturated data was eliminated by the data that has the upper limit reflectance value in one or more wavelength bands. Note that, theoretically, reflectance does not exceed 1. However, the SP reflectance observed in polar regions sometimes has a value larger than 1, likely due to the small residual error in the photometric correction for the data observed at large phase angle conditions (nearly 90° or more). In the SP data processing step, a photometric correction was applied at the conversion from radiance to reflectance, and the saturation caused by this photometric correction only occurred in the reflectance data. Therefore, we eliminated the saturated data after Step 1 (data screening in radiance data). Afterward, by smoothing the scaled radiance data at the wavelength of 750 nm, the data with RMS ≤ 0.2 was selected.
Step (3). By using the "find_peak function" implemented in Python, 6 the identification of absorption was applied to the NIR 1 sensor wavelength range (955.4–1644.2 nm). The data was flipped upside down before applying the function and was flipped back to the original side to generate the required plots. The parameters of the identification of absorption were set to width = 5 and prominence = 0.08. An example of the identified absorption is presented in the schematic image in Figure 2. Through this procedure, we identified the absorption of volatile species such as H2O ice and H2O gas (and possibly methane and ammonia) by using nonoverlapping absorption of each species: 1480–1520, 1080–1120, 1140–1180, and 1190–1230 nm, respectively. We selected these wavelength ranges to separately identify the presence of the volatile species based on a previous laboratory study and simulation (Clark 1981; Grundy et al. 2002; Gordon et al. 2022).

Figure 2. Data screening and identification of absorption flow. Our data analysis procedure is summarized from Step 0 to Step 3 with example spectra. The numbers in each step box denote the numbers of SP data sets after data screening in the south (S) and north (N) poles. In Step 3, the number of the identified areas of absorption is indicated in parenthesis (multiple areas of absorption were identified in one data set in many cases). The original spectra (gray) and moving averaged spectra (black) are both presented in the plots for Steps 1–3. Note that the wavelength range of the right bottom plot differs from that of other plots.
Download figure:
Standard image High-resolution image3. Results
3.1. Observation Configuration of the Identified Volatile Absorption
Based on the data screening and identification of the absorption procedure described in the previous section, we found 13,000 absorptions of volatile materials in 10,200 spectra among ∼2,380,000 available SP data points of the polar nighttime observation, where absorption was found to be 0.4% of the analyzed SP data. A schematic configuration of the representative observation (Event A) in which the absorption was identified is shown in Figure 3(a). As shown in the figure, we simulated the solar illumination condition of the respective SP data at the exact observation timings using a digital terrain model (DTM) generated by the Lunar Orbiter Laser Altimeter (LOLA; Smith et al. 2010) on board the Lunar Reconnaissance Orbiter spacecraft (LRO; Tooley et al. 2010; Figure 3(b)). 7 When SP took data of the footprint position 1 (P1; Figures 3(a) and (b)), the lunar surface was directly illuminated by the Sun because of its higher local topography in this observation case. At position 2 (P2), the satellite and upper part of the instrumental line of sight were illuminated by the Sun, whereas the lunar surface was not illuminated by either direct or reflected solar light. Spectrum observed at the directly illuminated P1 position (the open circles in Figure 3(c)) exhibited a normal regolith spectral shape (smooth sloped spectra) similar to the representative lunar highland soil (regolith) spectra obtained at the laboratory (Taylor et al. 2010); gray hatches in Figure 3(c)). The smooth sloped spectra of the lunar regolith indicate the space weathering effect (formation of nanometer size iron metal on the mineral grain surface caused by long exposure to solar wind irradiation and micrometeorite bombardment. However, the P2 spectrum of the completely unilluminated location (the filled circles in Figure 3(c)) was clearly different from the representative lunar highland soil and P1 spectrum, as it had a steeper slope at the wavelength shorter than 1000 nm, kinking around 1000 nm, and a negative slope at longer wavelength than 1000 nm. This shape of the P2 spectrum is not typical for lunar regolith; the zigzag shape is attributed to the absorption of volatile species (see the paper of Tanaka et al. for more details).
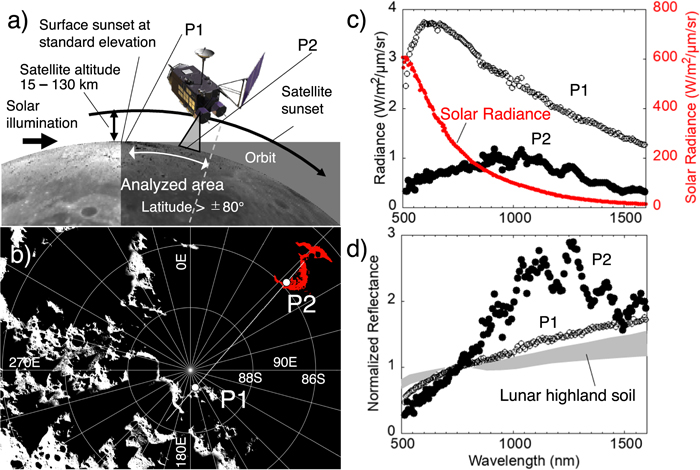
Figure 3. Observational configuration and examples of the SP data. (a) Schematic observation configuration for the position 1 (P1) and position 2 (P2) data presented in (c). Solar illumination was from the left side. The dark gray hatch at the bottom right corner indicates the area where no solar illumination is reached. The P1 and P2 correspond to the center of the SP's footprint at each observation timing. P1 of the lunar surface was observed when the lunar surface and satellite were directly illuminated by the Sun. P2 was observed when the lunar surface was in a shadow and the satellite was illuminated at the location between the surface sunset and satellite sunset. The light gray cone attached to the satellite is an SP's line of sight. The lower part of the line of sight including the lunar surface, was in a shadow, while the upper part was illuminated. (b) Simulated illumination condition of P2 at the south polar region during event A in Figure 4 (shown by polar stereographic projection). The white and black regions correspond to the illuminated and unilluminated locations, respectively. The white dots and line represent SP's footprints (P1 and P2; not in actual scale) and the schematic footprints between P1 and P2, respectively. The red hatch is a simulated result of a directly visible area from P2. It was confirmed by the simulation that the red hatch was far from any white illuminated area at the observation timing, indicating that P2 was not illuminated by direct or reflected solar light. (c) Radiance spectra observed at P1 (white dots) and P2 (black dots) (left y-axis) with solar radiance (red dots) (right y-axis) used for SP's data calibration. (d) Reflectance spectra observed at P1 and P2 with representative laboratory spectra of the lunar highland soil (gray hatch) obtained by Apollo 16 (Taylor et al. 2010). All spectra were normalized at 750 nm.
Download figure:
Standard image High-resolution image3.2. Distribution and Timing
The locations of the identified volatile absorption were plotted (cross in Figure 4), and the plot indicates that the locations were widely expanded in both polar regions; however, at the same time, the distribution was heterogeneous, and the absorption was concentrated in some locations. Therefore, the origin of the volatile absorption appears to be a kind of localized material. Observation timings of the identified volatile absorption were also heterogeneous (not constant); thus, the identified volatile absorption appeared as clustered both spatially and temporally (Figure 4). Therefore, we hereinafter call these identified absorption phenomena as event(s). The lateral size of the events ranges from hundreds of meters up to 100 km and they were observed at the spacecraft's altitude range of 15–110 km (Figure 5) with the intensive identification (dense identification of absorption) corresponding to the lower altitude in most cases (Events A and B in Figure 5). The locations of the events correspond to non-permanently shadowed regions (non-PSR) in most cases (PSR presented as white hatches in Figure 4). In some big events (Events A and B; black arrows in Figure 4), the event area was partially extended to the PSR (e.g., PSR in Shoemaker of Event A; Figure 4). However, at the same time, it is clear that the majority of the events (volatile absorption) were identified at the non-PSR, in contrast to the previous report of water ice identification mostly at the PSR (Li et al. 2018) as detected in Chandrayaan-1 M3 data (Pieters et al. 2009). As shown by the blue hatches in Figure 4, the majority of the identified events are located at or near the hydrogen distribution obtained by the neutron spectrometer (NS) data reported in previous studies (Feldman et al. 2001; Sanin et al. 2017) though there are exceptions such as observation at 0E, 80N. We conducted statistical analyses to determine how many of the locations corresponding to the absorption identified data (among 10,000 spectra) reside in the region with higher hydrogen concentration and found that of the spectra analyzed, 97% of the south pole spectra and 89% of the north pole spectra correspond to at or within 15 km from the high hydrogen region. This threshold distance (15 km) was selected as this is the lowest altitude of the SELENE/Kaguya satellite during the observation period, and we assumed that the ejection points of the observed volatile signal could be 15 km away from the observed location under the assumption that the observed volatiles are ejected into space. Note that while the highest hydrogen concentration area in the NS data (purple color) corresponds to PSR, the location of the identified events in this study is mostly limited to the non-PSR (blue color region). Moreover, the majority of the events located at or near the higher sublimation rate area are derived by the simulation of the lunar surface temperature based on the lunar topography and temperature measurement by Schorghofer & Williams (2020). The higher surface sublimation area reported by Schorghofer & Williams (2020; red regions in Figure 4 of their paper), which is larger than 10 km, is indicated by the red triangles in Figure 4(a) (size of the red triangles roughly corresponds to the size of the higher sublimation area). These are high sublimation areas, where water ice is stable in a short time span, such as 1 lunar day, but unstable in a longer time span. The higher surface sublimation areas correspond to higher subsurface sublimation areas because the sublimation rate from the subsurface is proportional to the sublimation rate from the surface (Equation (10) in Schorghofer & Williams 2020). To perform statistical analysis, we checked how many of the identified spectra reside on or near the high sublimation area and found that 93% of the spectra correspond to at or within 15 km from the high sublimation area. We set the threshold distance at 15 km, similar to the hydrogen statistics.
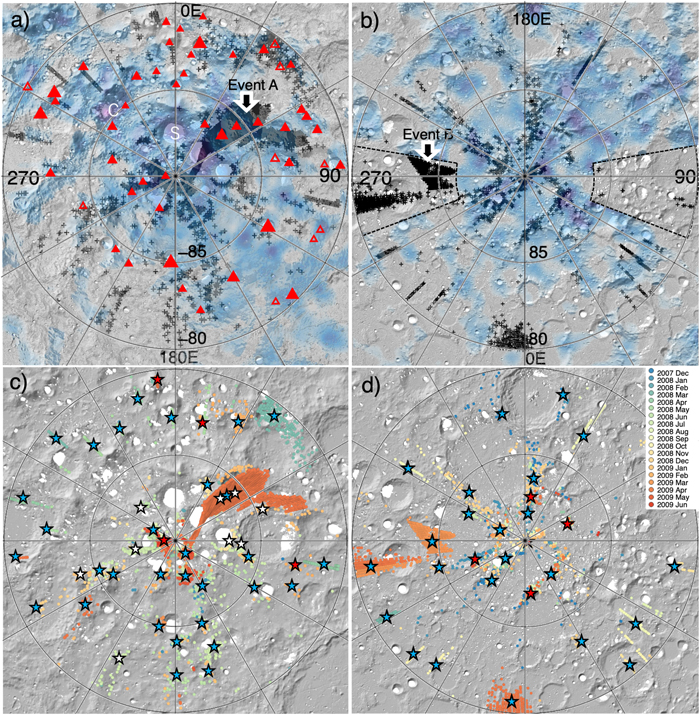
Figure 4. Distribution of the identified volatile spectra. (a) The cross marks indicate the location of the identified volatile spectra at the south pole plotted onto the hill shade base map using a DTM generated by LOLA (on board the LRO spacecraft). The white hatches denote the locations of PSR (most of the PSRs are overlaid by hydrogen hatches). The blue to purple hatches denote the hydrogen distribution presented as water equivalent hydrogen as observed by the LRO Lunar Exploration Neutron Detector (LEND; Mitrofanov et al. 2010) reported in Sanin et al. (2017) (The blue shades are larger than 0.1 wt.% and the purple shades are larger than 0.5 wt.%). The red triangles indicate locations of high sublimation rate in the south pole (>10,000 kg/m2/Gyr) reported in Schorghofer & Williams (2020), which expand larger than 10 km (their size indicates the area of the high sublimation at each location). Filled and not filled triangles indicate high sublimation area on/not-on PSRs. C and S indicate the locations of the Cabeus region and Shoemaker. (b) North pole. The symbols are the same as (a). The dashed line regions at 90° and 270° denote area LEND data is missing. Location of the events that contained the largest number of absorption at each pole are indicated by a black arrow with white borders (events A and B). (c) and (d) are the same as (a) and (b) but are presented in symbols color-coded based on the time of observation in the south and north poles. The data observed in 1 Earth month are presented with the same colors. The star symbols represent the rough center of a group of identified absorption events determined by their location and timing. Blue stars represent events in which a single event was identified, while red stars represent events in which multiple events were identified. White stars are locations in which some contribution of the signal from the lunar surface caused by reflected light from the surroundings may be present based on ray-tracing analyses.
Download figure:
Standard image High-resolution image
Figure 5. Timing of the identified volatile observation. (a) and (b) are histograms of the total observation number (including no signal data) in the log scale at the south and north poles (≥±80° latitude) over the observation timing. (c) and (d) are histograms of the identified volatile absorption number in the log scale (left-hand side axis) and the satellite altitude (black dots, right-hand side axis) at the south and north poles. The observation timings of the large identified absorption areas (events A and B in Figure 4) are indicated by black arrows. The identification procedure of volatile absorption is described in the methods section. Vertical dot lines in (c)–(f) are the timing of major meteoroid showers, which are listed below (see text for data source). Quadrantid: Qua; Lyrid: Lyr; Eta Aquarid: Aqua; Perseid: Per; Orionid: Or; Leonid: Leo; Geminids: Gem. The bin for all the histograms is 7 Earth days. (e) and (f) denote the subsolar latitude (gray lines, left-hand side axis) and ecliptic latitude (asterisk, right-hand side axis) of major meteoroid shower sources. The light gray hatches denote the winter periods for each pole. The gray vertical hatches are the meteoroid activity maxima (June) observed by radar (Jopek & Kaňuchová, 2017).
Download figure:
Standard image High-resolution imageVolatile absorption was identified as multiple events over the 18 month observation period of SP from 2007 December to 2009 June. Their temporal occurrence is heterogeneous in spite of the relatively homogeneous amount of nighttime observation data (Figures 5(a) and (b)) and homogeneous spatial observation coverage (Figure 1) throughout the observation period. Rather, a large portion of the events occurred during the winter periods for each pole; however, there are exceptions (light gray hatches in Figures 5(e) and (f)). The timing of the identified event does not coincide with the major meteoroid showers (vertical dotted lines) 8 in most of the cases (Figure 5). While some events were apparently identified during the major meteoroid showers in the south pole region, the ecliptic latitudes of the meteoroid shower sources (asterisk in (e) and (h)) do not match the observed south pole events. For example, one of the biggest events (2009 April) at the south pole apparently coincided Lyr; however, its source is located around 60° north. Therefore, it is difficult to confirm that Lyr is the origin of this event. Moreover, based on radar observations, the maximum activity period of the major meteoroids is known to be June (Jopek & Kaňuchová 2017; vertical dark gray hatches in Figure 5); however, the identified volatile absorption events were obviously not maximum in June.
The local time calculation of the identified events (Figure 6; y-axis is the number of the identified volatile absorption) indicates that they occurred at nighttime, which is natural as we selected data observed at an incidence angle ≥ 90°. However, the events not only occurred throughout the nighttime. Apparently, the number of the identified volatile absorption increased toward midnight in both poles on a log scale rather than decreased from the day/night border (terminator) toward midnight. This evidence suggests that events can occur after a certain time gap of the surface sunset, which needs a specific mechanism to explain, as discussed in the discussion section.
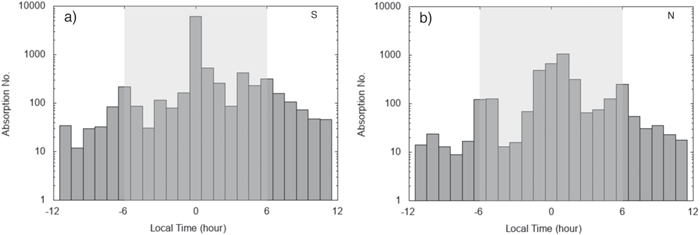
Figure 6. Local time of the identified volatile absorption (a) and (b) are the histograms of the identified volatile absorption number with local time at the south and north poles. The local time was derived from the subsolar point longitude of each observation point assuming a spherical Moon. Midnight (0 hr) is placed at the center. The y-axis is on a log scale. The gray hatches represent the local nighttime. Note that although only nighttime data (incidence angle larger than 90°) was used for our data analysis, there is data having local time indicating daytime (−12 to 6 and 6 to 12 hr) in these figures. This is because, at a latitude higher than ±88.46°, the calculated local noon using the subsolar point during winter can be an unilluminated area (nighttime) due to the orbital inclination effect of the Moon. Clearly, the identified absorption number is larger at approximately midnight (0 hr) in both poles.
Download figure:
Standard image High-resolution imageDeriving the number of events and their exact sizes is not easy, as the instrument's footprint moves continuously as the satellite moves and SP can only observe tiny portions of the lunar polar region at a time. Moreover, it is difficult to set a threshold for distinguishing different events spatially and temporally. However, as demonstrated in Figure 4(c) and (d), we identified 44 and 28 events for the south and north poles as conservative numbers based on the location and observation timing data that was recorded during the 18 month observation period of SP. This figure also demonstrates that the events occurred repeatedly at many locations.
3.3. Brightness and Spectral Characteristics
The brightness of the identified events corresponds roughly up to 0.1% of the solar illumination in the case of the brightest event. This is brighter in multiple orders of magnitude than the previously reported dust cloud generated by one meteoroid stream, which enveloped the entire Moon (Wooden et al. 2016), or the permanent thin cloud generated by multiple meteoroid streams (Horányi et al. 2015) or dust levitation (lofted dust reported by observation at the daytime-nighttime terminator region) in previous studies (McCoy 1976; Glenar et al. 2011).
The absorption data were compared to laboratory measurements and modeled spectra using the high-resolution transmission molecular absorption database (HITRAN; Gordon et al. 2022), and the results suggest the presence of water ice and water vapor (and possibly methane and ammonia) among the observed SP data (see detailed discussion in the companion paper by Tanaka et al.). The center wavelength and strength of the absorption vary significantly with time and location, as demonstrated in Figures 7 and 11 in this paper. This suggests the relatively constant presence of water and variation with time and space of the chemical composition (abundances of other species) of the volatile material.

Figure 7. Temporal variation of one event. (a) Observed location. The dots (appear as lines) denote the footprints of all the observations of SP (gray) and those of the identified absorption (dark gray) obtained from 2009 April 19–22. Multiple observations of one area (surrounded by black line; S88.0-S88.5, E45-E60) were achieved because of the satellite orbiter overlap. (b) Histogram of the observation number over time. Light and dark gray represent all of the available SP data and the absorption identified data numbers. (c) denotes DN (raw signal) variation of the SP data over time. The gray hatch in (c) corresponds to the identified event duration. Note that data before and after the event was plotted to show signal (DN) increase during the event compared with the non-hatched periods (before and after the event). The moving averaged radiance and scaled reflectance (scaled at 750 nm) of the absorption identified data from orbit 6881 are presented in (d) and (e), respectively, corresponding to the vertical line in (c) obtained over 6 s. The spectra are shifted by 0.2 and 0.4, respectively, based on the time sequence from bottom (first) to top (last). Gray hatches indicate the absorption location of water ice. The increase in signal at the gray hatched period in (c) and the constant identification of absorption for 44 h suggest the continuous presence of the volatile materials for this period. In (d) and (e), absorption near 1500 nm (gray hatch) is present in all spectra, while the presence of absorption around 1000, 1100, 1200–1300, and 1300 nm vary with time, suggesting a constant water presence and variation of the chemical composition (abundance of other species) in the ejected material.
Download figure:
Standard image High-resolution image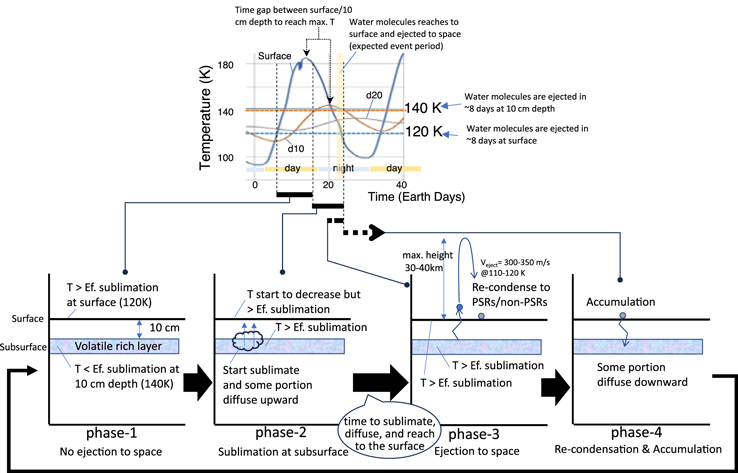
Figure 8. Temperature simulation of the lunar surface/subsurface (top) and schematic image of volatile ejection process in our proposal (bottom). In the top panel, simulated temperature variations of one location in the south polar region (∼ −90° in early spring) at the surface, 10, and 20 cm depth from the surface are plotted with time (presented as Earth days). The daytime and nighttime periods for the spherical moon model are hatched in orange and blue horizontal lines (actual illumination condition at the simulated location may differ from the hatched periods as a result of local topography). Horizontal bars and vertical dot lines in the top panel correspond to phases (from 1–4) of the volatile ejection process described in the bottom panel. Effective sublimation temperature (EST) of the surface (120 K) and 10 cm depth (140 K) are presented as horizontal broken lines. Vertical orange hatch indicates the ideal time period for water molecules sublimated from 10 cm depth to reach the surface and be ejected into space. Note that there are time gaps between the maximum temperature of the surface and the subsurface. In phase 2, because of the same ice loss rate at the surface and 10 cm depth (temperature are larger than their EST), a portion of ice originally locates at 10 cm depth and will start to sublimate and diffuse. And after some Earth days had passed, the ice molecules reached the surface and were ejected into space (phase 3) at a velocity of 300–350 m s−1 (it is estimated by the Maxwell–Boltzmann probability distribution as described by Butler 1997). The ejected water molecules will go up and then go down to the surface and eventually recondense at a low-temperature site. After the recondensation, some portion of the water molecules will diffuse downward and accumulate (phase 4).
Download figure:
Standard image High-resolution imageFrom Figure 7(d), we observe that the signal strength varies more at <950 nm wavelength than at >950 nm, while the spectral shape varies both at <950 and >950 nm (Figure 7(b)). The absorption identified spectra exhibit steeper slopes at <1000 nm than that of the normal lunar highland soil, showing a kink near 1000 nm and a negative slope at longer wavelengths, as indicated in Figure 3(d). In addition, when we compared spectra obtained under different illumination conditions, spectra without effective illumination with volatile absorption (Figure 9(c)) have steeper spectral slopes at short wavelengths (<1000 nm), while partially illuminated (by reflected light) spectra (Figure 9(f)) without volatile absorption has a convex and shallower spectral slope from the normal lunar regolith at <1000 nm. Similar spectral characteristics are observed in Figure 11 in unilluminated spectra ((a) and (b)) and partially illuminated (by direct light) spectra in (c). These spectral characteristics (concave or flat and steeper slope at shorter wavelength <1000 nm, kink at 1000 nm, and negative slope at longer wavelengths), clearly differ from that of the normal lunar regolith or solar spectra, indicating a non-surface origin for these spectra.

Figure 9. Example of the illumination condition and derived reflectance spectra. (a) Illuminated area by the Sun shown as white when SP's footprint is at the green dot (rev. 6873; during event A). (b) Same as (a) with the directly observable area from the green dot shown in red. (c) Reflectance spectra derived at the exact timings of (a) and (b). Volatile absorption was identified in this spectrum, and (d)–(f) are the same as (a)–(c) (rev. 6186). No volatile absorption was identified in this spectrum. The inserted figure in (d) is a close-up of the white area in (d).
Download figure:
Standard image High-resolution image3.4. Duration and Temporal Variation
SP is a line profiling instrument with a narrow swath (∼500 m), and the satellite orbits the Moon every 2 hr, where the Moon rotates 33 km at the equator during one satellite orbit. Therefore, the footprints of SP rarely overlap. However, at a special location where the satellite orbit overlaps each other, the duration and temporal spectral variation of an event can be checked. Figure 7 illustrates such a rare observation (we identified only one such event). The temporal variations of the spectral parameters, such as the number of data points, signal strength before the dark level extraction, derived radiance, and scaled reflectance of the identified absorption spectra observed at the narrow area (within the black line in (a)) are presented in (b)–(e). This event continued for 44 hr in 22 orbits (gray vertical hatches in (c)). Absorption was identified at the timing of the higher signal strength in (c), which is clear evidence that these areas of absorption did not originate from an increase in any noise and that they really originated from some materials that caused an increase in the signal level. Apparently, the event ceased its activity (identification of absorption ends) after 44 hr; however, observation by SP continued after that. A temporal variation of the volatile identified spectra observed in one example orbit (vertical line in (c)) is presented in (d) and (e), and it varied in signal strength (y-axis). However, all of the volatile identified spectra constantly have absorption at 1500 nm (corresponding to water ice), indicating the continuous presence of the observed material in this area.
4. Discussion
4.1. Origin of the Signal
To investigate the origin and mechanism of the identified events (absorption of the volatile species), we evaluated the location and timing of the volatile material with possible light source considerations (direct solar illumination, reflected solar illumination, earthshine, and zodiacal light). Based on the ray-tracing analyses of the strongest absorption event (Event A) using the digital elevation model (DEM) and the position and viewing direction information of the SP instrument (Figure 3), the volatile identified location at the lunar surface was neither illuminated by direct solar light nor by reflected solar light, while the upper part of the SP's line of sight column of the instrument was illuminated by the Sun (Figure 3(a) at P2 location). We conducted the same analysis for all of the absorption identified data observed in the south pole and confirmed a similar (not illuminated by direct or reflected solar light) condition for most of them (96%). Moreover, we found that the events were identified during a period of no visibility of the Earth (no earthshine period) at the observed lunar surface location (Appendix C). In addition to the timing, earthshine (roughly 4 orders smaller than the Sun; Glenar et al. 2019) and zodiacal light (9 orders smaller than the Sun; Tsumura et al. 2013) are both too weak to explain the observed signal intensity. Thus, the absorption signal of the volatile material identified in the nighttime data in this study is most probably not from the lunar surface as most of the locations were not illuminated by any possible light source (direct or reflected sunlight/earthshine/zodiacal light). Therefore, the natural conclusion is that the volatile materials must have been ejected from the lunar surface and reached a higher altitude in space (toward the upper part of the SP's line of sight), where it was illuminated by the Sun (Figure 3(a)). Our simulations of the solar illumination for other volatile identification events indicate that a very small amount of reflected light may have contributed to the observed volatile signal in other cases (Appendix A, Figure 9(c)). However, if the identified volatile signals came from the lunar surface, which contains some amount of water or other volatile materials, the spectra should have a spectral shape typical of the normal lunar regolith (e.g., slightly reddened slope from the visible to near-infrared wavelength range), presented in Figure 3(c), with a small absorption of water ice at the relevant wavelength as previously reported in laboratory experiments for frost layers on mineral grains (Ogishima & Saiki 2021) and identified in this study at the illuminated area (Appendix B, Figure 11(c)). We compared our observations to the spectra of frost on mineral grains (Ogishima & Saiki 2021), which is consistent with the Hapke model (Hapke 1993), although the Hapke model is an intimate mixture model of ice and mineral particles. This assumption is valid as far as a pure ice sheet is not expected (or a significantly higher concentration of water than a few weight percent) in the non-PSR region. Therefore, the fact that the volatile identified spectra in this study (Figure 3(d); Appendix A Figure 9(c)) have quite a different spectral shape compared with that of the normal lunar regolith suggests the non-surface origin of this signal. To estimate the maximum height of the lofted material, we conducted ray-tracing analyses to derive a minimum height for the solar illumination in the SP's line of sight of each volatile observation during Event A. The results suggest that the height is a minimum of 3 km and reaches up to ∼18 km from the lunar surface. Therefore, the identified volatile material must be ejected to ∼18 km at some location.
If this conclusion is correct, volatile materials must be lofted from the Moon to space by some mechanism. Possible origins of lofted volatile materials to space (up to tens of kilometers from the surface) are impact ejecta (comets or meteoroids) and volatile material sublimation. Since the majority of the events (i) do not coincide with major meteoroids (Figure 5), (ii) do not match the maximum meteoroid activity in June (Figure 5), (iii) have longer event durations (e.g., 44 hr; Figure 5), and (iv) have significantly wider spatial expanses (Figure 4) than the reported impact flashes (e.g., Berezhnoy et al. 2019), we could conclude that the identified events do not have a one-shot impact origin. The probability of a very large impact enough to generate duration and brightness comparable with that of the observed events is extremely low and no observations of impact flashes at the observation time of the large event (Event A) were reported. The formation of an impact-induced thin dust cloud generated by successive meteoroid impacts during one meteoroid stream was previously reported during the Quadranti meteoroid stream (Wooden et al. 2016), and it lasted for several hours. However, the events identified in this study continued much longer (up to tens of hours), and their signal intensity is much stronger (roughly 4 orders of magnitude) than the impact-induced dust cloud. Therefore, successive meteoroid impacts are not likely the major origin of the identified events in this study although this scenario cannot be ruled out for smaller events. Moreover, the permanent thin cloud generated by multiple meteoroid streams in the equatorial region was reported to occur for several months (Horányi et al. 2015). In addition, the cloud was diffused (weak in signal and widespread), and its month-scale time span does not match the observed events in this study. During the identified events, the signal intensity and its spectral shape significantly varied (Figure 7(f)).
As the possible origins of the events (lofted volatile materials to space) are impact ejecta and volatile material sublimation, the abovementioned evaluation results of the non-impact-related origin make the origin of the events most likely the sublimation of volatile materials that were lofted to space, reaching the height illuminated by the Sun (upper part of the SP's line of sight, indicated by the light gray cone directed to the lunar surface in Figure 3(a)). The identified absorption numbers and their signal strengths increased as the satellite altitude decreased during the extended mission (last 6 months; Figures 5 and 3(b)). This evidence is consistent with the lofted volatile origin of the absorption signals as the density and brightness of the lofted materials are expected to be larger at lower altitudes. Therefore, the contribution of the brighter part of the lofted material within the SP's line of sight can be higher (the signal can be higher) with a lower spacecraft altitude. The atypical spectral shape of the identified volatile spectra (Figure 3(c)), which clearly differs from that of normal lunar regolith or solar spectra, is also consistent with the lofted volatile origin. The heterogeneity of the event location and timing is also consistent with the sublimation origin, as the sublimated component can be heterogeneously distributed depending on the local temperature, whereas, for example, the dust of impact ejecta can expand rapidly and result in a very diffused and widespread distribution. The wavelength of the identified absorption center indicates that the lofted material consists of water ice and water gas (and possibly other volatile materials such as methane and ammonia), which were lofted to space as localized and temporal events lasting up to a few Earth days. The sublimation origin of water is also consistent with the non-PSR distribution of the event because sublimation cannot occur extensively at PSR, where the temperature is constantly low. The repeated identification of lofted volatile events at the same location (Figures 4(c) and (d)) supports the sublimation origin, as the repeated occurrence of impacts at the same location is not likely. Moreover, the fact that the majority of the event located on or near the area of the NS hydrogen observation (Sanin et al. 2017) and higher sublimation area (Schorghofer & Williams 2020) support the scenario that surface water ice is not the origin of the observed events, but subsurface ice sublimated and lofted to space is. All the evidence summarized in Appendix C indicates that the observed events in this study most likely represent the first direct evidence of lofted volatile materials by sublimation, which occur as localized, temporal, and condensed plumes in the polar regions of the Moon. However, our evaluation does not rule out mechanisms other than sublimation, and there may be some contribution from meteoroid impacts, migration from the dayside, or another mechanism not yet known.
Based on the brightness (too bright to be explained only by the refection of lofted water ice grains), the steeper slope at wavelengths less than 1000 nm, and spectral shape (kinking around 1000 nm) of the identified spectra, we hypothesize that the smaller grain fraction of the lunar surface regolith may be lofted into space together with the volatile materials. Lofted regolith grains along with water ice grains efficiently reflect solar light, which may explain the brightness of our observations. The lunar regolith, with its smaller grain fraction, is known to have a steeper slope than the bulk regolith, as reported by Taylor et al. (2010), who analyzed spectra of a sieved regolith of different grain sizes. The regolith with the smaller grain tends to have a higher content of metallic iron, generated by space weathering, which causes the steeper slope. In addition, previous spectral modeling (Ciarniello et al. 2019) suggests that the spectra of water ice mixed with a small amount of iron grains exhibit a kink near 1000 nm, similar to the observed spectra. Thus, the lofted regolith grain scenario is consistent with the observed steeper slope (Figures 3(d) and 10). In addition to evaluating the origin of the identified volatile absorption, we examined if there is any correlation between the presence or strength of the volatile absorption and the brightness of the observed spectra. The results indicate that spectra with volatile absorption have a higher radiance population than spectra without volatile absorption (Figures 14(a) and (b)). This implies that the volatile gas was likely ejected with solid particles, such as ice particles or dust particles (regolith grains), which reflect the solar light. Furthermore, the fact that no clear correlation was observed between the radiance and absorption strength in the volatile identified spectra (Figure 14(c)) suggests that ice particles are not the sole cause of the higher radiance of the volatile identified spectra and dust particles may contribute to the brightness.
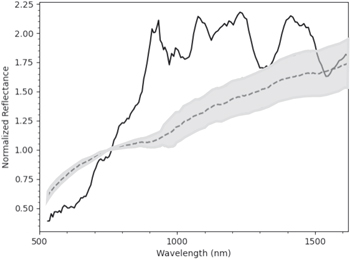
Figure 10. Comparison of a volatile identified spectrum (solid line) at the area presented in Figure 7 during Event A and lunar regolith spectra obtained during Event A under illuminated conditions (dashed line with gray hatch). The lunar regolith spectrum represents the average over approximately 300 data points (dashed line), with the standard deviation (gray hatch) also presented.
Download figure:
Standard image High-resolution imageAlthough we consider that the ejection of regolith grains together with volatile materials from the surface is a reasonable hypothesis, we also understand that the source function (source of energy or source of illumination) that is being absorbed by volatile materials is not clear at this moment and requires future modeling. A recent paper by Farrell et al. (2019) discussed the possibility of micrometeoroid impacts ice-rich outcrops on the lunar surface of permanently shadowing polar craters, which may liberate cold-trapped ice. Such impacts would cause a high emission of volatile gas, ice, and regolith ejecta. Therefore, this process may contribute to the lofting of the regolith during the events, which may explain the strong observed signal. In addition, the lofting of regolith may be somehow related to the previously reported levitation in the low latitude regions (McCoy 1976; Glenar et al. 2011). However, it is not clear at this moment if levitation can occur at the polar region and cause the observed spectra. We need further study to address these issues.
4.2. Reason for the Nighttime Occurrence of Plumes
One more aspect we needed to investigate is why plumes (sublimation events) mainly occurred during nighttime (Figure 6) and not during the high-temperature daytime at the surface. Thus, we conducted a temperature simulation of the lunar surface/subsurface (Figure 8, top panel) using representative parameters of the lunar surface regolith (density, porosity, and thermal conductivity as discussed by Hayne et al. (2017). Notably, there is a time gap between the temperature maximum at the lunar surface and subsurface (delay of temperature increase in the subsurface). This time gap is generated because the thermal conductivity of the lunar regolith is low, and it takes time for the subsurface regolith to reach its maximum temperature. Moreover, the time gap increases as the depth increases while the variation from the minimum temperature to the maximum temperature at one location (depth) decreases with the increase in depth. As discussed in the results section, the majority of plumes occurred at nighttime (Appendix B), and the maximum number of the identifications of absorption occurred at near midnight (Figure 6.)
Considering two parameters, (i) the time gap of the temperature increase/decrease between the surface and 10 cm depth and (ii) the time necessary for water molecules on ice to sublimate, diffuse, and eject into space sublimation from a depth of 10 cm, where the regolith is enriched in water, may explain the observation of volatile ejection during nighttime, as demonstrated in Figure 8.
Phase 1. According to the top panel in Figure 8, no effective sublimation occurred, as the subsurface temperature is too low. We define effective sublimation temperature (EST) as the ideal temperature at a certain depth, whereby the molecular residence time is ∼ 8 Earth days. Here, the residence time is the period in which water molecules (monolayer) can remain on ice grains. To derive ESTs, first, the corresponding sublimation rate (E) at the surface can be calculated using the correlation of E = θ x μ/residence time (θ is the number of water molecules per monolayer, and μ is the mass per molecule; Schorghofer & Williams 2020). Then, T can be calculated for the surface using Equation (8) (correlation between temperature and sublimation rate) of Schorghofer & Williams (2020). For the subsurface, the EST at 10 cm depth can be calculated using the same correlation of sublimation rate (Ess) and residence time (Ess = θ x μ/residence time) and Equation (10) (proportional correlation between surface and subsurface sublimation rate) of Schorghofer & Williams (2020). The ESTs of the surface and 10 cm depth were derived as 120 and 140 K, respectively. Thus, after ∼14 Earth days at sunrise at the surface (the temperature roughly corresponds to that at sunset at the surface as observed in the top panel of Figure 8), the subsurface temperature reaches the EST (start of phase 2).
Phase 2. Water molecules from 10 cm depth sublimates and diffuses, and it takes ∼8 Earth days (residence time) to reach the surface and be ejected into space. The ejection event is observed long after sunset at the surface during a period presented as the vertical orange hatch. In short, subsurface water ice from a depth of 10 cm can sublimate, reach the surface, and be ejected into space (in a time span of several Earth days) until the surface temperature drops below 120 K.
Phase 3.: After some Earth days have passed, the ice molecules reach the surface and are ejected into space at a velocity of 300–350 m s−1 (estimated by the Maxwell–Boltzmann probability distribution at 110–120 K as described by Butler 1997). The ejected water molecules ascend to a maximum height of 30–40 km, assuming parabolic motion, and then descend to the surface and may continue hopping, eventually recondensing at a low-temperature site. The recondensation of water molecules likely occurs at a different location from the ejection point.
Phase 4. After the recondensation, some portion of water molecules diffuses downward and accumulates. Accumulation may continue over multiple lunar days, depending on the local/seasonal temperature conditions at each location. Note that the transition from one phase to another takes place continuously, likely with some overlap (in particular, phase 2 and phase 3 definitely overlap). Based on this temperature simulation and the observational evidence (the plumes occurred at nighttime and increased toward midnight), we suggest that the identified plumes can be volatile materials sublimated from 10 cm depth though further study of temperature modeling is required to conclude. Recent simulation results of the subsurface temperature at some selected locations in the lunar polar region at a latitude of approximately −59° suggest that the water molecule concentration can be maximum from a depth of a few centimeters up to 30 cm (Reiss et al. 2021), consistent with the results of our simulation.
The higher activity of the plumes in the winter season and the repeated occurrence of plumes in some locations are also consistent with the sublimation from subsurface origin. This is because during daytime in summer, the lunar surface and subsurface temperature are both well above the sublimation temperature but during nighttime, the lunar surface temperature is below the sublimation temperature, while the subsurface temperature remains above the sublimation temperature because of the delay in the temperature decrease (next sunrise comes before the subsurface is cooled down). In this case, the surface regolith may catch water molecules if there is any supply at nighttime; however, the water molecules are then released at daytime. This type of water release may correspond to the previously reported water molecule detected on the sunlit Moon (Honniball et al. 2021) by The Stratospheric Observatory for Infrared Astronomy (Becklin & Moon 2002). So there may be a fast cycle of catch and release at the surface. But in summer, the subsurface regolith cannot catch or store water molecules even at nighttime because of the higher temperature. In winter, since the maximum temperature of the surface is lower than that in summer at some locations (as demonstrated in Figure 1(a) by Williams et al. (2019) based on the analysis of Diviner Lunar Radiometer Experiment data and the subsurface temperature increase is delayed (surface versus 10 cm depth in Figure 8), the subsurface regolith temperature is kept low and never reaches the sublimation temperature at some locations (opposite condition to the summer). This is because before the subsurface temperature catches up to the surface temperature, the subsurface temperature starts to decrease again owing to the setting of the Sun at the surface. In this case, the subsurface regolith may be able to accumulate and store water molecules (supplied from the surface layer of the regolith, a process similar to the pumping effect described by Schorghofer & Aharonson 2014) during winter nighttime (the water storing phase). In spring (this can be in the middle of winter at some locations because of the local topographic conditions), when the temperature increases and reaches the sublimation temperature (or just beyond that), the subsurface regolith starts to release the accumulated water. If the suggested water release mechanism does occur, the parameters of the event (e.g., location, duration, amount of water release, and time gap) will be affected by both diurnal and seasonal temperature conditions at each location.
Based on the previous consideration, the surface regolith in the illuminated polar regions is relatively dry for the whole year because of the high temperatures during the daytime, while there can be a wet (containing water or other volatile materials) regolith layer below the dry surface in winter. Such a two-layer model of lunar regolith has been supported by hydrogen observations through neutron spectroscopy. The Lunar Prospector observation indicated that the measured hydrogen at the near-polar region is likely buried by 10 ± 5 cm of dry regolith (Lawrence et al. 2006). This two-layer model was also suggested by previous observations of the water liberated by meteoroid impacts (Benna et al. 2019). Although we believe that most of the identified plumes in this study were not caused by meteoroid impacts, the desiccation from the subsurface layer concept is similar to our conclusion. As described in the results section, the identified plume location in this study matches quite well the previous hydrogen distribution observed by neutron spectroscopy (Sanin et al. 2017). All this evidence supports our hypothesis that there is a relatively wet layer at 10–20 cm below the surface, and from there, sublimation will occur, although the identification of plumes has not been previously reported. The lack of identified absorption in our study in Cabeus despite a higher abundance of detected hydrogen in Cabeus in the neutron spectroscopy data (Sanin et al. 2017) is possible because of the slightly thicker dry regolith layer (likely 80 cm) in this region. Thus, the underlying wet layer never reaches the sublimation temperature of water; however, this wet layer can be detected by neutron spectroscopy observation. Some of the plumes were identified in the summer season (mostly in the north pole) and we do not know the reason for this. Thus, there needs to be a future investigation of the temperature simulation of each observed location under real conditions (topography and timing).
We identified the lofted volatile materials in the nighttime data. In the identified volatile signals, there might be some contribution of a small amount of lunar surface dust, especially at the terminator region, as levitated dust was reported in previous studies (McCoy 1976; Glenar et al. 2011). This is because, unlike the equatorial region, a terminator region (boundary of an illuminated and unilluminated area) in the polar region can be frequently formed because of the surface topography and low solar illumination angle. Moreover, it was reported that the adhesive force between dust grains is reduced by hydroxylation (Kimura et al. 2014); thus, the lofting of lunar surface dust in the polar region might be easier. In addition, previously reported dust generated by meteoroid impacts (Horányi et al. 2015; Wooden et al. 2016) micrometeoroid impacts (Farrell et al. 2019), or levitated dust (McCoy 1976; Glenar et al. 2011) may contribute. However, the contribution of lunar dust to the identified volatile signals is still not very clear at this moment, and spectral modeling to reproduce the observed characteristics discussed in Section 3.3 can be another topic for a future study or investigation through surface explorations of the Moon.
In addition to water, possible signals of methane and ammonia were identified in the observed spectra. However, we cannot be sure about the presence of methane and ammonia because of our lack of knowledge to explain the mechanism to store and release them at a lower temperature than water.
4.3. Searching Plumes in Other Remote Sensing Data
We tried to find evidence of volatile sublimation in other remote sensing data. Colaprete et al. (2010) reported the presence of water ice at the crater of Cabeus through the ejecta observation of the artificial impact by the LCROSS mission. The original depth of the ejected material for this artificial impact was estimated to be several meters from the surface (Colaprete et al. 2010).
Though our estimation suggests that the volatile materials were sublimated from a depth of 10–20 cm, based on our data, we cannot discuss the presence of water deeper than the thermal skin depth (up to ∼50 cm). Therefore, we cannot compare our results to the LCORSS artificial impact result reported in Colaprete et al. (2010). We also tried to find evidence of volatile sublimation in other optical instrument data but could not. For the Chandrayaan-1 M3 data, as far as we found, there is no available data on the polar region during nighttime. 9 In addition to SP, SELENE/Kaguya carried two optical instruments to observe the lunar surface; Terrain Camera (TC; Haruyama et al. 2009) and Multiband Imager (MI; Ohtake et al. 2009). TC and MI do not have the capability to spectrally identify the volatile absorption we report in this study by using SP data because they are a panchromatic camera (TC) and a multiband camera (MI). However, we tried to find lateral signal elevations to identify something like haze in the TC and MI images, which was observed at the exact location/timing of the biggest plume identified by SP. We could not identify any clear evidence of haze because the volatile signal is too weak, as the estimated signal strength is comparable with the noise level of TC and is much weaker than the detection limit of MI. Li et al. (2018) reported water ice in the polar region in a data set of Chandrayaan-1 M3 based on daytime observations. The reported water ice present at the lunar surface was mainly in PSR, where ice would be stable for a long period. In contrast to their identification of the water ice at the lunar surface to be likely stable water, in this study, we identified very active volatile plumes (sublimated and lofted in space) in the polar region. The identification of water ice at PSR by Li et al. (2018) as a likely stable component appears to be consistent with our results, as their report suggests that water was delivered to the lunar surface and that it can stay there for enough time and at enough amount to be detected by remote sensing observation. However, the time span of the water delivery mechanism to the lunar surface might be significantly different in a stable water case in PSR and the active plume case, as discussed in this paper.
The Ultraviolet/Visible Spectrometer on board the Lunar Atmosphere and Dust Environment Explorer (LADEE; Elphic et al. 2014) identified a dynamic nanodust cloud that coincided with one of the meteoroid streams enveloping the Moon for several Earth days (Wooden et al. 2016). Their conclusion is that impacts generated a nanodust cloud enveloping the Moon globally and homogeneously. The orbit of LADEE is nearly equatorial and the instrument does not directly observe the polar region. Therefore, we could not evaluate if the dynamic nanodust cloud they detected is somehow related to the localized plume we found in the polar region.
The Lunar Dust Experiment (Horányi et al. 2014) on board LADEE identified a permanent and asymmetric dust cloud that continues around the Moon in the equatorial region. This cloud was caused by impacts of high-speed cometary dust particles on eccentric orbits (Horányi et al. 2015). They reported an increase in the nanodust density near the sunrise terminator, which was maximized just after sunrise (local time of 6–8 hr). Thus, their observation does not match the identified plume condition in our study, as the activity of the plume identified in our study increased toward midnight (Figure 6). However, again, since LADEE's orbit does not allow us to evaluate plumes in the polar region, we cannot confirm if the plumes we are reporting in this paper somehow contribute to the asymmetric dust cloud they observed.
4.4. Frequency, Water Abundance, and Height of the Plumes
The identified 72 plumes in total for both poles during the 18 month observation period of SP roughly correspond to four events per month on average (Figures 4(c) and (d) and Appendix D). Considering the small footprint (500 m × 500 m at 100 km altitude), SP only covered a small portion of the polar region in one orbit. Moreover, we counted the number of plumes based on the data screening by the absorption center wavelength, which is within the predefined ranges. Therefore, the absorption of other species that were not analyzed in this study might be present. Thus, it is likely that more plumes occurred in the polar region than we report in this paper. However, while we checked that most of the volatile signals did not come from the lunar surface but from above the surface in the analyzed cases, as demonstrated in Appendix B, Figure 11 (only 0.22% of the identified absorption was from partially illuminated surfaces), it is true that some of the identified volatile materials were present at the lunar surface. Similarly, we checked the spectral shape (slope) of the volatile identified spectra (Appendix D, Figure 15) and found that a major part of the spectra (more than ∼90%) has a steeper slope than the normal lunar regolith, which is evident in the P2 spectra in Figure 3(c) at a shorter wavelength than 1000 nm. This implies that a small (if any) contribution of the surface volatile spectra to the number of plume counts. Considering the opposite effect in which the only limited observation coverage (spatially/temporally) and identified number and frequency of plumes might contain some errors caused by the counting of the volatile materials present at the surface. At least, it can be said that there are plumes of volatile materials in the lunar polar region.

Figure 11. Data analyses of all the available data in the south pole (observed in 1 Earth day). The SP data obtained at a latitude higher than 80° on 2009 April 19, were analyzed without screening based on the i > 90° condition (both illuminated and unilluminated data were analyzed). The green lines are the footprints of the SP observation data and the white dots are the locations of the identified absorption plotted onto the hill shade base map using the DTM generated by the LOLA on board the LRO spacecraft. The solar illumination condition of the area at the observation timing was simulated and presented as white (illuminated) and dark gray (not directly illuminated) areas. The inserted panels are examples of the absorption spectra of the (a) unilluminated PSR, (b) unilluminated non-PSR, and (c) partially illuminated non-PSR, and the incidence angle of each data set is presented in the panel. The arrows indicate the center wavelength of the identified absorption. Only a small number of areas of absorption were identified (in the white box) in the partially illuminated condition.
Download figure:
Standard image High-resolution imageEstimating the abundance of water is not easy because water ice's grain size strongly affects its absorption strength (grain size variation of water ice from 0.01–1.1 μm corresponds to any water/regolith mixing ratio as reported by Yang et al. 2009). The grain size of water can be much larger than 1 μm (the value studied by Yang et al. 2009), although we do not have any estimated value. Therefore, to derive an accurate weight percent of water in the observed spectra or to estimate the total amount of water lofted in space, a detailed study with a variety of parameters (e.g., number and species of lofted volatiles, solid/gas ratio, amount/size of regolith dust) is required, which will be a topic for future studies. However, if we can assume that the absorption strength and water content of laboratory experimental spectra of a plagioclase and water ice (∼10 μm size) mixture reported by Ogishima & Saiki (2021; the reported experimental correlation well matches the Hapke mixing model; Hapke 1993) apply to our observation, our data corresponds to ∼2.5 wt.% of water ice for the spectra having maximum absorption strength.
The initial velocity of the lofted volatile molecules at 110–120 K is estimated to be 300–350 m s−1, and the molecules can reach up to 30–40 km from the surface, as discussed in Section 4.2, with most of the molecules remaining within the lunar gravitational field. Therefore, the lofting of volatiles can be explained by the high percentage of recycled water molecules. Thus, a high delivery rate of water is not needed to produce the plumes. Rather, our observations suggest rigorous lofting and accumulation (recycling) of the water molecules at the polar region, which is identified as plume events. The estimated height (30–40 km) of the lofted volatile molecules, determined from their temperature, is consistent with the calculated minimum height of the lofted material, based on the observed conditions (minimum height of solar illumination in the SP's line of sight during Event A is ∼18 km).
The number of the plumes, lateral/vertical size, duration up to a few Earth days, and estimated lofting height as identified in this study, all suggest the vigorous lofting (and likely recondensation) of volatile material in the polar region. And these plumes can transport/accumulate water vigorously.
5. Conclusion
In this study, we found plumes of volatile materials that were frequently ejected/emitted from the lunar surface. The volatile materials were found to reach ∼18 km scale heights, implying a highly active migration of water and volatile materials in the lunar polar region. Though our data analyses suggest that the volatile materials were likely sublimated from a depth of 10–20 cm, some contribution from other mechanisms, such as meteoroid impacts or migration from the dayside, cannot be ruled out. In contrast to the general view that the lunar polar region is a very quiet environment, the evidence discussed in this study suggests an extremely active area with the frequent lofting of water ice and possibly regolith dust. In particular, the signal strength of the volatile materials of the plumes was significantly changed within the timescale of a few days, indicating a highly active environment. This discovery of the extremely active lunar polar region is key for understanding the origin, amount, distribution, and migration mechanism of water in the polar region, as the identified plumes can transport/accumulate water vigorously.
Direct measurements of the identified plumes by exploring the lunar polar region can provide valuable information for further understanding this mechanism. Such information is also very important for understanding the delivery of volatile materials to the Earth–Moon system and can be applied to Mercury, Mars, or other planetary bodies. Moreover, information on the location and depth of water presence can help us evaluate resource usage on the Moon in the future.
Acknowledgments
We thank Japan Aerospace (JAXA) Lunar and Planetary Exploration Data Analysis Group (JLPEDA) for providing information on how to conduct ray-tracing analyses using available topographic data. We thank Dr. Yamamoto of the National Institute of Advanced Industrial Science and Technology for providing his knowledge regarding the calibration procedure of SP. We also thank Dr. Kimura of the Chiba Institute of Technology for providing his knowledge regarding the theoretical study of the dust lofting capability and help evaluating the identified plumes.
Data Availability
All the data used in this study are publicly available. The SP data can be accessed through the JAXA data archive system https://www.darts.isas.jaxa.jp/planet/pdap/selene/.
Appendix A: Example of the Illumination Condition and Reflectance Spectra
The simulation results of the illumination condition of the volatile material were identified in two different timings and are presented in Figure 9 with the corresponding reflectance spectra. In (a), the green dot located at the totally black area indicates no direct illumination by the Sun at this spot. While only a small portion of the white and red area in (b) overlapped at the central upper area (white arrow), only a small amount of the reflected light from the overlapped area likely reached the green dot. Moreover, the derived reflectance spectra clearly have different shapes from the normal lunar regolith. As the inserted figure indicates in (d), no direct illumination by the Sun reached the green dot spot in (d). Note that in (e), the amount of reflected light that reached the green spot (overlap of red and white at the rim of the crater) is relatively larger than in (b), which according to our conclusion resulted in a normal spectral shape of the lunar regolith. Regardless of illumination by the Sun or by a weak reflected light, in case the lunar surface contains an amount of observed water ice, the spectra should have normal lunar regolith spectral shape with a small (if any depending on the water ice amount) absorption of water ice at the relevant wavelength as previously reported (Ogishima & Saiki 2021; they reported experimental results up to 2 wt.% of water ice). However, the absorption identified spectrum as presented in Figure 9(c) and Figure 10 (solid line) has quite a different spectral shape compared to the normal lunar regolith (convex shape and shallower slope at a shorter wavelength than 1000 nm; Figures 9(f) and 10 (dashed line with gray hatch)), suggesting the non-surface origin of the volatile identified signal. Thus, our conclusion is that most of the signals in the spectra of (c) originated from the lofted volatile materials.
Appendix B: Volatile Absorption in Nighttime/Daytime Data
In this study, we focused on nighttime (i > 90°) data to identify volatile absorption, as volatile signals are weaker than regolith signals. However, if the abundance of volatile materials is really high, we may be able to identify their absorption in daytime data. Moreover, the presence of volatile materials (if any) in daytime regions may provide additional information about the origin of identified volatile materials. Therefore, to check if volatile absorption can be identified in daytime data, we conducted a test analysis by using the same orbit (observation timing) data, in which one of the very clear volatile areas of absorption was identified during nighttime. We tested 12 orbits observed in 1 Earth day. Among the ∼5000 SP data in the analyzed 1 day data without screening by the incidence angle, 2288 absorption were identified and all of them (white dots in Figure 11) were in data observed under the i > 90° condition. Thus, focusing on i > 90° data is suitable for investigating volatile absorption and their origin although a small number of volatile absorption may be present in i < 90° data. Most of the absorption was identified in data observed in unilluminated areas far from the illuminated areas (white dots in the area presented in dark gray near the top-right corner). The absorption was identified under unilluminated conditions both in the PSR and non-PSR (examples of such data are presented in (a) and (b)). However, among the 2288 identified absorption, only five (corresponding to four data points and 0.22% of the identified absorption) were from partially illuminated conditions (white dots in the white box in Figure 11). These four data sets were observed under the i > 90° condition; however, their locations were partially illuminated because of their higher elevation (they are at the non-PSR). Although the screening based on the incidence angle cannot exclude this partially illuminated data, the number of absorption in such data is small (Figure 11). Note that unilluminated data ((a) and (b)) with volatile absorption have steeper spectral slopes at short wavelength ranges (<1000 nm), while partially illuminated data in (c) has a characteristic convex and shallower spectral slope of the normal lunar regolith at this wavelength ranges (<1000 nm). We confirmed that the main identified absorption area (top-right corner) was not illuminated by direct or reflected light using ray-tracing analyses, as described in the data validation section. Considering the rareness of the identification of absorption in partially illuminated data and the fact that no absorption was identified at the fully illuminated location, we are confident that to investigate volatile absorption, which had a much weaker signal than the lunar surface regolith, focusing on the SP data observed during nighttime is effective.
Appendix C: Summary of Validation and Origin Estimation of the Absorption Identified Spectra
Since the SP data analyzed in this study is from nighttime observations, where basically no sunlight reaches the lunar surface, no signals can be expected under normal circumstances. However, we did find signals strong enough for spectral analyses. Before going into a detailed discussion, we performed validation of the data after data screening to confirm whether they were real signals or artificial ones. The evaluation results of the conducted analysis in this study to identify the origin of volatile spectra are summarized in Tables 1 and 2. To check if the identified areas of absorption in this study are really from volatile materials and not artificial origin, we evaluated the possibility of calibration and correction error origin (in a process such as dark signal extraction, photometric correction, and conversion to radiance/reflectance) and stray light origin. Since the calibration/correction procedure applied to the SP data does not have a parameter, which may cause the artificial absorption of varying wavelength/strength/shape with time as observed in the absorption identified SP data (Figure 7), the calibration/correction error cannot explain the observed absorption.
Table 1. Summary of Evaluation Conducted in This Study to Identify the Origin of the Identified Volatile Absorption
| Tested Parameters and Methods | Description | Result | |||
|---|---|---|---|---|---|
| Origin of the volatile spectra | |||||
| Artificial | Calibration error | Calibration/correction procedures were evaluated to test if they could cause the observed spectral shape and their change with time | We confirmed that the calibration/correction errors (if they remained) will derive constant spectral shape and cannot explain the observed spectra having absorption varying with time (Figure 7). | Unlikely | |
| Stray light | Correlation of the observation condition to the observation geometry (i, e) | No correlation identified in the incident and emission angle (Figure 12). Also, the observation geometry does not correspond to the previously reported stray light candidates. | Unlikely | ||
| Spectral shape | Clear absorption corresponding to water ice/gas (and possibly methane and ammonia). And the wavelength of these areas of absorption varies with time/location. This evidence cannot be explained by stray light, which will be similar to the solar illumination (Figure 7). | Unlikely | |||
| Real | Volatile material on the lunar surface | Lunar surface volatile directly illuminated by the Sun | Ray-tracing analyses using DEM/ephemerith and spectral shape | No direct or reflected solar illumination reached the location, where the strong absorption was observed. Their spectral shape is clearly different from the normal lunar surface regolith, therefore the observed spectral shape cannot be explained (Figure 3). | Unlikely |
| Lunar surface volatile illuminated by reflected light from the surroundings | Ray-tracing analyses using DEM/ephemerith and spectral shape | Same as above | Unlikely | ||
| Lunar surface volatile illuminated by earthshine | Ray-tracing analyses of earthshine presence on the lunar surface using DEM/ephemerith | No correlation to the presence of earthshine (Figure 13). | Unlikely | ||
| Lunar surface volatile illuminated by Zodiacal light | Brightness of the signal | Zodiacal light is too weak (6 orders magnitude lower than our observation; Tsumura et al. 2013) to explain the observed signal. | Unlikely | ||
| Lofted volatile material | Impact-ejected volatile material | Size, duration, and repetition of the signal | Size and duration of an impact flash are significantly smaller than the observed signal (e.g., one impact flash lasts seconds compared to the tens of hours in this study). Repeated observation with a time gap of months at some locations cannot be explained by impact ejecta. | Unlikely | |
| Correlation to the major meteoroid maxima (optical) | The majority of the volatile observation timing does not coincide with major meteoroids and the observed latitude does not correlate to the source of the ecliptic latitude of the major meteoroids (Figure 5). | Unlikely | |||
| Correlation to the major meteoroid maxima (radar) | Does not correlate to the activity maximum in June (Figure 5). | Unlikely | |||
| Duration and observed area | Duration: the identified continuous spectral signal lasted much longer than the reported impact flash. Area: observed spectra were identified at an exceedingly wider area than the reported impact flash (Figure 4). | Unlikely | |||
| Sublimated and lofted volatile material from the surface/subsurface | Correlation of the observed signal strength to the satellite altitude | Lowest altitude corresponds to the strongest signal (Figure 5). | Likely | ||
| Location of the signal | Distribution of the observed signal correlates with the NS hydrogen location reported by Sanin et al. (2017) and the high sublimation area reported by Schorghofer & Aharonson (2014) (Figure 4). | Likely | |||
| Seasonal/diurnal variation and repetition of the signal | The majority of the signals were identified during winter when the temperature can be cool enough to store water as ice. The number of the observed signal reaches its maximum at midnight. Temperature simulation of surface/subsurface suggests that sublimation from the subsurface can explain the diurnal maxima. Repetition of the identified signal matches to the sublimation origin. (Figures 5, 6, and 8). | Likely | |||
Table 2. Evaluation of Different Origin Scenarios for the Lofted Material
| Tested Parameters | Possible Origin | Description | |||
|---|---|---|---|---|---|
| Impact | Impact onto ice | Migration | Sublimation (subsurface) | ||
| Size, duration | Unlikely | Unlikely | Unlikely | Likely | Duration of one impact flash (up to several seconds) is shorter than the observed events. Multiple impacts by meteoroid shower distribute more sparsely than the observed events. Simulated impacts by Szalay et al. (2019) suggest that the bulk of impact ejecta material accumulates in 100–200 km from the ejection center in less than several minutes. Therefore, the origin of the impact can explain the observed biggest events in size, but it cannot explain much longer duration (more than 1 Earth day) of the biggest events. Diurnally migrated volatile material from the dayside to the nightside is estimated to jump hundreds of kilometers toward the dusk/dawn in less than an hour (Livengood et al. 2015). So, their size is larger, and their duration is shorter than our observation. Sublimated material is likely to be observed as localized events and can continue up to several Earth days as presented in Figure 8. Therefore, the size and duration agree with our observation. |
| Brightness | Unlikely | Unlikely | Unlikely | Unlikely | The brightness of the identified events was too strong for any process. Therefore, we cannot explain the strong signal observed in this study. |
| Lofting of multiple species/dust | Likely | Likely | Unlikely | Unlikely? | The lofting origin of multiple volatile species and dust particles by impact/impact onto icy outcrop agree with the observation. Migration of volatile materials from the dayside requires very low temperatures and this process cannot explain the lofting of dust particles. The origin of the sublimation also requires very low-temperature conditions to condensate multiple volatile species. Mechanism of lofting of dust particles that occurred with sublimation is not clear. |
| Timing (meteoroid shower) | Unlikely | Unlikely | Likely | Likely | The majority of the events do not coincide with major meteoroids and the observed latitude does not correlate to the source of the ecliptic latitude of the major meteoroids. Thus, the origin of the impact cannot explain all of the observed events though we cannot rule out some contribution. Timing is okay for both the origin of migration/sublimation. |
| Satellite altitude | Likely | Likely | Likely | Likely | The lowest altitude observation corresponds to the strongest signal and can be explained by all scenarios as all processes will create denser clouds at lower altitudes. |
| Location (hydrogen, sublimation, non-PSRs) | Unlikely | Unlikely | Unlikely | Likely | Impact-induced volatile materials will be observed randomly at the polar region, which does not agree with the observed events. Volatile materials ejected by impact onto icy outcrop will be observed mainly within and around PSRs while this is not the case in most of the observed events. This scenario may explain some of the biggest events. Migrated volatile materials from the dayside will condense at low-temperature spots near the dusk/dawn region, while the identified events observed at variable local times do not agree with this scenario. Sublimation from subsurface origin agrees with the events observed at a high hydrogen/high sublimation rate. |
| Nighttime observation | Unlikely | Unlikely | Unlikely | Likely | Impact will hit both the dayside and the nightside. So, the frequent nighttime observation compared to the daytime (Figure 11) cannot be explained by impact. Migrated material from the dayside will condense at the dusk/dawn region. Therefore, the observed events at midnight do not agree with this scenario, while this process may contribute to the data observed at the dusk/dawn region. Sublimation from the subsurface scenario agrees with the nighttime observation (and frequent observation at midnight) as the sublimation from the subsurface takes several Earth days to be ejected. |
| Seasonal variation | Unlikely | Unlikely | Unlikely | Likely | Major meteoroid shower, sporadic impact, and impact onto icy outcrop do not agree with the seasonal variation. The diurnal migration scenario does not agree with the seasonal variation of the events as it occurs on every lunar day. Sublimation from the subsurface scenario agrees with the seasonal variation of the events as the subsurface temperature can be low to retain water ice during nighttime and release it during daytime in winter. |
| Repeated identification | Unlikely | Unlikely | Likely | Likely | Repeated observation at some events cannot be explained by impact/impact onto icy outcrop. Repeated observation can be explained by diurnal migration. But at the same time, it cannot explain the observed seasonal variation (non-every lunar day observation). Repeated but non-every lunar day observation agrees with the sublimation scenario. |
After the evaluation of the artificial origin, we checked if the identified absorption was caused by stray light. In the case of stray light, as solar light is the most likely candidate, such stray light (solar light) cannot have the volatile absorption observed in this study. Also, the absorption would be identified in the data every time SP took data under the same emission or incidence angle. However, this is not the case (Figure 12). This evidence suggests that stray light is not the origin of the identified absorption. All evidence confirms that the identified signals are real. Yamamoto et al. (2011) described the temporal increases of the nighttime signals and suggested that two of the six periods are possibly caused by stray light. These two periods correspond to the timing of the two biggest events in our analyses (Events A and B). Based on the obtained signal patterns, spatiotemporal variation/distribution, and the observation geometry, the reported signal increase by Yamamoto et al. (2011) was possibly caused by the lofted volatile materials rather than stray light. We also conducted ray-tracing analyses with regard to earthshine presence at the observed locations using DEM/ephemerith, and it was confirmed that there was no correlation between the timing of the volatile material identification and the presence of earthshine (Figure 13).
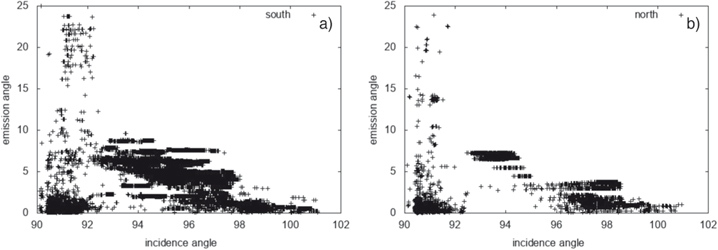
Figure 12. Scatter plot of the SP observation condition (emission angle and incidence angle) for the volatile identified absorption data. (a) is the south polar observation and (b) is the north polar observation.
Download figure:
Standard image High-resolution image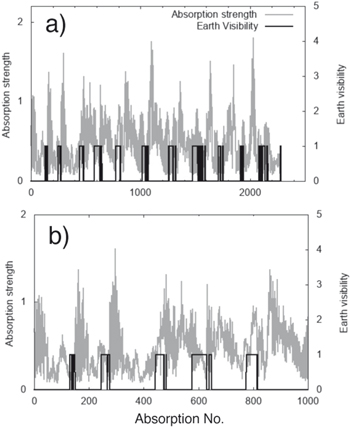
Figure 13. Comparison of the Earth's visibility from the lunar surface and the identified absorption strength at the south pole plotted as black and gray lines. (a) Data observed on 2009 April 19. (b) Close-up of the first 1000 data sets. We calculated the visibility 10 m above the lunar surface to derive conservative results (to derive maximum visibility) considering the errors in the DEM. The horizontal axis is a serial data number given in chronological order of the identified absorption. Earth visibility is presented as visible (1) or invisible (0). In these plots, no correlation was recognized between the Earth visibility (calculated correlation coefficient is less than 0.1) and identified absorption strength.
Download figure:
Standard image High-resolution imageWe also tested if there is any correlation between the presence or strength of the volatile absorption and the brightness of the observed spectra. The results indicate that the spectra with volatile absorption have a higher radiance population than the spectra without volatile absorption (Figures 14(a) and (b)), while no clear correlation is observed between the brightness and absorption strength in the volatile identified spectra (Figure 14(c)). These facts suggest that the volatile gas was lofted with the solid particles, which consist of ice and dust particles.
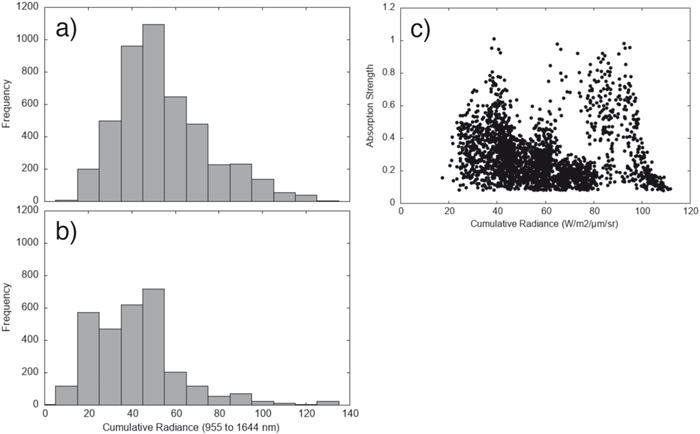
Figure 14. Brightness of the spectra with/without volatile absorption. Histogram of cumulative radiance over the wavelength range 955–1644 nm during the Event A observation, (a) with volatile absorption and (b) without volatile absorption. Note that the evaluation method to determine whether volatile absorption is/is not included in these figures is the same as that one presented in Figure 2 Step 3, in which the evaluation criterion was set to identify low noise and clear absorption. Therefore, spectra categorized as without volatile absorption do not necessarily indicate zero absorption and may include weak absorption but with a noisy signal. (c) Cumulative radiance and absorption strength of water ice during Event A. The Wavelength range is the same as that of (a) and (b). The absorption strength of water ice derived by the procedure of the identification of absorption described in Step 3 (Section 2.2) was used for the y-axis.
Download figure:
Standard image High-resolution imageWe also evaluated different origin scenarios (Tables 1 and 2) for the lofted material, and the results indicate that the most likely scenario for the observed events is sublimation from the subsurface. However, our evaluation does not rule out some contribution from other mechanisms, such as meteoroid impacts or migration from the dayside.
Appendix D: Number of Events
To estimate the number of events, we checked the location and observation timing of the identified volatile spectra. The event groups were classified based on the following criteria: (i) more than several SP data sets were obtained in a laterally clustered form, (ii) laterally separated from other gropes for more than 20 km (roughly comparable with the star symbol presented in the figure), and (iii) observed at multiple times. We identified 72 plumes in total for both poles during the 18 month observation period of SP (Figure 4(c) and (d)). To check the contribution of the volatile observation at the lunar surface, we evaluated the spectral shape (slope in the visible wavelength range; < 955.4 nm) of all the volatile identified spectra and found that a major part (>90%) of the spectra has a steeper slope (which is typical for spectra containing volatile materials) than the normal lunar regolith (Figure 15). This evidence suggests that the majority of the volatile identified spectra originated from the plumes (lofted volatile materials) and the contribution of the lunar surface volatile observation is small.

Figure 15. Slope (percent/nanometer) of the volatile identified spectra presented as a cumulative frequency. The south pole and north pole data were summarized. The slopes of the scaled reflectance at 750 nm were derived by least squares polynomial fitting in the visible sensor wavelength range. Wavelength data having reflectance zero were excluded from the calculation. The gray vertical hatch indicates the slope range of the normal lunar regolith (the same regolith data were used as in Figure 3).
Download figure:
Standard image High-resolution image
Footnotes
- 6
- 7
- 8
Meteoroid shower data from https://www.ta3.sk/IAUC22DB/MDC2007/Roje/roje_lista.php?corobic_roje=1&sort_roje=0
- 9