


Abstract
The primary purpose of this paper is to see how well a recently proposed new model fits (a) the position of the baryon acoustic oscillation (BAO) features observed in the large-scale distribution of galaxies and (b) the angular size measured for the sound horizon due to BAO imprinted in the cosmic microwave background (CMB) anisotropy. The new model is a hybrid model that combines the tired light (TL) theory with a variant of the ΛCDM model in which the cosmological constant is replaced with a covarying coupling constants' (CCC) parameter α. This model, dubbed the CCC+TL model, can fit the Type Ia supernovae Pantheon+ data as accurately as the ΛCDM model, and also fit the angular size of cosmic dawn galaxies observed by the James Webb Space Telescope, which is in tension with the ΛCDM model. The results we obtained are 151.0 (±5.1) Mpc for the absolute BAO scale at the current epoch, and the angular size of the sound horizon θsh = 0 60, matching Planck's observations at the surface of the last scattering when the baryon density is set to 100% of the matter density and ∣α∣ is increased by 5.6%. It remains to be seen if the new model is consistent with the CMB power spectrum, the Big Bang nucleosynthesis of light elements, and other critical observations.
Export citation and abstract BibTeX RIS

Original content from this work may be used under the terms of the Creative Commons Attribution 4.0 licence. Any further distribution of this work must maintain attribution to the author(s) and the title of the work, journal citation and DOI.
1. Introduction
One of the most important tests of a cosmological model is to reproduce in the galaxy distribution the signatures of the baryon acoustic oscillations (BAOs) resulting from the sound waves in the baryon–photon fluid at the time when photons and baryon decoupled, and radiation traveled freely in space. This radiation is observed as the cosmic microwave background (CMB). The BAO features are detected as tiny temperature fluctuations (anisotropies) in the highly isotropic CMB observations. These oscillations are believed to develop into large-scale structures as higher-density regions of perturbations become the nucleation points where galaxies form. Thus, the two features are expected to be correlated, and BAO could serve as a fundamental standard ruler to test cosmological models (Peebles & Yu 1970; Bond & Efstathiou 1984; Eisenstein & Hu 1998; Meiksin et al. 1999). The observation of BAO features at different redshifts endorses the propagation of primordial gravitational instability (Cole et al. 2005; Eisenstein et al. 2005; Fronenberg et al. 2023). Xu et al. (2023) have recently established evidence for BAOs from galaxy–ellipticity correlations. Tully et al. (2023) have presented remarkably strong evidence for the existence of an individual BAO signal at z = 0.068. Shao et al. (2023) raised the possibility of using the angular scale of cosmic inhomogeneities as a new, model-independent way to constrain cosmological parameters.
Sutherland (2012) succinctly stated, "...the observed BAO features support the standard cosmology in several independent ways: the existence of features supports the basic gravitational instability paradigm for structure formation; the relative weakness of the BAO feature supports the ∼1:5 ratio of baryons to dark matter, since baryon-dominated universe would have a BAO feature much stronger than observed; and the observed length-scale of the feature in redshift space is consistent with the concordance ΛCDM model derived from the CMB and other observations, with Ωm ≈ 0.27 and H0 ≈ 70 km s−1 Mpc−1 (Komatsu et al. 2011)."
Weinberg et al. (2013) have shown that BAO features in the matter power spectrum (galaxies), when combined with the tracer power spectrum (CMB), can effectively constrain the cosmological parameter and test a model. For our purpose, we are interested in the BAO measurements of angular separations θBAO of pairs of galaxies at different redshift values. Carvalho et al. (2016) used 409,337 luminous red galaxies in the redshift range z = [0.440, 0.555] to estimate θBAO(z) at six redshift shells. Their work was extended to include observations that provided θBAO at z = 0.11 within z = [0.105, 0.115] (Carvalho et al. 2021), and at up to z = 0.65 (Lemos et al. 2023). We will use their data to explore if the recently proposed hybrid model (Gupta 2023) is consistent with features of the BAOs observed in the CMB and matter power spectra. This model comprises a modified ΛCDM model permitting the covariation of coupling constants (CCC) and includes the tired light (TL) phenomenon to partially account for the observed redshift. This two-parameter hybrid model, dubbed CCC+TL, was able to account for the bewildering observation by the James Webb Space Telescope (JWST) showing unexpected morphology of galaxies existent at cosmic dawn. The model parameters H0 and α, the latter determining the strength of the coupling constants' variation and replaces Λ of the standard model, are determined by fitting the Type Ia supernovae (Pantheon+) data (Brout et al. 2022; Scolnic et al. 2022).
The galaxies observed in the early Universe, some less than 500 million years after the Big Bang, appear to have shapes, structures, and masses similar to those in existence for billions of years (e.g., Naidu et al. 2022a, 2022b; Curtis-Lake et al. 2023; Hainline et al. 2023; Labbé et al. 2023; Robertson et al. 2023) but with angular sizes 1 order of magnitude smaller than expected for such galaxies (e.g., Finkelstein et al. 2022; Naidu et al. 2022a, 2022b; Yang et al. 2022; Adams et al. 2023; Atek et al. 2023b; Austin et al. 2023; Baggen et al. 2023; Chen et al. 2023b; Donnan et al. 2023; Ono et al. 2023; Tacchella et al. 2023a, 2023b; Wu et al. 2023). Attempts have been made to resolve the problem by modifying the star and galaxy formation models (e.g., Haslbauer et al. 2022; Inayoshi et al. 2022; Atek et al. 2023a; Kannan et al. 2023; Keller et al. 2023; Mason et al. 2023; McCaffrey et al. 2023; Mirocha & Furlanetto 2023; Regan 2023; Whitler et al. 2023a, 2023b; Yajima et al. 2023), such as by compressing time for the formation of Population III stars and galaxies more and more by considering the presence of primordial massive black hole seeds, and super-Eddington accretion rates in the early Universe (Ellis 2022; Larson et al. 2022; Brummel-Smith et al. 2023; Chantavat et al. 2023; Dolgov 2023; Maiolino et al. 2023; Reinoso et al. 2023). Other researchers (Boyett et al. 2023; Bunker et al. 2023; Dekel et al. 2023; Eilers et al. 2023; Haro et al. 2023; Long et al. 2023; Looser et al. 2023) are concerned if they provide satisfactory answers. Some even suggest looking for new physics (Chen et al. 2023a; Mauerhofer & Dayal 2023; Schneider et al. 2023). In the words of Garaldi et al. (2023), "Cosmological simulations serve as invaluable tools for understanding the Universe. However, the technical complexity and substantial computational resources required to generate such simulations often limit their accessibility within the broader research community. Notable exceptions exist, but most are not suited for simultaneously studying the physics of galaxy formation and cosmic reionization during the first billion years of cosmic history." According to Xiao et al. (2023), "Massive optically dark galaxies unveiled by JWST challenge galaxy formation models." (See also Greene et al. 2023; Katz et al. 2023; Ormerod et al. 2024.)
The CCC+TL model predicts the age of the Universe as 26.7 Gyr against the generally accepted value of 13.8 Gyr. This is of deep concern and needs the model validation against multiple observations, including BAOs, CMB, Big Bang nucleosynthesis (BBN), and globular cluster ages. Our focus here is on BAOs. This paper is organized to include the theoretical background in Section 2, results in Section 3, discussion in Section 4, and conclusions in Section 5.
2. Theoretical Background
CCC Model. The modified FLRW metric, incorporating the covarying coupling constant (CCC) concept, is (Gupta 2023) 1

the Friedmann equations are


and the continuity equation is

Here  is the scale factor, G0 is the current value of the gravitational constant, c0 is the current value of the speed of light, k is the curvature constant, α is a constant defining the variation of the constant through a function
  with time measured from the beginning of the Universe and t0 the current time, ε is the energy density of all the components, and p is their pressure. Using the function f(t), c(t) = c0
f(t) and G = G0
f(t)3 in the CCC model. The solutions of this Equation (4) for matter (p = 0) and radiation (p = ε/3) are, respectively,
with time measured from the beginning of the Universe and t0 the current time, ε is the energy density of all the components, and p is their pressure. Using the function f(t), c(t) = c0
f(t) and G = G0
f(t)3 in the CCC model. The solutions of this Equation (4) for matter (p = 0) and radiation (p = ε/3) are, respectively,

Defining the Hubble expansion parameter as  , we may write Equation (2) for a flat Universe (k = 0) as

This equation defines the critical density of the Universe in the CCC model. Using Equations (5) and (6), we may write

In this equation, relative matter density Ωm,0 = εm,0/εc,0 and relative radiation density Ωr,0 = εr,0/εc,0. Since Ωr,0 ≪ Ωm,0, and we do not have to worry about the dark energy density in the CCC model, Equation (7) simplifies to

Since the observations are made using redshift z, we have to see how the scale factor  relates to z in the CCC model. Along the spatial geodesic (θ and ϕ constant) between the observer and the source at a fixed time t using the modified FLRW metric (Equation (1))

Thus, the proper distance for commoving coordinate r (since  )
)

Since light follows the null geodesic, Equation (1) yields for a light emitted by a source at a time te and detected by the observer at a time t0

It can now be easily shown (e.g., Ryden 2017) that a = 1/(1 + z), i.e., the same as for the ΛCDM model.
We now need to transpose f(t) to f(z), as it is the latter that we will require in calculating the proper distance. Following Gupta's (2023) Equations (24)–(27), we have
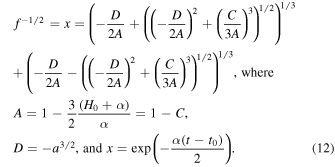
Since the scale factor  = 1/(1 + z), we have D = −[1/(1 + z)]3/2. Thus, the above equation provides the function f(z, H0, α) for the matter-dominated Universe. What about its expression in the radiation-dominated Universe? Since z ≫ 1 in such a Universe, i.e., t ≪ t0, it is easy to see that
  approaches a constant value. We can, therefore, use the same expression for f(z), i.e., Equation (12) for all values of z.
We now need the expression for the proper distance dp
. Since  , we may write Equation (10)

and since a = 1/(1 + z), da = − dz/(1 + z)2 = −dza2, we get, using Equation (8),

We can now follow TL and CCC+TL models developed by Gupta (2023) for our computations in this work.
Sound Horizon Distance and Angular Size. Denoted as dsh(tls), it represents the distance sound travels at the speed cs (t) in the photon–baryon fluid from the Big Bang until such plasma cools down and disappears due to the formation of atoms, i.e., until the time of last scattering tls corresponding to the redshift zls . One may write the sound horizon distance (Durrer 2021), using the metric given by Equation (1) for the CCC+TL model, as

The speed of sound in terms of the speed of light is given by (Durrer 2021)


where Ωb is the baryon density and Ωr is the radiation density. Following Equations (13) and (14), we get

It is to be noted that the variation of the speed of light is already included in the Friedmann equations and all the expressions derived from it. In addition, we have dropped f(tls) in Equation (18), since we are observing dsh in today's distance unit when f = 1.
Next, we have to determine zls in the CCC+TL model wherein the constants evolve as c(t) = c0 f(t), G = G0 f(t)3, h = h0 f(t)2, and kB = kB,0 f(t)2, and distance is measured using the speed of light (Gupta 2022a). How does the CMB Planck spectrum evolve with the redshift? We know that the frequency evolves as ν = ν0(1 + z), d ν = d ν0(1 + z), and volume V evolves as

since  . The energy density of the CMB photons in the frequency range ν and ν + d
ν, assuming it has the Planck spectrum, is given by
. The energy density of the CMB photons in the frequency range ν and ν + d
ν, assuming it has the Planck spectrum, is given by

Therefore, the number density of photons

The number of photons in a volume V is conserved, i.e.,

We may now write

where T = T0(1 + z). We can see that the CMB emission has the blackbody spectrum, but its intensity scales as  due to the TL effect. We can now determine zls
in the next section.
due to the TL effect. We can now determine zls
in the next section.
3. Results
Let us first see how the critical density in the CCC+TL model is related to that in the standard ΛCDM model. Using Equation (6),  . From Gupta (2023), by fitting the Type Ia supernovae data (Pantheon+), Hc
= 59.51 km s−1 Mpc−1, α = (−0.7997)Hc
, and
. From Gupta (2023), by fitting the Type Ia supernovae data (Pantheon+), Hc
= 59.51 km s−1 Mpc−1, α = (−0.7997)Hc
, and  km s−1 Mpc−1. Thus,
  , which is about the same as the estimated baryon density from observation of the visible matter (Ryden 2017). Next, we need to determine the current radiation energy density in the CCC+TL model. It is estimated as
  in the ΛCDM model (Ryden 2017), including neutrinos. Therefore, in the CCC+TL model, it is
  , and
, and  .
.
Sound Horizon. We know that the CMB temperature T0 = 2.7255 K. For T ≈ 3000 K required for the surface of the last scattering, we take  . Now, only the expanding Universe is responsible for the sound horizon and CMB power spectrum, i.e., we need to know the value of zc
when z = 1090, which is then taken as zls
. Following the steps in (Gupta 2023), we determined zls = 166. Briefly, Equation (44) in the paper relates zc
and z. It is solved numerically for zc
for any value of z, given Hc
and α, keeping in mind that the function f is also expressed in terms of zc
, Hc
, and α. We used the "fzero" function in Matlab for this purpose. Once we have zc
, zt
is obtained using (1 + z) = (1 + zc
)(1 + zt
).
. Now, only the expanding Universe is responsible for the sound horizon and CMB power spectrum, i.e., we need to know the value of zc
when z = 1090, which is then taken as zls
. Following the steps in (Gupta 2023), we determined zls = 166. Briefly, Equation (44) in the paper relates zc
and z. It is solved numerically for zc
for any value of z, given Hc
and α, keeping in mind that the function f is also expressed in terms of zc
, Hc
, and α. We used the "fzero" function in Matlab for this purpose. Once we have zc
, zt
is obtained using (1 + z) = (1 + zc
)(1 + zt
).
The angular diameter distance dA in the CCC+TL model (Gupta 2023)

The angular size of the sound horizon is  . Using Equations (15)–(18), the computed values, with zls = 166 and baryon density Ωb,0 = 1, are θsh = 060 as measured by Planck (Planck Collaboration et al. 2020), dsh = 15.5 Mpc, and DA
= 1.49 Gpc, when we set α = −0.845Hx
. The uncertainties in these values are not estimated as they are not relevant to our analysis of the model.
. Using Equations (15)–(18), the computed values, with zls = 166 and baryon density Ωb,0 = 1, are θsh = 060 as measured by Planck (Planck Collaboration et al. 2020), dsh = 15.5 Mpc, and DA
= 1.49 Gpc, when we set α = −0.845Hx
. The uncertainties in these values are not estimated as they are not relevant to our analysis of the model.
BAO Acoustic Scale. We will now examine BAO measurement from the angular separation of pairs of galaxies in thin redshift bins. Carvalho et al. (2021) present the data in z ∈ [0.105, 0.115] identified as the z = 0.11 bin. Lemos et al. (2023) provided them in 11 thin redshift bins ranging from z = 0.44 to z = 0.66 based on the work of Carvalho et al. (2016) and Carvalho et al. (2020). We may estimate the angular BAO scale θBAO(z), when using thin redshift bins, with the expression (Lemos et al. 2023)

where rs is the BAO characteristic length scale and dA (z) = dp /(1 + z) for the standard model. We therefore used Equation (25) with dp calculated for each redshift bin to determine rs and compared it with its expected value of rs ≈ 150 Mpc. We therefore used Equation (25) with dp calculated for each redshift bin to determine rs to see how it differs from its expected value of rs ≈ 150 Mpc. We present the results in Table 1 for the CCC+TL model. The uncertainties in the rs values correspond to the uncertainties in the θBAO values. One could expect the uncertainties to reduce similarly to those reported by Lemos et al. (2023) if the Gaussian process method was used to reconstruct the binned supernovae data. The values in Table 1 were fitted with straight lines using Matlab's "Curve Fitting" tool and presented in Figure 1. The weighted average value of rs = 151.0 (±5.1) Mpc was obtained by fitting the same values by constraining the fit line with zero slope; the 95% confidence bounds are shown in parentheses. When we did the same calculations for the ΛCDM model with the parameters H0 = 72.99 km s−1 Mpc−1 and Ωm,0 = 0.351 (Gupta 2023), we got the results shown in Figure 2, and rs = 145.2 (± 5.0) Mpc. Considering the error bars, the slopes in the figures may not be meaningful. The values for the two models agree within their 95% confidence bounds.

Figure 1. The absolute scale of BAO estimated at different redshifts using the CCC+TL model.
Download figure:
Standard image High-resolution image
Figure 2. The absolute scale of BAO estimated at different redshifts using the ΛCDM model.
Download figure:
Standard image High-resolution imageTable 1. BAO Data from the Angular Separation of Pairs of Galaxies Fitted to Extract the Absolute Scale of BAO
| z bin | Δ z bin |

| z c | d p (Mpc) | r s (Mpc) |
|---|---|---|---|---|---|
| 0.11 | [0.105, 0.115] | 19.8 ± 1.05 | 0.088 | 439 | 151.7 ± 8.0 |
| 0.45 | [0.44, 0.46] | 4.77 ± 0.17 | 0.347 | 1684 | 140.2 ± 5.0 |
| 0.47 | [0.46, 0.48] | 5.02 ± 0.25 | 0.362 | 1752 | 153.5 ± 7.7 |
| 0.49 | [0.48, 0.50] | 4.99 ± 0.21 | 0.376 | 1819 | 158.4 ± 6.7 |
| 0.51 | [0.50, 0.52] | 4.81 ± 0.17 | 0.391 | 1886 | 158.3 ± 5.6 |
| 0.53 | [0.52, 0.54] | 4.29 ± 0.30 | 0.405 | 1952 | 146.1 ± 10.2 |
| 0.55 | [0.54, 0.56] | 4.25 ± 0.25 | 0.419 | 2018 | 149.7 ± 8.8 |
| 0.57 | [0.56, 0.58] | 4.59 ± 0.36 | 0.433 | 2083 | 166.9 ± 13.1 |
| 0.59 | [0.58, 0.60] | 4.39 ± 0.33 | 0.448 | 2148 | 164.6 ± 12.4 |
| 0.61 | [0.60, 0.62] | 3.85 ± 0.31 | 0.462 | 2211 | 148.6 ± 12 |
| 0.63 | [0.62, 0.64] | 3.90 ± 0.43 | 0.476 | 2276 | 154.9 ± 17.1 |
| 0.65 | [0.64, 0.66] | 3.55 ± 0.16 | 0.490 | 2339 | 144.9 ± 6.5 |
Download table as: ASCIITypeset image
One would also like to know the sensitivity of the rs with respect to the changes in Hc and α. With 95% confidence (2σ), we have Hc = 59.51(± 1.06) km s−1 Mpc−1 and α = −0.7997(± 0.0143)Hc (Gupta 2023). For zbin = 0.11, the value of rs increases from 149.1 to 154.5 Mpc with decreasing Hc over 2σ for α = −0.7997Hc , and rs varies only 0.2 Mpc with varying α over 2σ for all the Hc values. Correspondingly, for zbin = 0.65, the value of rs increases from 142.5 to 147.6 Mpc with decreasing Hc , and varies 1.2 Mpc with varying α over 2σ. It means that the rs values are relatively stable against the changes in Hc and α, especially when compared to the uncertainties in their value due to uncertainties in θBAO values.
As a side note, it can be shown that the Jean density in the new model decreases by a factor of f3 (∼30 at z = 20) as compared to the standards model and, therefore, star formation can begin at higher temperature and redshift by a factor of f. Also, the matter–radiation equality happens at z ∼10,000.
4. Discussion
The primary objective of this paper is to see if the recently proposed cosmological model CCC+TL (Gupta 2023) is compliant with (a) the sound horizon angular size θsh resulting from the oscillations in the primordial baryon–photon plasma that is imprinted and observed in the CMB thermal anisotropy spectrum; and (b) the absolute scale rs , believed to be resulting from the BAOs, as derived from the measurements of the angular size of the two-point correlation function ξ(s) of the separation s of millions of galaxies. Most models assume these are correlated. However, in the words of Sutherland (2012), "The baryon acoustic oscillation (BAO) feature in the distribution of galaxies provides a fundamental standard ruler which is widely used to constrain cosmological parameters. In most analyses, the comoving length of the ruler is inferred from a combination of CMB observations and theory. However, this inferred length may be biased by non-standard effects in early universe physics; this can lead to biased inferences of cosmological parameters...." Since our model is different from the standard models, we will not attempt to correlate the two.
Currently, we do not have any CCC+TL parameters by fitting the CMB thermal anisotropy spectrum. Thus, we decided to test the new model for its consistency with the CMB sound horizon and the BAO low-redshift observations using the model parameters determined by fitting the Pantheon+ data (Brout et al. 2022; Scolnic et al. 2022): Hc = 59.51 (± 1.06) km s−1 Mpc−1 and α = −0.80 (± 0.01) Hc . These are the only two parameters required for fitting the data. Ignoring the uncertainty, they result in H0 = 72.62 km s−1 Mpc−1 (Gupta 2023).
The only adjustable parameter when fitting the sound horizon angular size at recombination (Equations (15) to (18)) has been taken to be the CCC parameter α. It is because the function chosen to define CCCs is arbitrary and should not be expected to remain unchanged over the full cosmological timescale. Fortunately, only 5.6% change in α is required to yield the angular size θsh = 060 from Planck observations (Planck Collaboration et al. 2020—Table 6). It is only about half the Hubble tension. However, the model-dependent physical size dsh = 15.5 Mpc is very different from the ΛCDM model value of dsh ≅ 135 Kpc using Planck parameters: H0 = 67.32 km s−1 Mpc−1, Ωm,0 = 0.3158, and Ωb,0 = 0.16Ωm,0; the ratio of the two is ∼100. The main reason for such a significant difference in dsh values is that the expanding Universe redshifts of the last scattering surface for the two models are vastly different: the expanding Universe component for the CCC+TL model is 166 versus 1089 for the ΛCDM model, i.e., the sound horizon progresses for a longer duration in the CCC+TL compared to the ΛCDM model. Since the angular diameter distance DA
at the last scattering surface for the CCC+TL model is ∼100 times larger than for the ΛCDM model, about the same as the ratio of the dsh for the two models (Figure 3), θsh(= 060) is the same for the two models. The figure is drawn with α = −0.845Hx
.

Figure 3. Angular diameter distance as a function of redshift in CCC+TL and ΛCDM models.
Download figure:
Standard image High-resolution image
The baryon density in the new model is the same as the critical density. However, since there is no explicit dark energy in the new model, all of the critical density at present is comprised of matter in the CCC models. Since the critical density in the CCC+TL model is only 3.1% of the standard model, it can all be accounted by the baryonic matter in the Universe.
We have shown that the CMB emission has the blackbody spectrum in the CCC+TL model. Its intensity scales as  due to the TL effect. Since zt
= 0 at present, we see the evolving spectrum as a perfect blackbody when observed.
due to the TL effect. Since zt
= 0 at present, we see the evolving spectrum as a perfect blackbody when observed.
The question naturally arises if an experiment can be designed to test the existence of the two redshift components. Wang et al. (2022, 2023) have proposed a method of testing redshift drift, a direct measure of cosmological expansion, using gravitationally lensed images of distant objects. Multiple images arriving at the same instant would traverse different distances and thus would have left an object at different times. With high enough accuracy in measuring redshifts, one could estimate the redshift drift using any two images, hence the cosmological expansion. Any difference in the values of expansion rate calculated using different pairs of object images could be due to the TL redshift. Another gravitational lensing method uses the Type Ia supernovae with a well-defined brightness-peaking profile or quasars with some brightness fluctuation profile marker (Cao et al. 2018, 2020; Gupta 2021a). Such markers in their luminosity show up at different times in their images; different path lengths would mean different contributions to the redshift due to the TL effect, while the redshift due to the expansion would be the same in such images.
One could also consider designing an experiment to test the coupling constants' variation. One has to be cognizant that in the CCC model, variation of several coupling constants is determined by a single function, i.e., fixing one coupling constant leads to this function not varying and thus all coupling constants not varying. We have yet to find an observation or experiment that can detect the variation of this function and, therefore, of the coupling constants (Gupta 2021a, 2021b, 2022b).
It is perhaps worth mentioning that the globular cluster age determination may not be able to validate or falsify a model based on its prediction of the Universe's age. As is well known, the age of globular clusters is model-dependent, and models have been adjusted whenever the age of a star or cluster exceeds the Universe's age. Bolte & Hogan (1995) determined certain cluster ages 15.8 ± 2.1 Gyr. Considering the Methuselah star, Tang & Joyce (2021) revised its best age estimate from 14.5 ± 0.8 Gyr down to a comfortable 12.0 ± 0.5 Gyr by adjusting parameters in the MESA stellar evolution code. If the Universe's age is established by other methods to be significantly higher than the currently accepted 13.8 Gyr, astrophysicists will be relieved from the burden of constraining stellar ages below 13.8 Gyr. This is evident from the work of Llorente de Andrés (2023), who determined the age of globular cluster NGC104 between 19.04 and 20.30 Gyr after learning that the Universe could be 26.7 Gyr old. With no age constraint to worry for recently born clusters, Jeffries et al. (2023) adjusted the age of a young open cluster IC 4665 from 32 Myr to greater than 50 Myr. Thus, the age of a star or a cluster cannot be considered a constraint on the Universe's age.
Admittedly, the CCC+TL model is significantly more complex to work with than the ΛCDM model. However, extending simple models to account for precision observations leads to tensions. In the age of precision cosmology, we need to be vigilant about new models that may be needed to go beyond the domain of cosmology so eloquently serviced by the standard model. A word of caution: applied hastily, partially, or incorrectly, CCC+TL would lead to wrong results; it needs good account keeping of all that might be affected when moving from the standard model to the CCC+TL model.
5. Conclusion
The CCC+TL model has successfully resolved the "impossible early galaxy" problem by stretching rather than compressing the timeline for the formation of stars and galaxies as required by the ΛCDM model. The resulting almost doubling in the age of the Universe and increasing the formation times by 1 order of magnitude has been a subject of concern and requires that the new model also explain some critical cosmological and astrophysical observations, such as CMB, BBN elemental abundances, and BAO. We have presented in this paper, using the new model, the calculation of (i) the low-redshift BAO absolute scale, which is the same as observed and estimated using the standard model within the 95% confidence level of the two models, and (ii) the sound horizon angular size consistent with Planck observation at the surface of last scattering and established that all the critical density comprises the baryon density with no room for dark matter. Due to the involvement of CCCs and the hybrid nature of the CCC+TL model, the BAO feature in the tracer power spectrum (CMB) is not at the same scale as in the matter (galaxies) power spectrum (Dodelson & Schmidt 2021). We now have additional confidence to continue with the development of CMB and BBN codes tailored to the new model for testing it further.
Acknowledgments
The author is grateful to the reviewer of the paper for constructive comments that improved the quality and clarity of the paper, and to Professors Brian Keating, Avi Loeb, Nikita Lovyagin, and David Spergel for communications with him and constructive critical comments on the CCC+TL model. He wishes to thank Macronix Research Corporation for the unconditional research grant for this work.
Data Availability
References have been provided for the data used in this work.
Footnotes
- 1
For the sake of clarity we have repeated some of the material from Gupta (2023).