


Abstract
Recently, the region surrounding eHWC J1842−035 has been studied extensively by γ-ray observatories due to its extended emission reaching up to a few hundred TeV and potential as a hadronic accelerator. In this work, we use 1910 days of cumulative data from the High Altitude Water Cherenkov (HAWC) observatory to carry out a dedicated systematic source search of the eHWC J1842−035 region. During the search, we found three sources in the region, namely, HAWC J1844−034, HAWC J1843−032, and HAWC J1846−025. We have identified HAWC J1844−034 as the extended source that emits photons with energies up to 175 TeV. We compute the spectrum for HAWC J1844−034, and by comparing with the observational results from other experiments, we have identified HESS J1843−033, LHAASO J1843−0338, and TASG J1844−038 as very-high-energy γ-ray sources with a matching origin. Also, we present and use the multiwavelength data to fit the hadronic and leptonic particle spectra. We have identified four pulsar candidates in the nearby region in which PSR J1844−0346 is found to be the most likely candidate due to its proximity to HAWC J1844−034 and the computed energy budget. We have also found SNR G28.6−0.1 as a potential counterpart source of HAWC J1844−034 for which both leptonic and hadronic scenarios are feasible.
Export citation and abstract BibTeX RIS

Original content from this work may be used under the terms of the Creative Commons Attribution 4.0 licence. Any further distribution of this work must maintain attribution to the author(s) and the title of the work, journal citation and DOI.
1. Introduction
The origin of cosmic rays has been one of the primary questions the astrophysical community has been asking for over a century. Although there has been a lot of advancement in observational techniques and technology, our understanding of cosmic rays is far from complete. Cosmic-ray sources cannot be traced directly due to deflections of cosmic-ray particles, but γ-ray photons of hadronic origin can be used to indirectly search for cosmic-ray sources. However, γ-ray photons can also be produced from leptonic processes; hence, a rigorous analysis is required to discern between hadronic- and leptonic-induced γ-ray sources.
One particular feature of the cosmic-ray spectrum is a break at around a few peta-electronvolts (PeVs) that is known as the "knee" (Amenomori et al. 2008). Cosmic rays with energies less than the knee are believed to be accelerated by Galactic objects. These sources that can accelerate particles up to a PeV energy scale without a break are known as PeVatrons (Tibet ASγ Collaboration et al. 2021).
If a Galactic γ-ray source has been identified as a cosmic-ray accelerator, we can study its spectrum to look for potential traces of a PeVatron. The proton spectrum of a PeVatron should cut off after a few PeV, leading to a hard γ-ray spectrum below the cutoff region corresponding to ∼100 TeV (Celli et al. 2020). Therefore, the spectrum of γ-rays near the 100 TeV energy range can be useful for identifying PeVatron candidates (Sudoh & Beacom 2023).
Object eHWC J1842−035 is one of the nine sources that was observed above 56 TeV by the High Altitude Water Cherenkov (HAWC) Observatory in its High-Energy Catalog (Abeysekara et al. 2020). This result was later reinforced by the Large High Altitude Air Shower Observatory (LHAASO) in 2021 (Cao et al. 2021). LHAASO observed a bright extended source at a similar location of 0.14° from eHWC J1842−035. LHAASO reported the γ-ray flux at 100 TeV. Also, in 2022, the Tibet AS-Gamma Experiment published observational results on an extended source, TASG J1844−038, with a spectrum reaching up to 100 TeV (Amenomori et al. 2022). The observations by the three different multi-TeV γ-ray observatories are highly likely to be originating from the same source.
In this work, we report the updated HAWC results on this bright extended source (to be referred to as HAWC J1844−034) obtained from rigorous multisource modeling of the region (Section 3). In Section 4, we discuss the spectral studies of the results, as well as the origin of the observed emission and systematic studies, providing evidence of counterpart sources in the region from other experiments.
2. Instrument and Data Analysis
2.1. HAWC
The HAWC observatory is a ground-based particle sampling array located on Sierra Negra, Mexico, at an altitude of 4100 m. It is designed to observe very-high-energy (VHE) γ-ray photons by detecting Cherenkov radiation produced from electromagnetic air showers as they propagate through the water Cherenkov detectors (WCDs). The main array of HAWC, composed of 300 WCDs, covers a geometrical area of 22,000 m2 (Abeysekara et al. 2023). Each WCD consists of a bladder containing 180,000 L of purified water that is protected by a metal casing with a roof on top. A WCD has a height of 5.4 m and a diameter of 7.3 m. Four photomultiplier tubes (PMTs) are located at the bottom of each WCD to collect the Cherenkov light emitted by air shower particles. For more detailed information on the design and operation of HAWC, refer to Abeysekara et al. (2017a, 2023).
The γ-ray events collected by HAWC are categorized into analysis bins based on the fraction of the PMTs used in the event reconstruction (fhit) and the estimated energies of the particular event (Abeysekara et al. 2017a, 2019). We call these the "ground parameter" (GP) and "neural network" (NN) energy estimators.
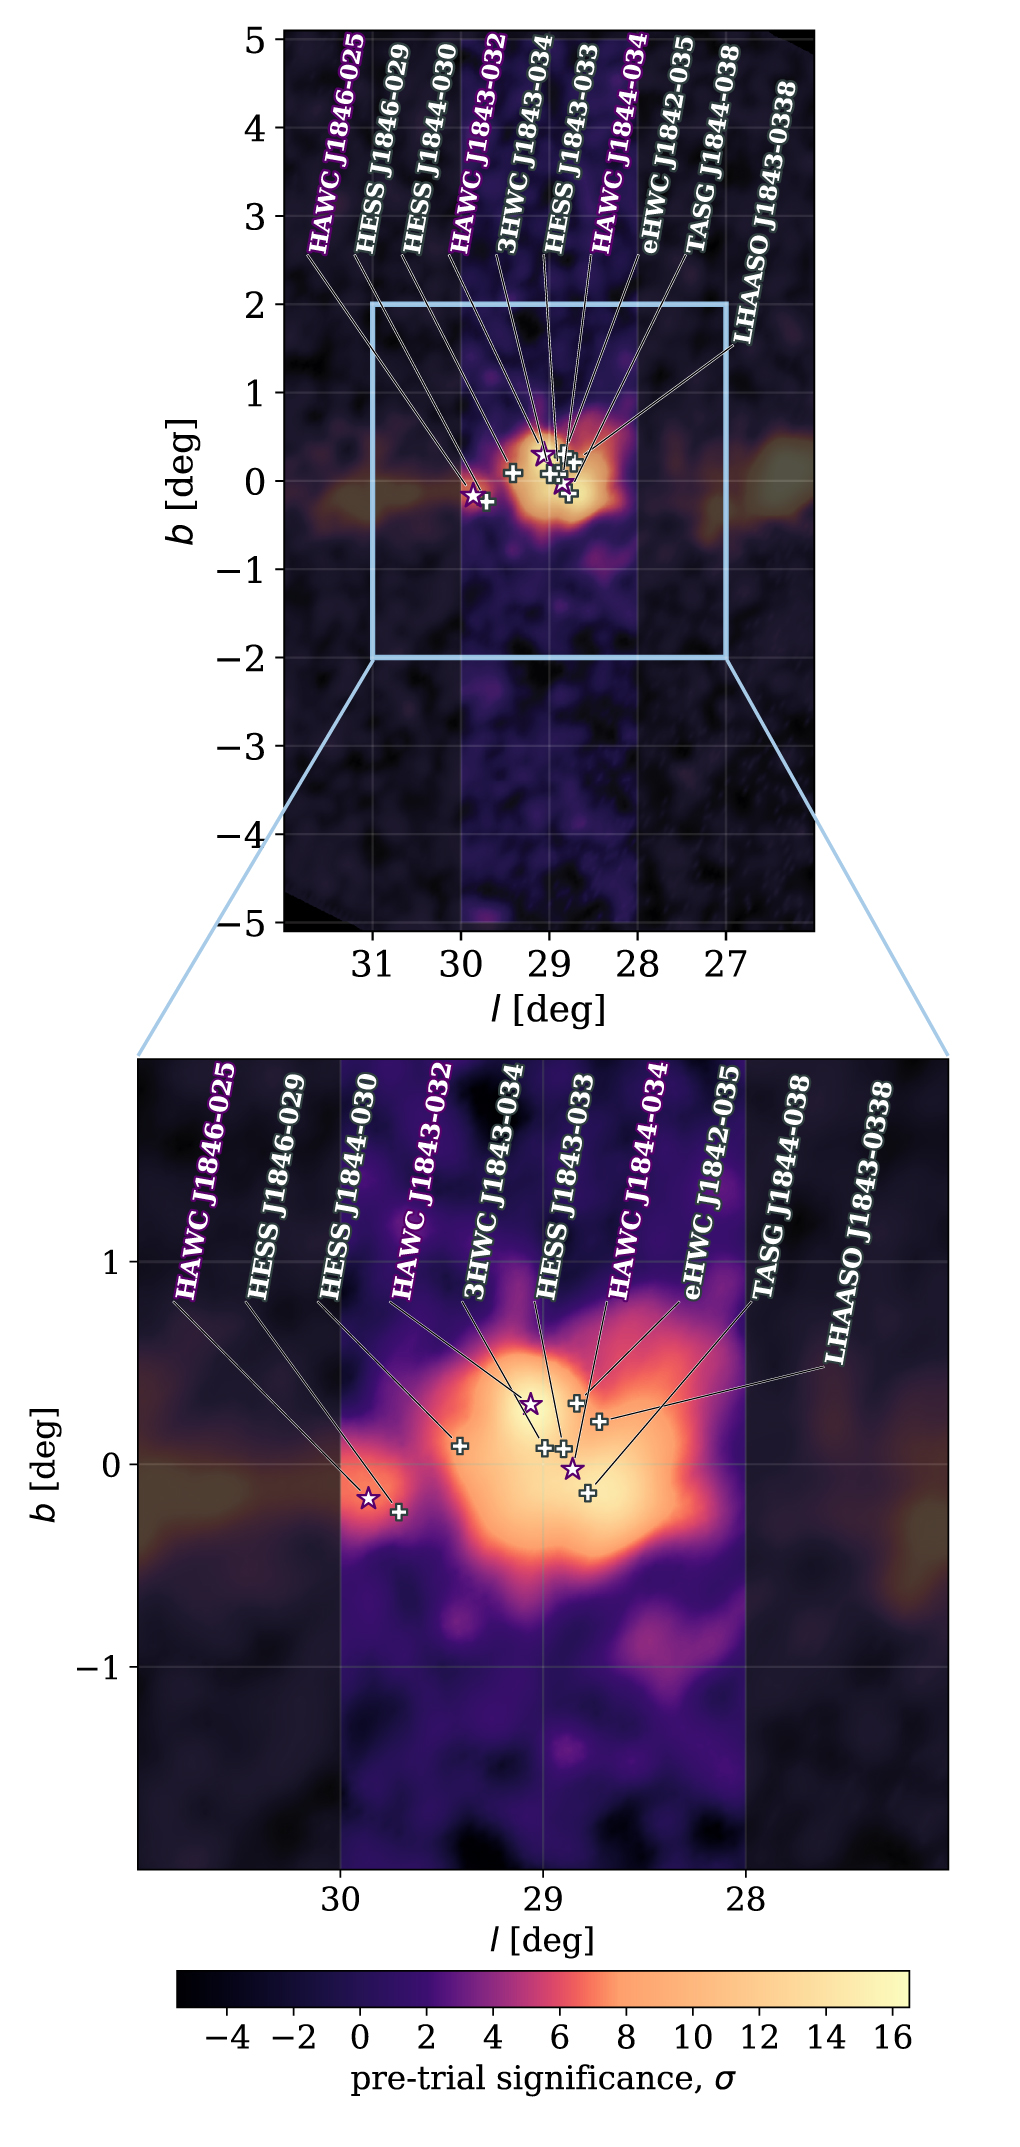
The HAWC High-Energy Catalog released in 2020 used the GP data set that contains 1039 days of cumulative data (Abeysekara et al. 2020). In this work, we have used 1910 days of the GP energy estimator data above 17.8 TeV and fhit above 24.5% that are within our region of interest (ROI) to compute the most sensitive results on the high-energy spectrum of HAWC J1844−034. The energy resolution for the GP energy estimator is 50% at 20 TeV and 34% at 100 TeV (Abeysekara et al. 2019). The angular resolution range for the GP energy estimator bins used in the analysis is 0.1°–0.6° (Abeysekara et al. 2019). Our ROI is a rectangular region defined as 28° < l < 30° and −5° < b < 5°, where l and b are the Galactic longitude and latitude, respectively. The ROI is presented as the brighter region in Figure 1, which has been chosen to include the extended emission.

Figure 1. The 1910 day HAWC significance map in Galactic coordinates highlighting the eHWC J1842−035 region. The brighter part of the map is the ROI used for the analysis. The labels indicate the known VHE γ-ray sources within the ROI. Note that 3HWC J1843−034 indicates the best-fit location of the source found from the HAWC all-energy catalog (Albert et al. 2020).
Download figure:
Standard image High-resolution imageThe multimission maximum-likelihood 30 framework and HAWC accelerated-likelihood 31 plug-in (Vianello et al. 2015; Abeysekara et al. 2021) are used to simultaneously fit multiple source models and their relevant free parameters based on maximum-likelihood estimations. Spectral and morphological models mentioned in this work can be found in astromodels. 32
In our analysis, a test statistic (TS) is used to evaluate the pretrial statistical significance of a fitted model in a region with a predetermined number of free parameters. The TS provides a statistical measure of how well an alternative hypothesis performs over a null hypothesis. The TS values can be used to compare between different nested models. The TS is defined as

àwhere L1 is the likelihood for an alternative hypothesis, and L0 is the likelihood for a null hypothesis. To compare two different alternative hypotheses,  can be used, where L2 is the likelihood for a different alternative hypothesis (Abeysekara et al. 2017a). Using Wilks's theorem (Wilks 1938), a pretrial significance can be computed with
  , which is used to generate HAWC significance maps (Abeysekara et al. 2017b).
In order to find a statistically optimal list of sources in the ROI, a systematic approach developed by the Fermi Large Area Telescope (Fermi-LAT) Collaboration is used (Ackermann et al. 2017). For the source search, we recursively add a point source to the model in our ROI until the improvement of the overall TS becomes less than 16. Then, we test an extended source model for each of the found point sources. Starting from the brightest source, we accept an extended source model if ΔTS > 16.
During this process, we assumed a power-law spectral model for all of the sources involved,

where  is the γ-ray flux at the γ-ray energy Eγ
, Φ0 is the flux normalization at a pivot energy Epiv, and Γ is the spectral index. Here Φ0 and Γ are set as free parameters to be determined by the likelihood fit, and Epiv is fixed at 20 TeV. For the pivot energy, we have scanned through the entire energy range from which we have obtained a minimum correlation between the free parameters at 20 TeV.
is the γ-ray flux at the γ-ray energy Eγ
, Φ0 is the flux normalization at a pivot energy Epiv, and Γ is the spectral index. Here Φ0 and Γ are set as free parameters to be determined by the likelihood fit, and Epiv is fixed at 20 TeV. For the pivot energy, we have scanned through the entire energy range from which we have obtained a minimum correlation between the free parameters at 20 TeV.
Once the optimal number of point and extended sources is determined from the systematic source search, more realistic spectral models are applied and tested. A power law with an exponential cutoff and log parabola models have been used:


where Ec of Equation (3) is the cutoff energy, and β of Equation (4) describes the curvature of the power-law spectrum.
The radially symmetric Gaussian morphology (Abeysekara et al. 2019) is formulated as

where θ and σ are the angular distance and Gaussian width as a measure of the size of the extended source model, respectively. Here σ is set as a free parameter during likelihood fits.
2.2. Naima Framework
The Naima software 33 (Zabalza 2015) is a nonthermal γ-ray modeling framework based on Markov Chain Monte Carlo methods. It is used to model and fit the spectra of accelerated particles in hadronic and leptonic scenarios based on the observed electromagnetic data. The Naima software provides numerical models for a hadronic scenario based on neutral pion decays from inelastic proton–proton collisions (Kafexhiu et al. 2014) and a leptonic scenario based on inverse Compton scattering of relativistic electrons with low-energy photons and synchrotron emission from relativistic electrons (Aharonian et al. 2010; Khangulyan et al. 2014). We have used the Naima framework to generate particle spectra for the hadronic and leptonic scenarios of HAWC J1844−034. The results are presented in Sections 4.4 and 5.2.
3. Results
Figure 1 shows the 1910 day HAWC significance map of the eHWC J1842−035 region in Galactic coordinates, where our ROI is indicated by the brighter rectangular region (28° < l < 30° and −5° < b < 5°). Figure 1 also includes source labels from various γ-ray observatories, such as the High Energy Stereoscopic System (H.E.S.S.), HAWC, Tibet AS-Gamma, and LHAASO (H.E.S.S. Collaboration et al. 2018; Abeysekara et al. 2020; Albert et al. 2020; Cao et al. 2021; Amenomori et al. 2022).
From a systematic source search in the ROI, we have found three sources as the statistical optimum, namely, HAWC J1843−032 and HAWC J1846−025 as point sources and HAWC J1844−034 as an extended source fitted with a radially symmetric Gaussian morphology (Equation (5)). We have used a power-law spectral model for each of the point sources and a log parabolic spectral model for HAWC J1844−034. The best-fit parameters at the pivot energy of 20 TeV along with their TS and posttrial significance values can be found in Table 1. Among the three sources we have found during the systematic source search, HAWC J1844−034 is by far the brightest and most dominant source, with the 1σ upper energy bound of the observed photons reaching 175 TeV, which is comparable to the 260 TeV photons observed by LHAASO (Cao et al. 2021). Therefore, we have conducted further analyses on HAWC J1844−034, which will be discussed in Section 4. Note that the upper energy bound has been obtained by profiling the likelihood of the best-fit spectrum multiplied by a step function while having the bound energy as the only free parameter. The 1σ level corresponds to the estimate at ΔTS = 1 (Albert et al. 2021a). On the other hand, both HAWC J1843−032 (4.89σ) and HAWC J1846−025 (3.32σ) have a significance of <5σ. Hence, HAWC J1843−032 and HAWC J1846−025 are γ-ray candidates that we have found during the modeling of the HAWC J1844−034 region.
Table 1. Best-fit Parameters Found from a Multiple-source Likelihood Fit of the Nested Model in the ROI
| Source | α | δ | Φ0 | Γ | β | Size | TS | Signif. |
|---|---|---|---|---|---|---|---|---|
| (deg) | (deg) | [(TeV cm2 s)−1] | (deg) | |||||
| HAWC J1844−034 |

|

|

|

|

|

| 718.49 | 26.26 |
| HAWC J1843−032 |

|

|

|

| ⋯ | ⋯ | 33.39 | 4.89 |
| HAWC J1846−025 |

|

|

|

| ⋯ | ⋯ | 18.67 | 3.32 |
Notes. The listed values are the best-fit parameters and their statistical uncertainties. Here α and δ are R.A. and decl., respectively. Signif. is the posttrial significance, and Φ0 is the flux normalization at a pivot energy of 20 TeV. Size is the 1σ radius of the extended Gaussian morphological model used to fit HAWC J1844−034.
Download table as: ASCIITypeset image
In Figure 2(b), a residual map is presented after fitting and subtracting the best-fit model (Figure 2(a)) from Figure 1. Also, Figure 3 is a significance histogram that shows the computed distribution of pixels in the ROI of Figure 2(b). The histogram is used to look for obvious signatures of overfitting or underfitting of the γ-ray excess in the ROI, neither of which are present in the distribution. Also for the histogram, we have computed a χ2 per number of degrees of freedom of 92.85/77 ≈ 1.20 for the best-fit Gaussian curve in green.

Figure 2. (a) Significance map of the best-fit model described in Table 1. (b) Residual map produced by subtracting the best-fit model.
Download figure:
Standard image High-resolution image
Figure 3. One-dimensional significance distribution histogram collected per pixel of Figure 2(b). The expected background-only distribution is described by the red Gaussian curve. The green line is the best-fit Gaussian curve of the data present in the range between −2 and 2.
Download figure:
Standard image High-resolution image4. Discussions
4.1. Spectral Properties of HAWC J1844−034
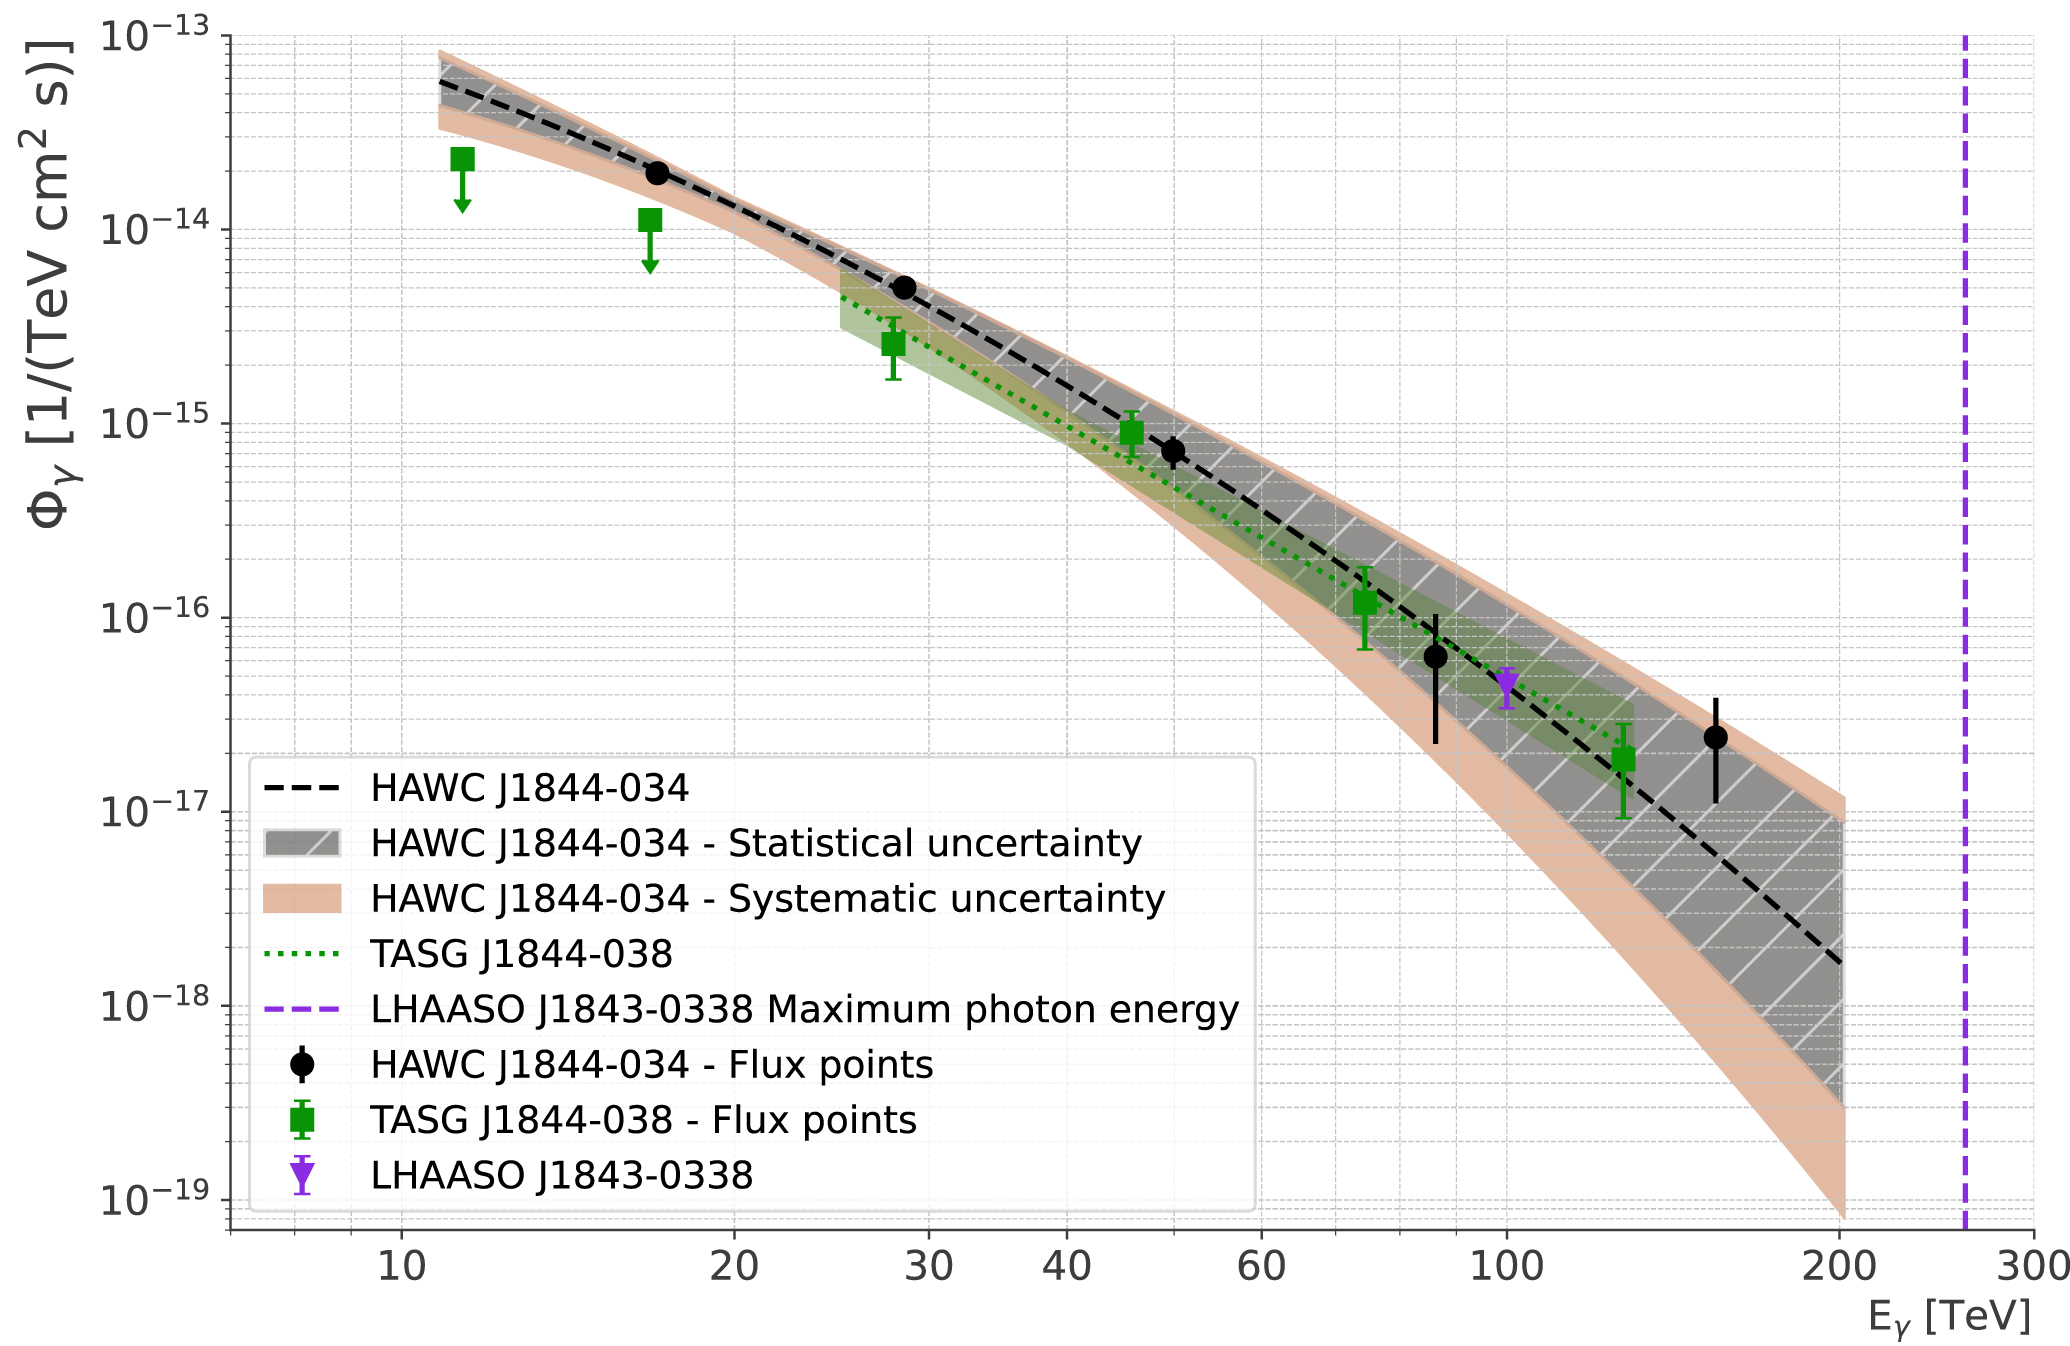
Figure 4 shows the spectrum of HAWC J1844−034. The gray and red bands represent the statistical and systematic uncertainties, respectively. The various systematic uncertainty components have been summed in quadrature (later discussed in Section 4.3). We have calculated the flux points of HAWC J1844−034 (black) by refitting Φ0 at each energy bin while maintaining the best-fit parameters for the spectral shape, Γ and β (Abeysekara et al. 2019).

Figure 4. Best-fit spectrum of HAWC J1844−034.
Download figure:
Standard image High-resolution imageIn the figure, the TeV γ-ray flux data points from Tibet AS-Gamma (green) and LHAASO (purple) at 100 TeV have also been added for comparison (Cao et al. 2021; Amenomori et al. 2022). The fitted HAWC spectrum is in good agreement with the results from both LHAASO and Tibet AS-Gamma. According to the HAWC results, the falloff in the spectrum is gradual, which may be consistent with the 260 TeV photons observed by LHAASO (purple dashed line; Cao et al. 2021). The best-fit spectrum of TASG J1844−038 has been observed with a power-law function in 25 TeV < Eγ
< 130 TeV (Amenomori et al. 2022). In this energy range, TASG J1844−038 has four flux points exceeding 2σ, which correspond well with the best-fit spectrum of HAWC J1844−034. The best-fit power-law spectrum for TASG J1844−038 has a spectral index of Γ = 3.26 ± 0.30, which falls more sharply than the index of HAWC J1844−034,  , at 20 TeV (Amenomori et al. 2022). This may be due to the different conditions we are performing the fits in, such as the energy range, pivot energy, and spectral model. However, there is sufficient overlap despite having different conditions, as shown in Figure 4. Also, at the pivot energy of TASG J1844−038 (Epiv = 40 TeV), the spectral index of HAWC J1844−034 is found to be
  , which is consistent with the results from Tibet AS-Gamma. Furthermore, the sources found by the three γ-ray observatories are spatially consistent given their angular resolutions: ∼0.1°–0.6° for ≥10 TeV (HAWC), 0.24°–0.3° for 100 TeV (LHAASO), and ∼0.28° for 100 TeV (Tibet AS-Gamma; Abeysekara et al. 2019; Wang et al. 2021; Amenomori et al. 2022).
4.2. Extended Emission from HAWC J1844−034
Figure 5 displays the radial distribution of the γ-ray excess profile from the best-fit location of HAWC J1844−034 (magenta points). The brown solid line represents the overall best-fit model that includes all three HAWC sources of the region. The black dashed, blue dotted–dashed, and red dotted lines represent the best-fit models for each source, and the dotted vertical lines represent the distances of each labeled source from HAWC J1844−034. Note that TASG J1844−038 (green) and LHAASO J1843−0338 (purple) are not included in the inclusive model. The inclusive model shows a good match with the excess. Also, TASG J1844−038 presents a good spatial agreement with HAWC J1844−034. Conversely, LHAASO J1843−0338 is positioned between the peaks of HAWC J1844−034 and HAWC J1843−032, which corresponds to a plateau of the overall excess peak.

Figure 5. Radial profile from the best-fit location of HAWC J1844−034 in the center. The dotted lines are the radial distances of the best-fit positions of the sources from the center of HAWC J1844−034.
Download figure:
Standard image High-resolution image4.3. Systematic Uncertainties
Factors that may contribute to the systematics are listed in Table 2. The first four components in the table arise from various detector and simulation effects (see Abeysekara et al. 2017a, 2019). The diffuse background emission (DBE) is a systematic effect arising from any unresolved sources and the true Galactic diffuse emission. We have calculated this effect by adding a Gaussian background model along the Galactic equator with a fixed width of 1° (Rho et al. 2018; Albert et al. 2021b) in the nested fit. We have compared the best-fit parameters of the three sources and added the differences as a systematic component. A power-law spectral model (Equation (2)) with an index of 2.75 is assumed for the DBE based on Abdo et al. (2008) and Albert et al. (2022).
Table 2. Systematic Uncertainties
| HAWC J1844−034 | HAWC J1843− 032 | HAWC J1846−025 | ||||||
|---|---|---|---|---|---|---|---|---|
| Uncertainty Origin | Φ0 | Γ | β | Size | Φ0 | Γ | Φ0 | Γ |
| [(TeV cm2 s)−1] | (deg) | [(TeV cm2 s)−1] | [(TeV cm2 s)−1] | |||||
| Late light |

|

|

|

|

|

|

|

|
| Charge uncertainty | −7.48 × 10⁻¹⁶ | +0.08 | −0.04 | +0.00 | −4.75 × 10⁻¹⁷ | +0.03 | −2.26 × 10⁻¹⁷ | +0.03 |
| PMT efficiency | +4.67 × 10⁻¹⁶ |

| −0.04 |

| +6.13 × 10⁻¹⁷ |

| +2.67 × 10⁻¹⁷ |

|
| PMT threshold |

|

|

|

|

|

| +9.06 × 10⁻¹⁸ | +0.03 |
| DBE | −2.70 × 10⁻¹⁵ | −0.11 | +0.37 | −0.08 | −1.52 × 10⁻¹⁷ | −0.02 | −8.06 × 10⁻¹⁹ | +0.06 |
| ROI | +7.17 × 10⁻¹⁶ | +0.00 | −0.02 | +0.03 | −2.78 × 10⁻¹⁸ | −0.02 | +1.61 × 10⁻¹⁶ | −0.34 |
| Quadratic summed |

|

|

|

|

|

|

|

|
Download table as: ASCIITypeset image
Finally, our choice of ROI has been considered as a systematic uncertainty. Our ROI has been chosen as the best compromise between considering a large enough region to include the extended γ-ray excess of HAWC J1844−034 and minimizing the number of sources we would have to simultaneously fit. During the analysis, the ROI is predetermined before the systematic source search; hence, we have used a larger ROI of 28° < l < 30.3° to see how much of an effect this would have on the source of our main interest, HAWC J1844−034. Although extending the ROI has shown a notable effect on HAWC J1846−025, there is a minimal effect on HAWC J1844−034.
Table 3. A List of Known γ-Ray Sources near HAWC J1844−034
| Source | α (deg) | δ (deg) | Δ (deg) | Size (deg) |
|---|---|---|---|---|
| HAWC J1844−034 |

|

| ⋯ |

|
| LHAASO J1843−0338 | 280.75 | −3.65 | 0.27 | 0.3 |
| TASG J1844−038 |

|

| 0.14 | 0.34 ± 0.12 |
| HESS J1843−033 | 280.95 | −3.55 | 0.11 | 0.24 ± 0.06 |
| HESS J1844−030 | 281.17 | −3.10 | 0.56 | 0.02 ± 0.013 |
| 4FGL J1843.7−0326 | 280.93 | −3.44 | 0.22 | ⋯ |
| 4FGL J1844.4−0345 | 281.12 | −3.75 | 0.15 | ⋯ |
Notes. Here Δ is the angular distance from the center of HAWC J1844−034. The size of LHAASO J1843−0338 is referred from the extension template of 0.3° (Cao et al. 2021). The size of TASG J1844−038 does not include the PSF contribution (Amenomori et al. 2022, see Equation (1)). HESS J1843−033 consists of two Gaussian peaks (H.E.S.S. Collaboration et al. 2018). The positional error of LHAASO J1843−0338 was not reported.
Download table as: ASCIITypeset image
4.4. Leptonic versus Hadronic Scenarios
The nature of the γ-ray emission from HAWC J1844−034 has been modeled and studied to test if this source is a potential hadronic accelerator. In the hadronic scenario, the emission of γ-rays is dominated by the process π0 → 2γ. If the neutral pions are produced from the collisions of ambient protons that are accelerated by HAWC J1844−034 (Kafexhiu et al. 2014), then the observed γ-ray spectrum can be used to constrain the proton spectrum of HAWC J1844−034 (Celli et al. 2020). The hadronic scenario is powered by the proton–proton scatterings of accelerated protons and protons of the ambient gas. During the fit, we have assumed a proton density of 1 cm−3.
In the case of the leptonic scenario, the TeV γ-ray emission is produced mostly from the inverse Compton scattering between low-energy ambient photons and high-energy electrons accelerated by HAWC J1844−034 (Khangulyan et al. 2014). Due to the Klein–Nishina effects, the γ-ray spectrum originating from the inverse Compton scattering has a spectral cutoff at tens of TeV (Aliu et al. 2014). For the inverse Compton scattering of the leptonic scenario, we used cosmic microwave background (CMB) photons as seed photons that are upscattered by the accelerated electrons.
Figure 6 presents the locations of the sources inside our ROI. The labels at the top of the figure are the VHE γ-ray sources found by H.E.S.S., Tibet AS-Gamma, and LHAASO and previously detected sources from HAWC catalogs (H.E.S.S. Collaboration et al. 2018; Cao et al. 2021; Amenomori et al. 2022). The purple labels indicate the sources specifically found by this work. The lower red labels indicate GeV γ-ray sources observed by Fermi-LAT (Abdollahi et al. 2020, denoted as 4FGL), the green labels are for pulsars from the ATNF pulsar catalog (Manchester et al. 2005), and the blue label marks a known supernova remnant, SNR G28.6−0.1 (Condon et al. 1998; Bamba et al. 2001); Ebisawa et al. 2005. Furthermore, Table 3 contains the positional properties of the sources observed by other experiments labeled in Figure 6, namely, LHAASO, Tibet AS-Gamma, H.E.S.S., and Fermi-LAT.

Figure 6. Significance map of the HAWC J1844−034 region with TeV γ-ray sources labeled at the top (H.E.S.S. Collaboration et al. 2018; Abeysekara et al. 2020; Albert et al. 2020; Cao et al. 2021; Amenomori et al. 2022), Fermi-LAT sources in red (Abdollahi et al. 2020), and known pulsars and SNR in green and blue, respectively (Bamba et al. 2001; Ueno et al. 2003; Manchester et al. 2005).
Download figure:
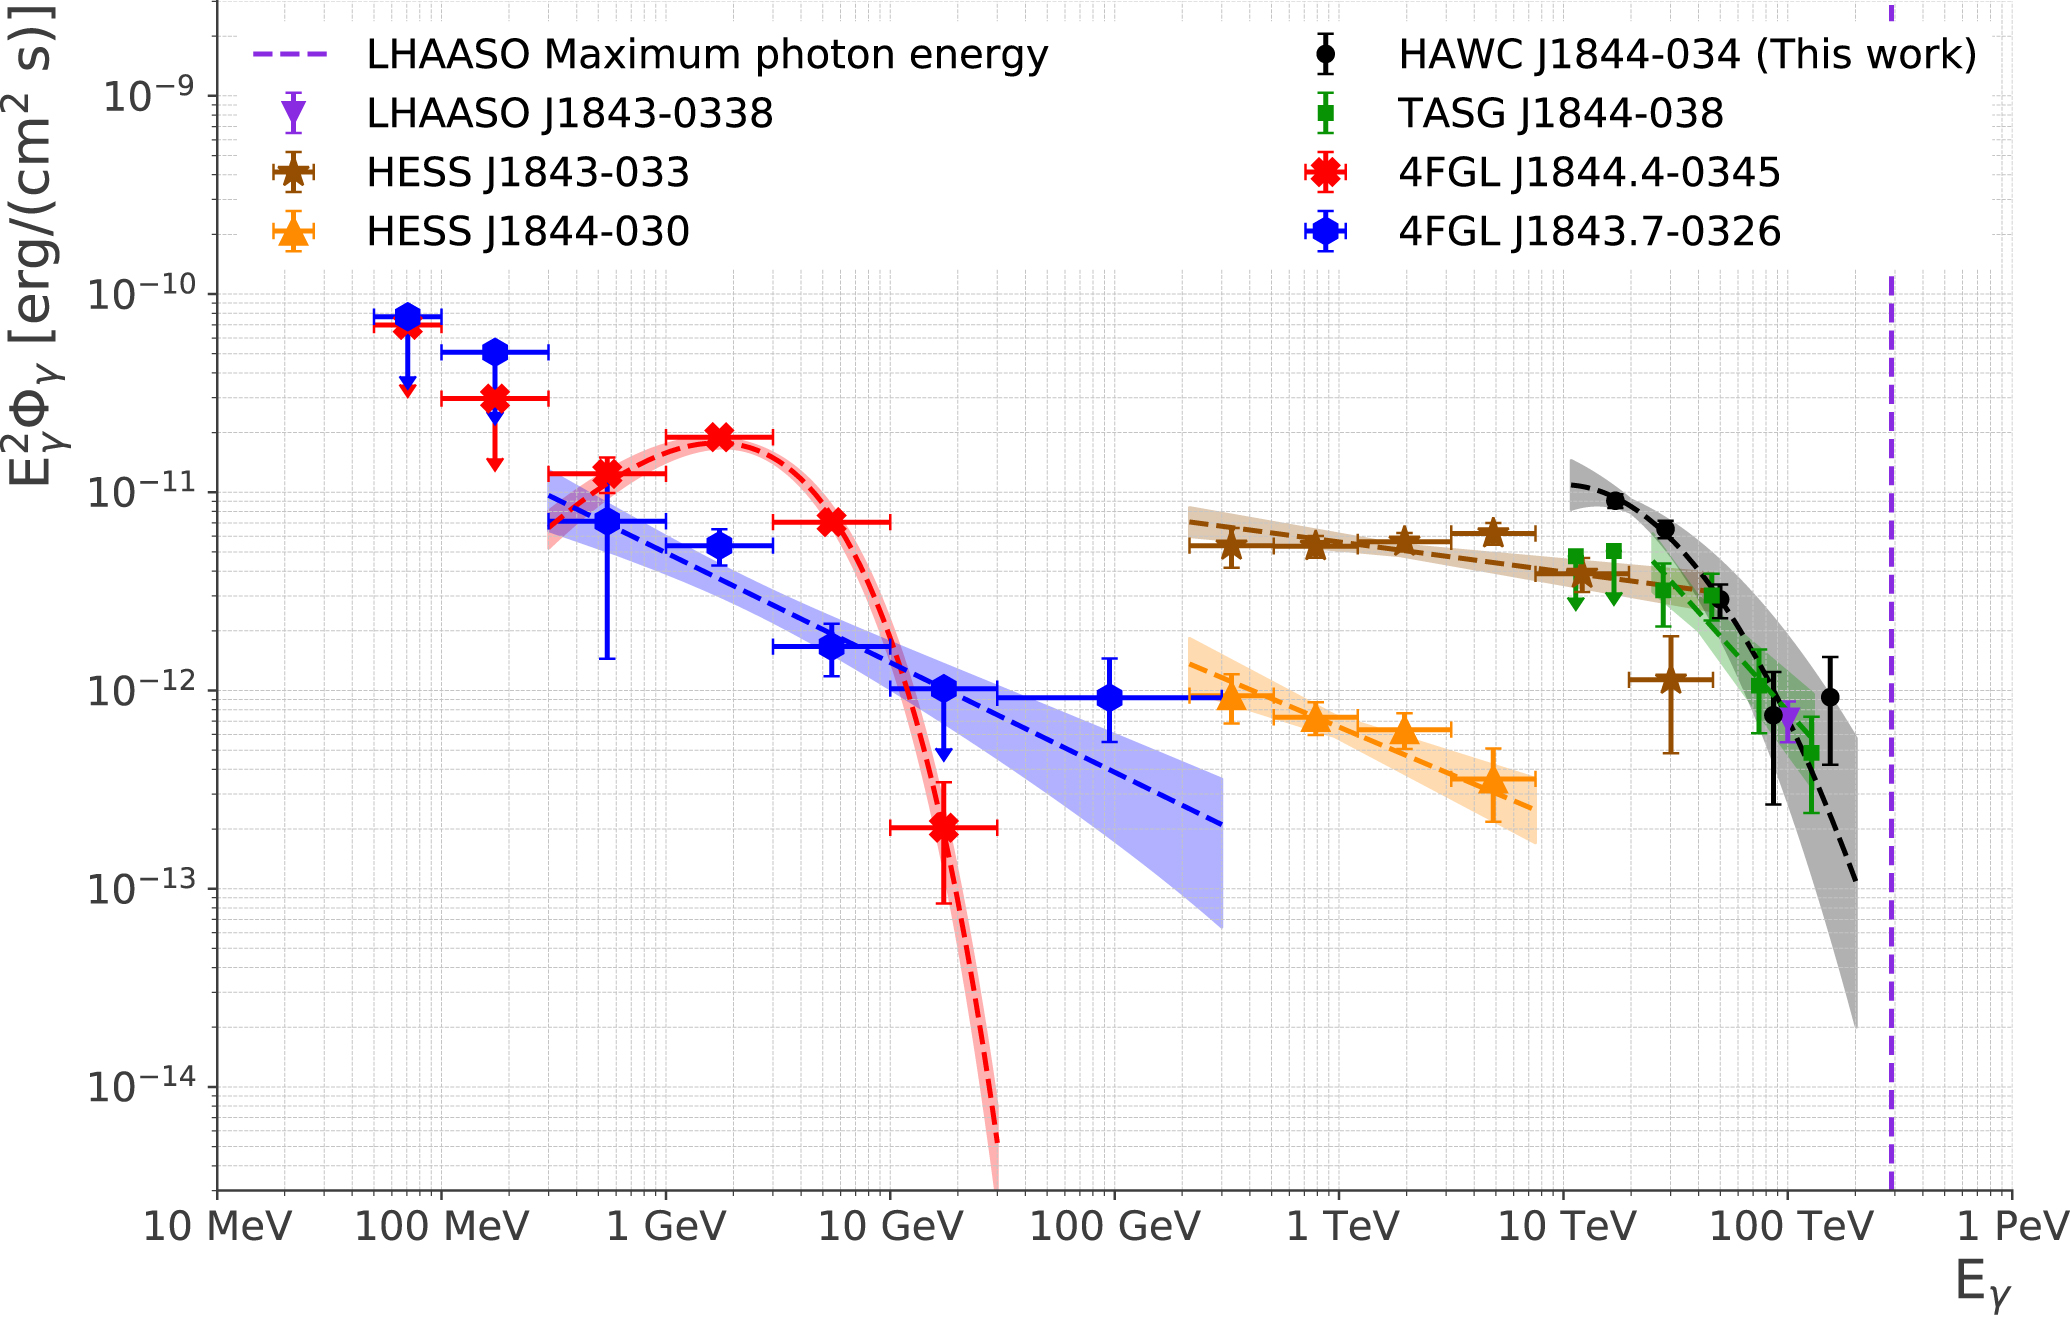
Standard image High-resolution imageFigure 7 shows the spectra of the GeV to TeV γ-ray sources within the extension of HAWC J1844−034 as shown in Figure 6. HESS J1843−033 has been considered as the counterpart of TASG J1844−038 (Amenomori et al. 2022). The observed spectrum of HESS J1843−033 (brown) has a similar amplitude to that of HAWC J1844−034 (black) and TASG J1844−038 (green), so it has also been assumed as the sub-TeV counterpart in our analysis. The flux points of HESS J1844−030 (orange) and 4FGL J1843.7−0326 (blue) are smoothly connected, so it is likely that these two observations come from the same source. However, it is difficult to find an association of these two sources with HAWC J1844−034 (as well as TASG J1844−038 and LHAASO J1843−0338) because HESS J1844−030 has not been observed with significant emission at energies above 10 TeV (H.E.S.S. Collaboration et al. 2018). The spectrum of 4FGL J1844.4−0345 (red) has been found to follow a log parabolic shape in the GeV range and cuts off sharply; it is not detected above 100 GeV from Fermi-LAT (Abdollahi et al. 2020). Therefore, it is difficult to identify a source in the GeV energies that shows a clear association with HAWC J1844−034 at this time.

Figure 7. Collection of spectra for γ-ray sources within the vicinity of HAWC J1844−034. The results have been collected from Fermi-LAT (Abdollahi et al. 2020), H.E.S.S. (H.E.S.S. Collaboration et al. 2018), Tibet AS-Gamma (Amenomori et al. 2022), LHAASO (Cao et al. 2021), and HAWC.
Download figure:
Standard image High-resolution imageThe two scenarios have been fitted with the Naima framework using only the TeV γ-ray flux data from HESS J1843−033 (H.E.S.S. Collaboration et al. 2018), TASG J1844−038 (Amenomori et al. 2022), LHAASO J1843−0338 (Cao et al. 2021), and HAWC J1844−034 (this work). The particle spectra of each scenario have been assumed to be a power law with an exponential cutoff with a pivot energy of 7 TeV,

where ρP(EP) is the spectrum of the accelerated particles, either electrons or protons; EP is energy of the accelerated particles; and  is the value of ρP(EP) at a distance of 1 kpc and pivot energy of 7 TeV.
Table 4 shows the best-fit values for the proton spectrum of the hadronic scenario and the electron spectrum of the leptonic scenario. The three free parameters of Equation (6) are listed for each scenario in the table. The obtained spectral index of 1.56 for the hadronic scenario may seem hard considering other hadronic spectra in general. However, hadronic scenarios with such extreme spectral indices are discussed in some cases (Abdalla et al. 2021). The best-fit cutoff energy for the hadronic scenario at 169 TeV is too low for HAWC J1844−034 to be defined as a PeVatron. Note that the particle spectra have been fitted while assuming that HAWC J1844−034 is located at a unit distance of 1 kpc, since the exact counterpart source has not been identified. The source distance is later accounted for with a known source distance in Section 5 when we try to identify a counterpart source.
Table 4. Best-fit Parameters for the Hadronic and Leptonic Scenarios
| Hadronic Scenario | Leptonic Scenario | |
|---|---|---|
 [1/eV] [1/eV] |

|

|
| ΓP |

|

|
| Ec,P [TeV] |

|

|
| BIC | 85.9 | 84.4 |
Note. Here  is the normalization at a source distance of 1 kpc, ΓP is the spectral index, and Ec,P is the cutoff energy.
Download table as: ASCIITypeset image
In Figure 8, we have the data points from LHAASO J1843−0338 (purple), HESS J1843−033 (brown), TASG J1844−038 (green), and HAWC J1844−034 (black). The dashed purple vertical line is the maximum photon energy as observed by LHAASO on this source. The γ-ray spectra obtained from fitting the data points with the Naima framework are presented as blue and red lines for the leptonic and hadronic scenarios, respectively, with their statistical uncertainties shown as lighter bands. The overall trends of the spectra are very similar at energies below 100 TeV. At higher energies, the two spectra start to diverge as the leptonic spectrum cuts off at lower energies. From the Naima fit, the leptonic model is slightly more favorable than the hadronic model with a difference in BIC of 1.5.

Figure 8. Spectral distribution plot of the best-fit leptonic (blue) and hadronic (red) scenarios that have been fitted using the TeV γ-ray flux points speculated to have the same original source (H.E.S.S. Collaboration et al. 2018; Cao et al. 2021; Amenomori et al. 2022). The error bands indicate statistical errors.
Download figure:
Standard image High-resolution image5. Origin of the γ-Ray Emission of HAWC J1844−034
In this section, we analyze nearby pulsars and an SNR to gauge their potential as counterparts to HAWC J1844−034.
5.1. Pulsars
There are three pulsars that are within the best-fit size of HAWC J1844−034: PSR J1843−0355, PSR J1844−0310, and PSR J1844−0346 (Manchester et al. 2005). Also, PSR J1841−0345 is suggested as a possible counterpart source to LHAASO J1843−0338 in de Oña Wilhelmi et al. (2022). Therefore, we have examined each of these four pulsars as a candidate counterpart source to HAWC J1844−034. The properties of the pulsars used in the analysis have been referenced from the ATNF catalog (Manchester et al. 2005) and listed in Table 5.
Table 5. Various Properties of the Four Pulsars Found Near HAWC J1844−034 Used for Calculations (Manchester et al. 2005; Devin et al. 2021)
| Spin-down | Angular | γ-Ray | ||||
|---|---|---|---|---|---|---|
| Pulsar | R.A. | Decl. | Power | Distance | Distance | Luminosity |
| α (deg) | δ (deg) |
 (erg s−1) (erg s−1) | dsrc (kpc) | Δ (deg) |
 (erg s−1) (erg s−1) | |
| PSR J1841−0345 | 280.4112 | −3.8118 | 2.7 × 1035 | 3.776 | 0.63 |

|
| PSR J1844−0346 | 281.13704 | −3.7752 | 4.2 × 1036 | 4.3 | 0.18 |

|
| PSR J1843−0355 | 280.77776 | −3.93239 | 1.77 × 1034 | 5.798 | 0.38 |

|
| PSR J1844−0310 | 281.1895 | −3.1770 | 2.79 × 1033 | 5.973 | 0.49 |

|
Note. Angular distance is the distance from the center of HAWC J1844−034.
Download table as: ASCIITypeset image
In Table 5, we have computed a number of parameters of the four pulsars for comparison. Here  is the γ-ray luminosity estimated from integrating the spectrum of HAWC J1844−034 in Figure 4 as

The angular distance is the distance to each pulsar from the best-fit location of HAWC J1844−034.
Assuming that the spin-down of a pulsar powers the acceleration of the particles that then produce TeV γ-rays, the γ-ray luminosity is required to be less than the spin-down luminosity of a pulsar to be a possible counterpart source (Cataldo et al. 2020; de Oña Wilhelmi et al. 2022; Albert et al. 2023). Objects PSR J1843−0355 and PSR J1844−0310 both have spin-down powers that are lower than their γ-ray luminosities if they are associated with HAWC J1844−034. Therefore, they are disfavored to be the counterpart source of HAWC J1844−034.
Object PSR J1841−0345 is located 0.63° away from HAWC J1844−034, which is outside of the extension of HAWC J1844−034. Therefore, we rule out PSR J1841−0345 as a counterpart source candidate.
Finally, PSR J1844−0346 has a spin-down power that is approximately two orders of magnitude higher than the γ-ray luminosity. Also, it is located closest to the best-fit positions of HAWC J1844−034, HESS J1843−033, and TASG J1844−038 with angular distances of 0.18°, 0.28°, and 0.05°, respectively. The angular resolutions for HAWC, H.E.S.S., and Tibet AS-Gamma are 0.1°–0.6° for ≥10 TeV, ∼0.08° for ≥0.2 TeV, and ∼0.28° for 100 TeV, respectively (H.E.S.S. Collaboration et al. 2018; Abeysekara et al. 2019; Amenomori et al. 2022). Here the angular resolution of H.E.S.S. is smaller than the angular distance between HESS J1843−033 and PSR J1844−0346. However, HESS J1843−033 is an extended source with a best-fit size of 0.24° (Table 3). Furthermore, although the angular distance of 0.18° is larger than the positional uncertainties given in Table 3, the 0.18° separation is contained within the 0.48° extension of HAWC J1844−034. Therefore, of the four pulsars found near the region of HAWC J1844−034, PSR J1844−0346 is considered to be the most favorable candidate according to this work.
5.2. SNR G28.6−0.1
The shell-type SNR G28.6−0.1 (Bamba et al. 2001) is another candidate counterpart source to HAWC J1844−034. It is located at an angular distance of 0.28° from HAWC J1844−034, which is within the best-fit size of HAWC J1844−034. It was suggested to be a potential candidate counterpart source for HESS J1843−033 with VHE γ-rays originating from leptonic processes due to the observed synchrotron emission (Bamba et al. 2001; Devin et al. 2021). Assuming that SNR G28.6−0.1 is responsible for the observed VHE γ-rays by using the distance to SNR G28.6−0.1 of 9.6 ± 0.3 kpc (Ranasinghe & Leahy 2018), the γ-ray luminosity and proton density can be estimated as presented in Table 6.
Table 6. Computed Values for SNR G28.6−0.1
| Hadronic | Leptonic | ||||||
|---|---|---|---|---|---|---|---|
 (erg s−1) (erg s−1) | nh,9.6 kpc (cm−3) | Wp (erg) |
 (1/eV) (1/eV) | Γe | Ec,e (TeV) | B (μG) | We (erg) |

| 46 |

|

|

|

|

|

|
Notes. The best-fit parameters for the proton spectrum are the same as in Table 4. The best-fit parameters for the electron spectrum ( , Γe
, Ec,e
) have been refitted at 9.6 kpc to include the synchrotron emission spectrum.
, Γe
, Ec,e
) have been refitted at 9.6 kpc to include the synchrotron emission spectrum.
Download table as: ASCIITypeset image
We have calculated the energy budgets corresponding to each scenario at the known distance of SNR G28.6−0.1 to compare between leptonic and hadronic scenarios for the SNR. The proton density in the ambient gas of HAWC J1844−034,  , is required for the calculation. We use
  as the H i column density and
  as the H2 column density, collected from the HI4PI survey and FUGIN data, respectively, at the center of HAWC J1844−034 (Bekhti et al. 2016; Umemoto et al. 2017). The integration range of the radial velocity that corresponds to the location of SNR G28.6−0.1 that has been used to calculate the column densities is found to be 77–88 km s−1 based on Reid et al. (2019). Assuming that the density is spherically uniform within the best-fit size of HAWC J1844−034, the proton density of the ambient gas can be estimated as

where Θ is the total number of protons, V is the spherical volume of the emission region, and 0 48π/180° is the best-fit size of HAWC J1844−034 in radians. The estimated proton density for SNR G28.6−0.1 is ∼46 cm−3.
The energy budget for each scenario is computed by integrating the particle spectrum ρP(EP) provided in Table 4,

where  and
and  are the minimum and maximum energies of the particle spectrum, respectively.
As for the hadronic scenario, we have used 1.22 GeV for the minimum proton energy  , since the inclusive π0 cross section of a proton–proton collision starts to become meaningful at energies above 1.22 GeV (see Kafexhiu et al. 2014, Section 2.B.2). For the maximum proton energy
  , we have used 2.6 PeV, which is 10 times the maximum photon energy observed by LHAASO (Cao et al. 2021).
For the modeling of SNR G28.6−0.1, radio and infrared data are available, as well as the γ-ray data. Hence, the Naima framework has computed both the synchrotron and inverse Compton scattering spectrum for the leptonic scenario (Lee et al. 2019; Castelletti et al. 2021). Despite the near-infrared observations at Lee et al. (2019), the near-infrared photons are not considered as seed photons for inverse Compton scattering because photons with energies higher than the CMB are suppressed via the Klein–Nishina effect (Moderski et al. 2005). With the additional data points, we are able to model and fit the synchrotron regime, as well as the inverse Compton scattering regime for the leptonic scenario. Table 6 shows the best-fit values of the newly defined leptonic scenario. Note that because we use radio data to fit the leptonic model for SNR G28.6−0.1, we have extended  to 10 MeV. Here we assume
  TeV, which is calculated in Khangulyan et al. (2014) and de Oña Wilhelmi et al. (2022) based on the maximum photon energy of LHAASO J1843−0338.
The obtained magnetic field strength of  from the Naima fit is comparable to that of the average Galactic magnetic field strength of 2–3 μG (Longair 2011). The hadronic energy budget has been derived from the proton spectrum in Table 4, since the hadronic model has been fitted with only the γ-ray data.
The photon spectra obtained from the best-fit scenarios of SNR G28.6−0.1 are presented in Figure 9. The γ-ray data points are same as those of Figure 8. The pink and orange data points are from radio and infrared observations, respectively (Lee et al. 2019; Castelletti et al. 2021), used for the modeling of synchrotron emission. The final leptonic and hadronic spectra for SNR G28.6−0.1 as a counterpart to HAWC J1844−034 are displayed as blue and red lines, respectively. The leptonic spectrum (solid) consists of two subspectra, synchrotron emission (dashed–dotted) and inverse Compton scattering (dotted). The synchrotron and inverse Compton scattering spectra have been fitted simultaneously while assuming that a single population of electrons is responsible for the production of both emissions.

Figure 9. Spectral distribution plot with the best-fit leptonic (blue) and hadronic (red) scenarios for SNR G28.6−0.1.
Download figure:
Standard image High-resolution image
We have not used any X-ray data in the fit because the reported X-ray flux values for SNR G28.6−0.1 from Bamba et al. (2001) and Ueno et al. (2003) do not contain any flux uncertainties. Since the X-ray band is located in the keV cutoff region of the synchrotron emission, having the X-ray data in the fit model can alter the spectral break parameter and directly influence the spectral break of the inverse Compton scattering as well. Therefore, incorporating reliable X-ray data should help us obtain a more complete understanding of SNR G28.6−0.1 in the future.
The typical energy of a Type Ia supernova explosion is expected to reach ∼1051 erg (Khokhlov et al. 1993). According to our fitted model, the energy budget for the leptonic scenario is ∼30% of the typical explosion energy. As for the hadronic scenario, the energy budget is estimated to be ∼2% of the explosion energy, which is more than sufficient (Tatischeff 2008). Furthermore, from Amenomori et al. (2022), the diffusion timescale for protons can be estimated using

where χ is the factor of diffusion suppression, and Rsys is the radius of the emission region. For the calculation, a χ of 0.1 and B of 10 μG are assumed (Amenomori et al. 2022). Using Rsys = (048 π
dsrc)/180° ∼ 80 pc and Ep
= 169 TeV (cutoff energy from the best-fit proton spectrum), we can obtain a τdiff of ∼5 kyr, which is indeed smaller than the known age of SNR G28.6−0.1 of 19 kyr (Ranasinghe & Leahy 2018).
6. Conclusion
In this work, the previous eHWC J1842−035 region has been thoroughly studied with an improved data set based on a systematic approach that precisely models the region. The best-fit model of the region includes three sources within the ROI. Of the three sources, HAWC J1844−034 has been found to have the highest TS with the best-fit location of (α, δ) = ( ) and a best-fit extension of
  . The highest γ-ray photon energy of HAWC J1844−034 is measured at 175 TeV with a differential flux of
  (TeV cm2 s)−1 at 20 TeV. By increasing the statistics from 1039 to 1910 days and lowering the energy threshold from 56 to 17.8 TeV, HAWC J1844−034 could be studied in great depth.
We have confirmed that HAWC J1844−034 has spectral and spatial coherence with the previous multi-TeV observations, LHAASO J1843−0338 and TASG J1844−038. The most likely sub-TeV counterpart has been determined to be HESS J1843−033, which has a similar flux magnitude to HAWC J1844−034. There is no plausible GeV counterpart for HAWC J1844−034 at this time.
We have fitted particle spectra based on two scenarios to find the origin of the γ-ray emission from HAWC J1844−034. The hadronic scenario shows the proton cutoff region at ∼169 TeV, so classifying HAWC J1844−034 as a PeVatron would be challenging.
Furthermore, to identify the nature of HAWC J1844−034, we have examined four nearby pulsars and an SNR. We have found PSR J1844−0346 to be the most favorable candidate among the nearby pulsars, since it is the only pulsar that satisfies both the spin-down power budget and having the pulsar contained within the extension of HAWC J1844−034.
Another potential counterpart source that has spatial coherence with HAWC J1844−034 is SNR G28.6−0.1, since it is also located within the extension of HAWC J1844−034. For the hadronic case of SNR G28.6−0.1, the diffusion timescale of the protons is reasonable when compared with the estimated age of the SNR, and it has a plausible energy budget to be a counterpart of HAWC J1844−034. The leptonic scenario is also viable for SNR G28.6−0.1. It would require ∼30% of the total explosion energy used as the acceleration of particles.
Acknowledgments
We acknowledge support from the US National Science Foundation (NSF); the US Department of Energy Office of High-Energy Physics; the Laboratory Directed Research and Development (LDRD) program of Los Alamos National Laboratory; Consejo Nacional de Ciencia y Tecnología (CONACyT), México, grant Nos. 271051, 232656, 260378, 179588, 254964, 258865, 243290, 132197, A1-S-46288, A1-S-22784, CF-2023-I-645, cátedras 873, 1563, 341, 323, Red HAWC, México; DGAPA-UNAM grant Nos. IG101323, IN111716-3, IN111419, IA102019, IN106521, IN110621, IN110521, and IN102223; VIEP-BUAP; PIFI 2012, 2013, PROFOCIE 2014, 2015; the University of Wisconsin Alumni Research Foundation; the Institute of Geophysics, Planetary Physics, and Signatures at Los Alamos National Laboratory; Polish Science Centre grant DEC-2017/27/B/ST9/02272; Coordinación de la Investigación Científica de la Universidad Michoacana; Royal Society Newton Advanced Fellowship 180385; Generalitat Valenciana, grant CIDEGENT/2018/034; The Program Management Unit for Human Resources & Institutional Development, Research and Innovation, NXPO (grant No. B16F630069); Coordinación General Académica e Innovación (CGAI-UdeG), PRODEP-SEP UDG-CA-499; the Institute of Cosmic Ray Research (ICRR), University of Tokyo; and the National Research Foundation of Korea, grant No. NRF-2021R1A2C1094974. H.F. acknowledges support by NASA under award number 80GSFC21M0002. We also acknowledge the significant contributions over many years of Stefan Westerhoff, Gaurang Yodh, and Arnulfo Zepeda Dominguez, all deceased members of the HAWC collaboration. Thanks to Scott Delay, Luciano Díaz, and Eduardo Murrieta for technical support.
Footnotes
- 30
- 31
- 32
- 33