


Abstract
We report on an Atacama Large Millimeter/submillimeter Array study of the Class I or II intermediate-mass protostar DK Cha in the Chamaeleon II region. The 12CO(J = 2–1) images have an angular resolution of ∼1'' (∼250 au) and show high-velocity blueshifted (≳70 km s−1) and redshifted (≳50 km s−1) emissions, which have 3000 au scale crescent-shaped structures around the protostellar disk traced in the 1.3 mm continuum. Because the high-velocity components of the CO emission are associated with the protostar, we concluded that the emission traces the pole-on outflow. The blueshifted outflow lobe has a clear layered velocity gradient with a higher-velocity component located on the inner side of the crescent shape, which can be explained by a model of an outflow with a higher velocity in the inner radii. Based on the directly driven outflow scenario, we estimated the driving radii from the observed outflow velocities and found that the driving region extends over 2 orders of magnitude. The 13CO emission traces a complex envelope structure with arc-like substructures with lengths of ∼1000 au. We identified the arc-like structures as streamers because they appear to be connected to a rotating infalling envelope. DK Cha is useful for understanding characteristics that are visible by looking at nearly face-on configurations of young protostellar systems, providing an alternative perspective for studying the star formation process.
Export citation and abstract BibTeX RIS

Original content from this work may be used under the terms of the Creative Commons Attribution 4.0 licence. Any further distribution of this work must maintain attribution to the author(s) and the title of the work, journal citation and DOI.
1. Introduction
Protostars and their surrounding disks are formed through the gravitational collapse of dense molecular cloud cores. Protostars eventually evolve into main-sequence stars via the main accretion phase, which is the most dynamic stage in the star formation process due to the presence of active gas inflow and ejection. The balance between the two processes (gas inflow and ejection) directly determines the mass of protostars and disks, and thus observational investigations of the inflow and outflow motions are fundamental subjects in star formation studies. Because molecular outflows play the most significant role in transporting both the gas mass and a large amount of angular momentum originating from the parental molecular cloud cores, it is important to observe the detailed structure of outflows to verify star formation theory.
Molecular outflows are universally observed around protostars across the Local Group of galaxies (Tokuda et al. 2022 and references therein), and their physical characteristics, such as momentum and force, are diverse and somewhat depend on the protostellar luminosity (e.g., Bontemps et al. 1996; Beuther et al. 2002; Wu et al. 2004). Outflows interact with the surrounding gas from the parental core scale to the molecular cloud scale, and their impact on star-forming regions has been discussed (e.g., Lada 1985; Fukui et al. 1993; Matzner & McKee 2000; Mac Low & Klessen 2004; Arce et al. 2007; Pudritz & Ray 2019). According to recent high-resolution millimeter and submillimeter observations toward the solar neighborhood targets, a common feature is relatively low-velocity flows with a wide opening angle. In addition, a few sources exhibit high-velocity (∼100 km s−1) collimated flows (e.g., Bachiller 1996; Hirano et al. 2010; Matsushita et al. 2019). Magnetohydrodynamic simulations predict that, unlike the classical jet-entrainment scenario, a magnetocentrifugal force drives the outflow directly from the rotating circumstellar disk for the whole range of protostellar masses (e.g., Machida & Hosokawa 2013; Matsushita et al. 2017; Commerçon et al. 2022). Some observations have reported strong evidence for the directly driven scenario (e.g., Bjerkeli et al. 2016; Hirota et al. 2017; Matsushita et al. 2019). Although these observations provide excellent evidence to constrain the outflow driving mechanism, their projected characteristics in the plane of the sky are highly sensitive to various factors, such as the evolutionary stage, the initial conditions of gravitational collapse (e.g., Hirano et al. 2020; Machida & Hosokawa 2020; Tsukamoto et al. 2020), and the inclination angles for the targets. Hence, a case-study characterization toward specific targets is still needed to further understand the outflow phenomena in the main accretion phase.
There is a lack of detailed studies observing outflows driven from protostellar systems with small inclination angles (hereafter pole-on outflows). Thus, it is crucial to observe nearly face-on systems because this allows us to look into regions close to the protostars (e.g., Motogi et al. 2013, 2016, 2017, 2019; Fernandez-Lopez et al. 2020). More massive protostars should be suitable targets for such observations because they have larger disks and more powerful outflows (e.g., Wu et al. 2004). In particular, the outflows appearing around more massive stars are larger and have a fairly wide range of velocity (e.g., Matsushita et al. 2017). However, there are only a few high-mass stars within a few hundred parsecs of the Sun. It is thus reasonable to observe intermediate-mass protostellar systems in the solar neighborhood to spatially resolve pole-on outflows.
Recently, highly complex gas structures around protostars have been revealed by Atacama Large Millimeter/submillimeter Array (ALMA) high-resolution studies. Molecular line observations reported asymmetric, arc-like gas structures around low-mass protostellar sources (e.g., Tokuda et al. 2014, 2018) owing to complex gas dynamics. Although the origin of such peculiar structures is still under debate and depends from source to source, one of the interpretations is a nonaxisymmetric accretion flow onto protostars, called "streamers" (Pineda et al. 2022 and references therein). Okoda et al. (2021) discovered a secondary outflow with a direction perpendicular to the main outflow around a single Class 0 protostar IRAS 15398-3359. These observations indicate that a classical picture does not apply to some protostellar systems. Thus, in addition to investigating outflow activities, characterizing complex envelope structures can also be an important approach to exploring the diversity of star formation processes.
IRAS 12496-7650, also known as the Herbig Ae star DK Cha, is the most luminous IRAS source in the Chamaeleon II star-forming region (Hughes et al. 1989, 1991). Early observations discovered a molecular outflow associated with DK Cha. A single-dish study by Knee (1992) reported a very high-velocity blueshifted (∣vLSR − vsys∣ ∼ 70 km s−1) 12CO(J = 1–0) emission, which is most likely an outflow component from protostellar objects. van Kempen et al. (2009), Yıldız et al. (2015) revealed an overlap of outflow between blueshifted and redshifted lobes by the Atacama Pathfinder EXperiment (APEX) observations with a beam size of ≳8'', and concluded that the system is in a nearly face-on configuration. However, the detailed structure of the outflow is unclear due to the lack of angular resolution in previous studies. As described in Sections 2–4, we attempted to spatially resolve the outflow based on ALMA archival data for DK Cha, but the high-resolution view provided peculiar and complex gas structures with an arc or crescent-shaped morphology in the high-velocity emission that forced us to reconsider the simple outflow interpretation.
In this paper, we report the results of our analysis of archival data from ALMA observations toward DK Cha. Section 2 describes the ALMA observations and data reduction. In Section 3, we present the results for continuum, 12CO(J = 2–1) and 13CO(J = 2–1) emissions. We discuss the interpretation of the oddly shaped outflow revealed by 12CO and the arc-like structures revealed by 13CO in Section 4. Our conclusions are presented in Section 5.
2. Observations and Target Descriptions
We used the ALMA archival data (project ID: 2019.1.01792.S), which were obtained in Cycle 7 in Band 6 (230 GHz, 1.3 mm). The project targeted 125 protostars in nearby star-forming regions. The observations toward our target DK Cha centered at (αICRS, δICRS) = (12h53m17 20,
20,  10
10 00) were carried out on 2019 October 30 and November 5, using the ALMA main array in its C43-3 configuration. Two spectral windows targeted 12CO and 13CO(J=2–1) with a frequency resolution of 61.035 kHz and bandwidths of 117 MHz (1920 channels) and 59 MHz (960 channels), respectively. Another spectral window was used for continuum observations with an aggregated bandwidth of 1.875 GHz.
The data were processed with the Common Astronomy Software Application (CASA) package (THE CASA TEAM et al. 2022) version 5.6.1-8. We used the tclean task in the imaging process with the multiscale deconvolver to recover the extended emission. We applied the natural weighting with an image grid of 013 and velocity resolutions of 0.5 km s−1. The synthesized beam size for both the continuum and 12CO was ∼11 × 08 ≃ 270 × 200 au at the distance of DK Cha (243.7 ± 22.0 pc; Gaia Collaboration et al. 2021). The (1σ) rms of the molecular line emission, 12CO(J = 2–1), and the continuum were 0.26 K at velocity resolutions of 0.5 km s−1and 2.1 mJy beam−1, respectively.
DK Cha has a protostellar mass of 1.4–2 M⊙ (Spezzi et al. 2008; Villenave et al. 2021), a bolometric luminosity of 24–35.4 L⊙ (Spezzi et al. 2008; van Kempen et al. 2010; Kristensen et al. 2012; Yang et al. 2018), a bolometric temperature of 569–592.0 K (Kristensen et al. 2012; Yang et al.2018), and a systemic velocity vsys of 2–4 km s−1(van Kempen et al. 2009; Kristensen et al. 2012; Yıldız et al. 2013). The evolutionary stage of this object is categorized as Class I or II (Alcalá et al. 2008; Wampfler et al. 2013; Yang et al. 2018).
3. Results
3.1. Continuum Source and 12CO High-velocity Emission
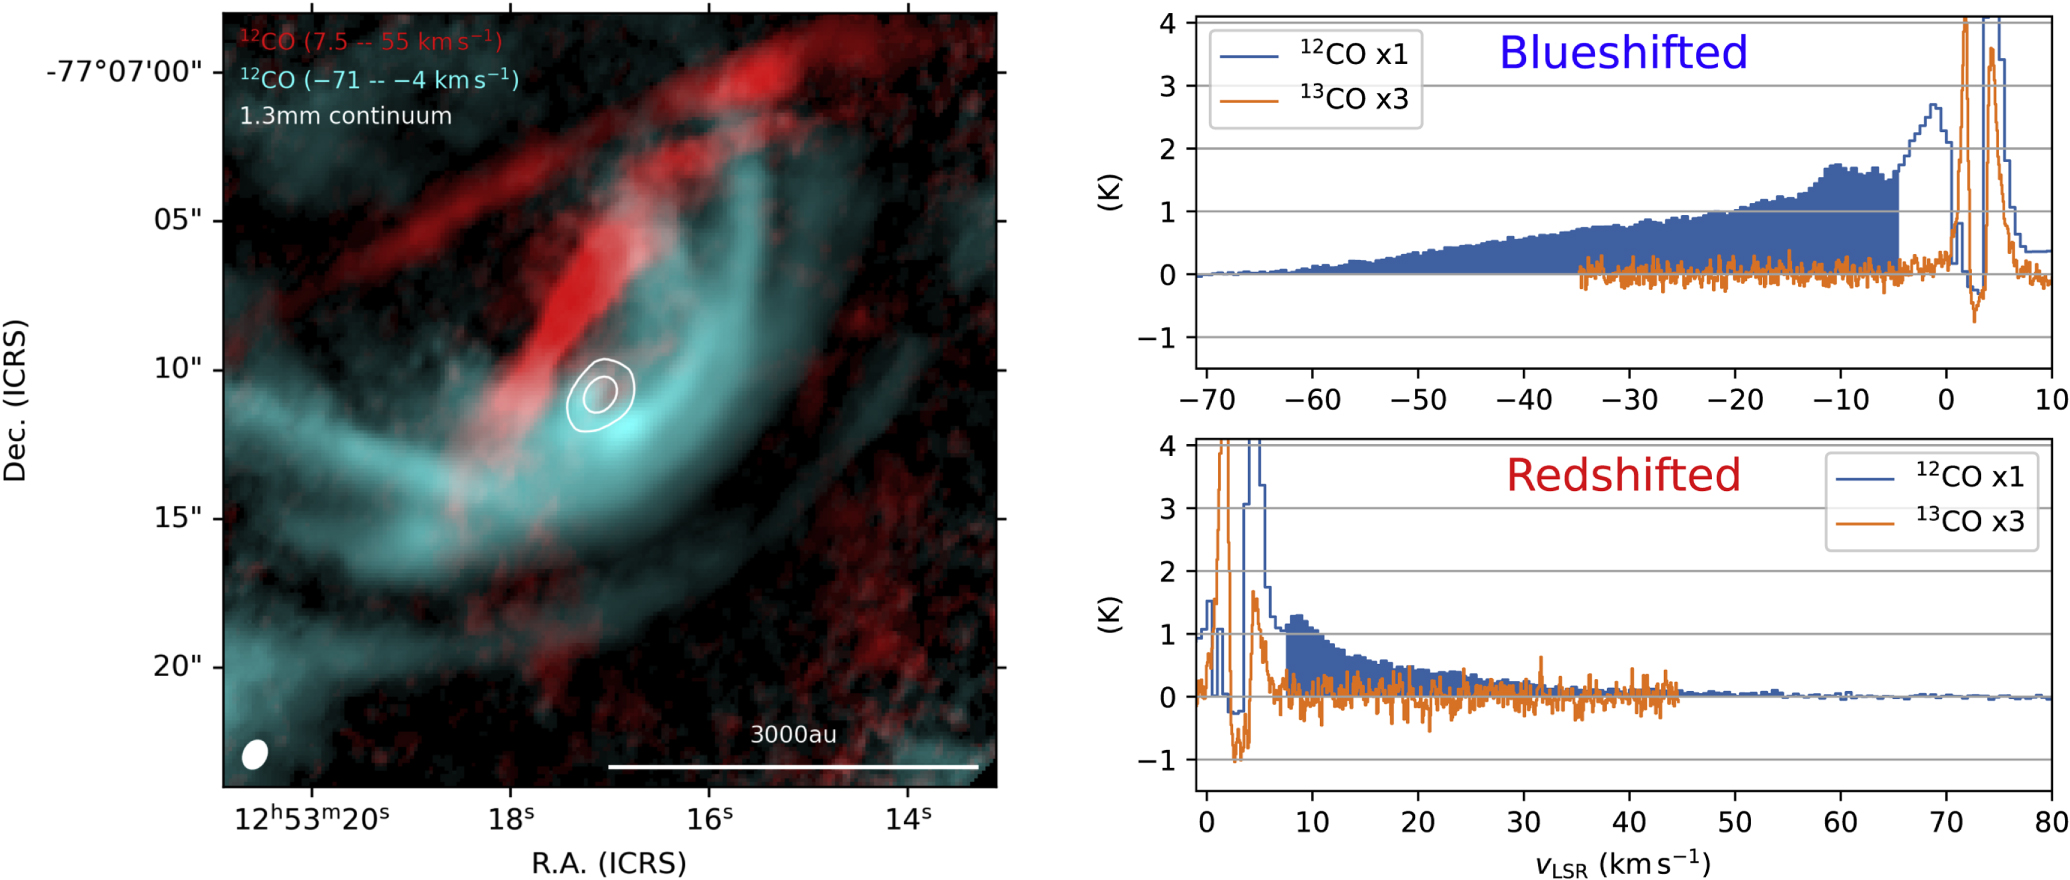
We show the 1.3 mm continuum and 12CO(J = 2–1) emission in this subsection. The white contours in the left panel of Figure 1 show the 1.3 mm continuum emission. The emitting region is compact, comparable to the beam size. A two-dimensional Gaussian fit to the image gave a deconvolved size of (503 ± 23 mas) × (306 ± 22 mas) and a position angle of 128 8 ± 53. The total flux is 562.4 ± 5.4 mJy. These values are consistent with those reported by Villenave et al. (2021), who used other ALMA archival data with a higher angular resolution of 051 × 028. The cyan and red colors represent the blueshifted and redshifted 12CO(J = 2–1) integrated intensity distributions, respectively. The right panels of Figure 1 show the average spectra of blueshifted (top) and redshifted (bottom) components. We defined the 12CO integration ranges of the maps as follows: the high-velocity sides are the velocity at which the 12CO emission is prominently detected judging from the averaged profiles, and we excluded the lower-velocity range around the systemic velocity of ∼3 km s−1(Yıldız et al. 2013) with our 13CO detection, likely containing the infalling envelope around the protostar (see Section 3.2). The blueshifted wing of the 12CO spectrum extends from < − 4 to −71 km s−1, and the redshifted component also has high-velocity emission (7.5–55 km s−1). The blueshifted components have arc-like structures with a size of several thousand astronomical units, and they surround the continuum source and have a stripe pattern. In particular, the arc-like structure close to the continuum source resembles a crescent moon. The redshifted components also show a similar stripe pattern.

Figure 1. Structure of DK Cha (IRAS 12496-7650) outflow revealed by ALMA. Left: blueshifted and redshifted 12CO integrated intensity distributions plotted with the 1.3 mm continuum emission. The cyan and red colors show the distributions of the blueshifted (−71–4 km s−1) and redshifted (7.5–55 km s−1) components, respectively. We used only emissions above 3σ for each pixel. The systemic velocity is ≃3 km s−1, which was determined by single-dish C18O observations (e.g., Yıldız et al. 2013). The white contours show the 1.3 mm continuum emission with 10σ and 100σ, where 1σ is the 2.1 mJy beam−1. The white ellipse at the lower left corner indicates the ALMA synthesized beam: 106 × 082 with a position angle of −27°. Right: average spectra of the >3σ blueshifted (top) and redshifted (bottom) components. The blue and orange lines represent the spectra of 12CO and 13CO, respectively. The 13CO intensity is multiplied by a factor of 3 for visualization purposes. The blue-filled areas indicate the integrated velocity ranges.
Download figure:
Standard image High-resolution imageTo investigate whether the crescent-shaped structure is an interferometric artifact, i.e., due to the missing flux, we compared our data with the data from a single-dish telescope. Using the 15 meter Swedish-ESO Submillimeter Telescope, Knee (1992) showed that the 12CO(J = 1–0) high-velocity emission is less than ∼0.1 K at a velocity of −20 km s−1 with an angular resolution of ∼40''. We measured the CO brightness temperature across the entire field of view (∼40'' × 40'') at −20 km s−1 in our data and confirmed that the brightness temperature in our data is consistent with that in Knee (1992). Thus, the CO crescent-shaped structure seen in the high-velocity component is not likely to be an overemphasized feature due to the interferometric effect. As mentioned in Section 1, recent high-resolution molecular gas observations have reported peculiar structures associated with protostars, such as streamers and dynamical interactions among multiple sources. They are mainly identified in dense gas tracers, e.g., C18O and HCO+, and their relative velocities are close to the systemic velocity within a few kilometers per second. However, we identified the stripe pattern composed of the multiple arc-like structures in the low-density tracer of 12CO, and the velocities are too high to be explained by accretion motion. We regard these components as outflow motions, as already suggested in the previous single-dish works (e.g., Knee 1992). The shape deviates significantly from the usually identified conical-type feature and can probably be attributed to the viewing angle effect (i.e., close to the face-on configuration). The interpretation and further discussion of the outflow will be given in Section 4.1.
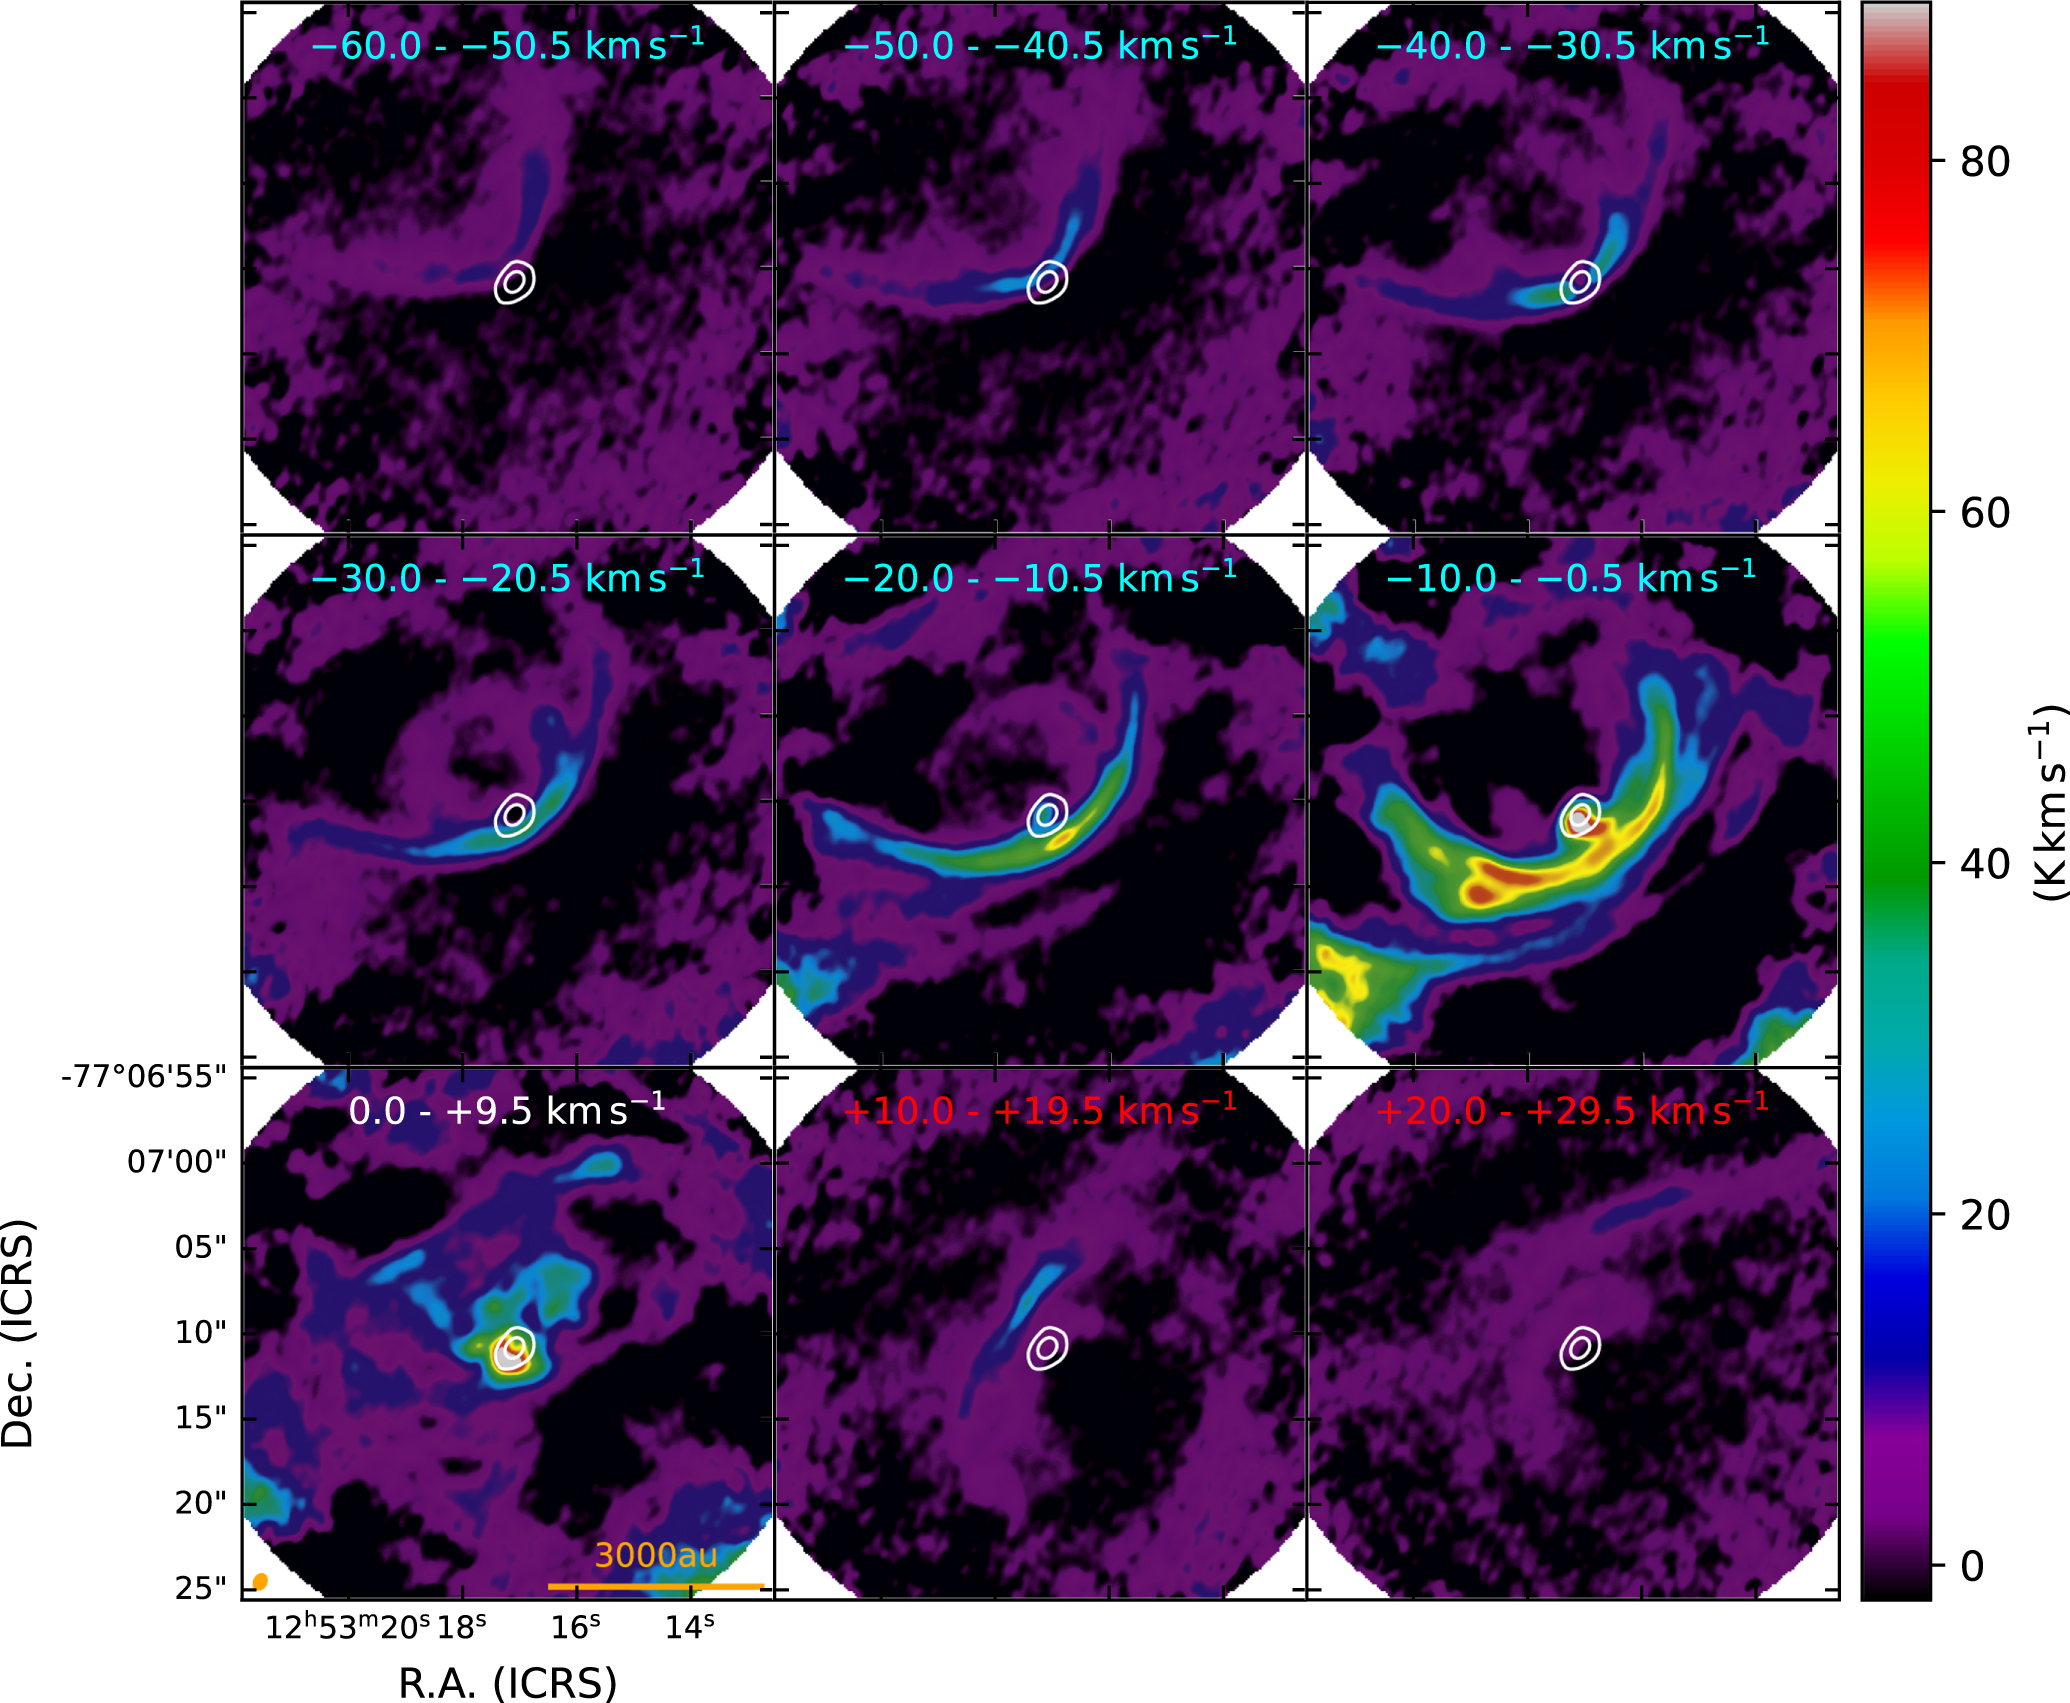
Figure 2 shows velocity-channel maps of the 12CO emission in the range −60–30 km s−1. The range of the velocity integration is 10 km s−1 for each channel. The blueshifted high-velocity component (≲ − 40 km s−1) has a crescent-shaped structure and is distributed slightly northeast of the continuum source. The blueshifted low-velocity component (−20 ≲ vLSR ≲ 0 km s−1) has a similar shape but surrounds the continuum source, and the emitting region seems to be more extended than the high-velocity component. The redshifted component (≳10 km s−1) has a similar arc-like structure to the blueshifted one, with the opposite orientation.

Figure 2. 12CO velocity-channel maps toward DK Cha. The color scale shows the integrated intensity for each channel. The integrated velocity ranges are given in the upper part of each panel; the blue and red texts indicate blueshifted and redshifted components, respectively (the white text indicates a velocity range that includes the systemic velocity). The white contours show the 1.3 mm continuum emission, and the orange ellipse in the lower left corner represents the synthesized beam size (same as Figure 1).
Download figure:
Standard image High-resolution imageTo verify the characteristics of the outflow described above in more detail, we generated 12CO moment 1 maps for the blueshifted and redshifted components (Figure 3). The figure clearly shows the two-dimensional velocity structure and/or gradient of the outflow, especially for the blueshifted component. A blueshifted compact high-velocity emission is located on the northeast side of the continuum source, while a more extended low-velocity emission is distributed on the opposite side, forming a layered velocity gradient across the crescent shape as a whole.
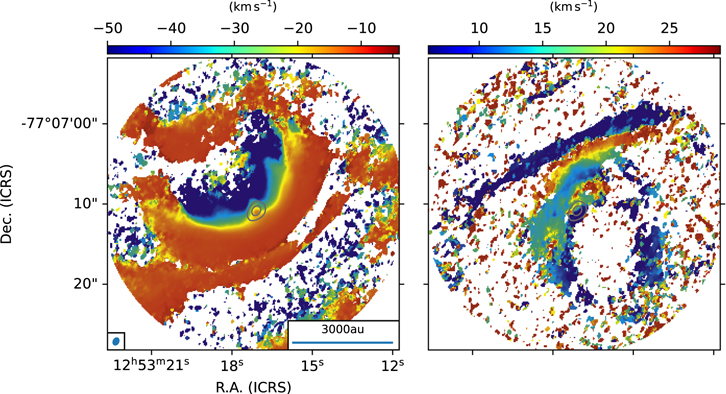
Figure 3. 12CO moment 1 maps toward DK Cha. Left: moment 1 map of the blueshifted components (color). The velocity range is −71–−4 km s−1. We used only emissions above 3σ for each pixel. The gray contours show the 1.3 mm continuum emission, and the blue ellipse at the lower left corner represents the synthesized beam size (same as Figure 1). Right: as for the left panel, but for the redshifted components (7.5–55 km s−1).
Download figure:
Standard image High-resolution imageOne of the densest regions (AV
∼ 20 mag and  cm−2) in the Chamaeleon II cloud is located in the vicinity of DK Cha (e.g., Alcalá et al. 2008; Alves de Oliveira et al. 2014). Compared to the blueshifted outflow, the velocity gradient of the redshifted outflow is not clear. In addition, the redshifted outflow velocity is slower than the blueshifted outflow velocity. Thus, DK Cha seems to be in front of the dense region, and the redshifted components could be decelerated due to the interaction with the surrounding dense gas.
3.2. 13CO Structures
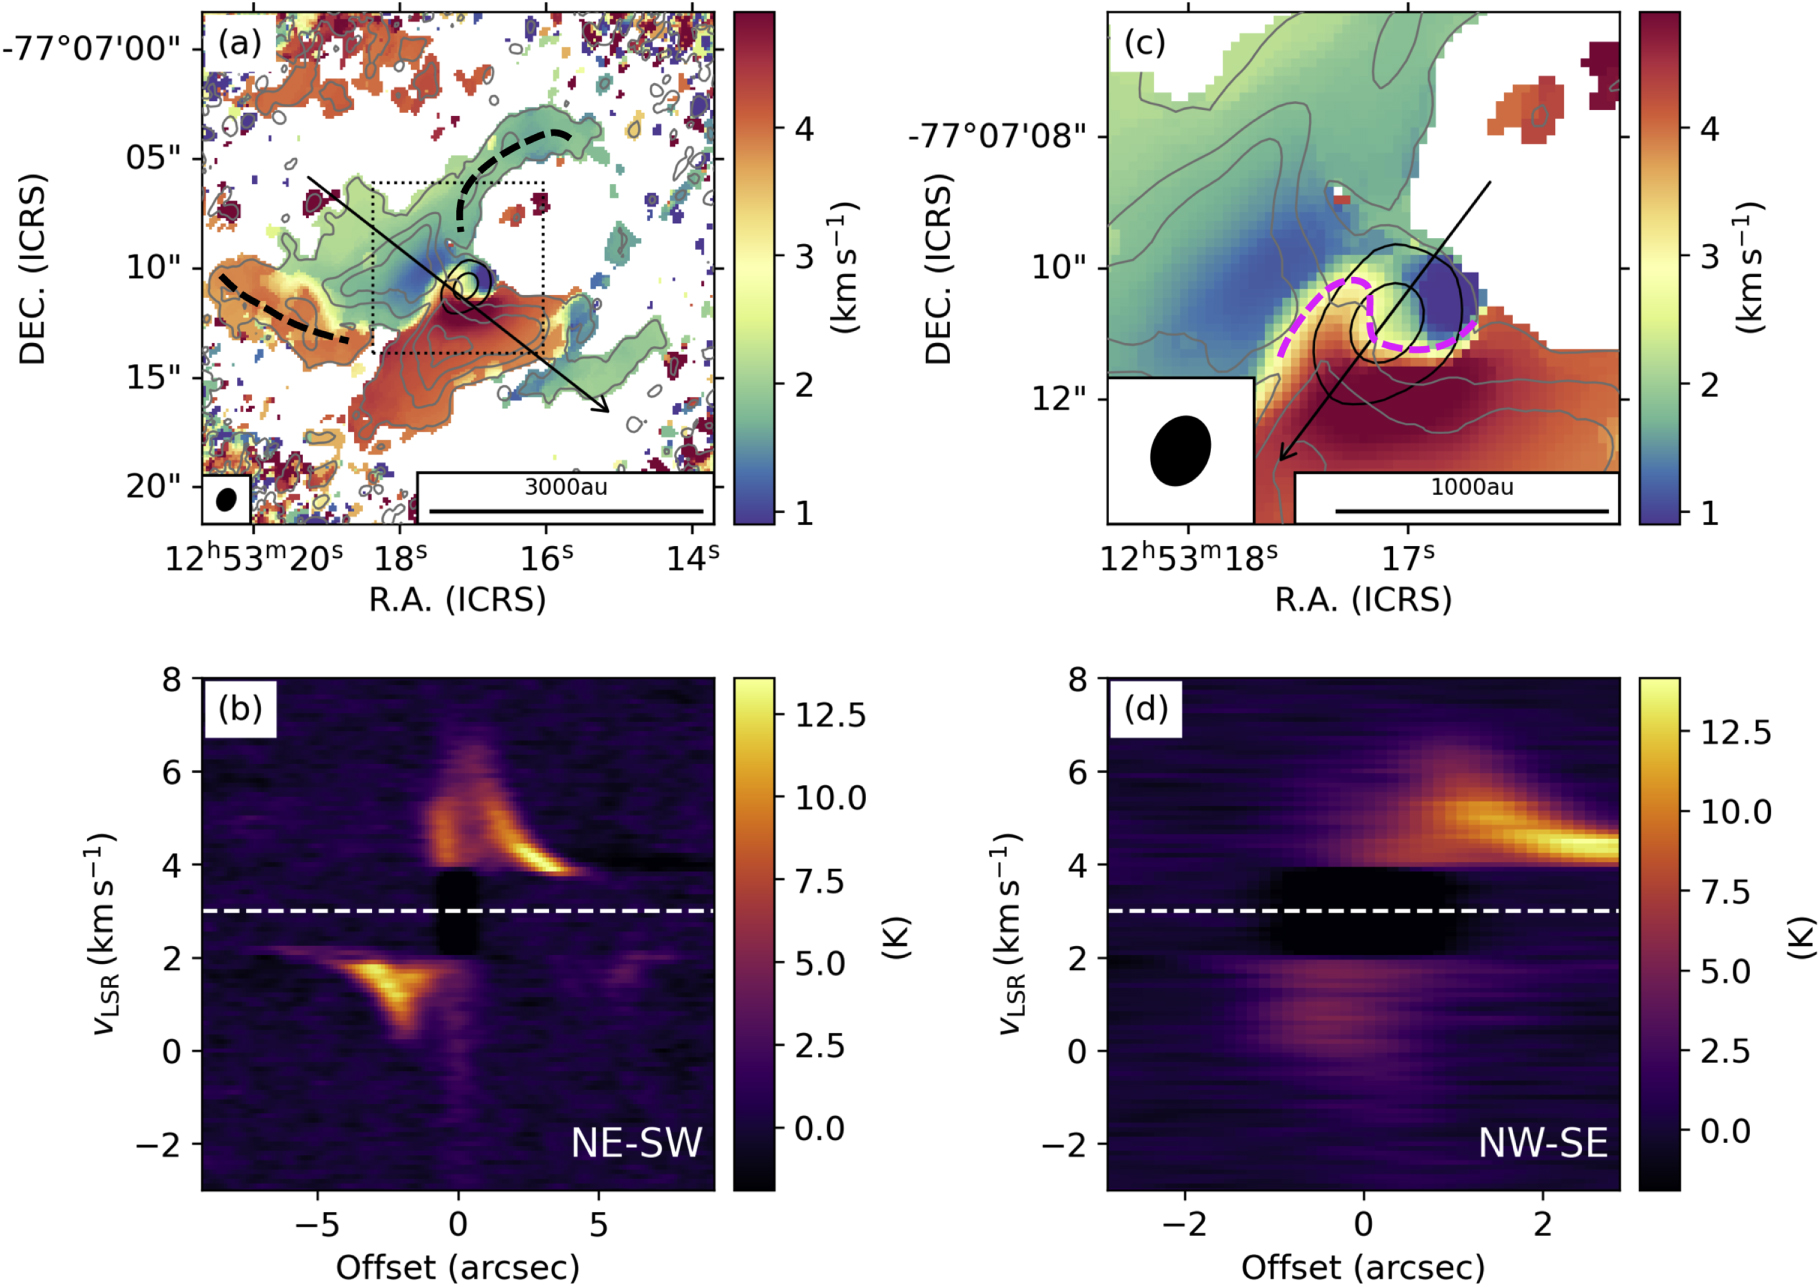
Figure 4 (a) plots the 13CO(J = 2–1) moment 1 and the overlaid peak temperature with the gray contours. The 13CO image shows an envelope structure with a spatial extent of a few thousand astronomical units. The strong emission on the northeast side is blueshifted (∼1.5 km s−1), and that on the southwest side is redshifted (∼4.5 km s−1). This direction is similar to the expected outflow axis. Figure 4 (b) shows a position–velocity (PV) diagram along that direction; the offset = 0 point corresponds to the position of the protostar. The relative velocity tends to be higher in regions closer to the central protostar within ±5'' (∼1200 au), indicating an infalling motion of the envelope gas (for details, see Section 4.3).

Figure 4. Spatial and velocity structures of 13CO emission around DK Cha observed by ALMA. (a) Moment 1 map of the >5σ emission (color). The gray contours show the 13CO peak temperature map with 10σ, 25σ, 40σ, and 55σ, where 1σ is 0.26 K. The black contours show the 1.3 mm continuum emission, and the black ellipse at the bottom left corner is the beam size (same as Figure 1). The black arrow indicates the direction of the PV diagram shown in panel (b). (b) PV diagram along the direction from northeast to southwest. The white dashed line indicates a velocity of 3 km s−1, which is the systemic velocity for DK Cha (e.g., Yıldız et al. 2013). The position with offset = 0 corresponds to the position of the protostar. (c) As for panel (a), but zoomed toward the continuum source. The black arrow indicates the direction of the PV diagram shown in panel (d). (d) As for panel (b), but for the direction from northwest to southeast.
Download figure:
Standard image High-resolution imageThe black dashed lines in Figure 4(a) show that the 13CO emission exhibits arc-like structures. The blueshifted (∼2 km s−1) and redshifted (∼4 km s−1) arcs extend to the northwest and northeast toward the continuum source and connect to the infalling envelope. Both have a length of ∼1000 au. To further characterize the structures, we estimated their density and mass. Assuming local thermodynamic equilibrium (T = 20 K), we can determine the 13CO column density using the following equation (Wilson et al. 2013):

We obtain  . Assuming that the abundance ratio of 12CO to 13CO is 70 and the ratio of H2 to 12CO is 104 (Frerking et al. 1982), we get a H2 column density of
  , and arc mass of
  . We describe the interpretation of the arc-like structures in Section 4.3.
Figure 4(c) is a zoomed-in view of the vicinity of the continuum source, as indicated by the black rectangle in panel (a). As indicated by the magenta dashed line, the 13CO emissions of velocities close to the systemic velocity have an S-shaped configuration. For the continuum source, the velocity gradient extends from northwest to southeast, and its extent is about 500 au. The direction of the velocity gradient corresponds to the major axis of the disk and is also perpendicular to the outflow axis and to the large-scale velocity gradient seen in panel (a). Figure 4(d) shows a PV diagram along the arrow shown in panel (c). There are emissions with relative velocities of ≳3 km s−1 in the region within ±2'' (corresponding to ∼500 au) of the continuum source. The region with a negative offset (i.e., northwest of the disk) is blueshifted, and the opposite side is redshifted. The small-scale velocity gradient perpendicular to the outflow could trace the rotating motion of the disk or the envelope (see also Section 4.3).
The velocity structure provides information on the protostellar mass, although the angular resolution is not sufficiently high to determine it properly. At an offset of ± 1'' (∼240 au), the relative velocity is ∼2 km s−1 (see Figure 4). To produce such a high velocity at large radii by Keplerian rotation requires at least a 1 M⊙ source with a mass heavier than typical low-mass protostars. This estimation gives a lower limit of the protostellar mass without considering the inclination angle, which is about a factor of 2 heavier in the case of close to face-on viewing. The dynamically inferred mass is consistent with the mass estimated by Spezzi et al. (2008) based on the position of DK Cha in the H-R diagram.
4. Discussion
4.1. Interpretation of the Outflow Velocity Structure
Numerous observational studies have reported outflows, most of which are nicely shaped bipolar flows when viewed nearly edge-on. It is difficult to spatially resolve the radial velocity distribution within an outflow in such objects because the observed outflow velocity decreases as the line-of-sight direction approaches edge-on. In addition, it is also difficult to investigate the internal velocity structure of an outflow when viewed close to edge-on. We observed the DK Cha outflow from nearly pole-on and could clearly detect its spatial velocity structure, as shown in the Figures 1–3. In this section, we discuss the three-dimensional velocity structure of the DK Cha outflow based on the observed velocity gradient in the plane of the sky.
The spatial distribution of the 12CO emission seen in Figures 1–3 is highly complicated. Thus, it is difficult to guess the origin of the emission from the morphology alone. However, as mentioned in Section 3.1, their typical velocities are much faster than the speed of sound at 10 K (∼0.2 km s−1), and their complex structures can only be attributed to outflow origin. Since it is significantly difficult to reproduce blueshifted and redshifted emissions surrounding the continuum source in a typical edge-on view of the outflow, we interpreted the CO emission as a pole-on view of the outflow. Note that previous studies already suggested that the DK Cha outflow is observed nearly pole-on (van Kempen et al. 2009; Yıldız et al. 2015).
4.1.1. Comparison with Another Pole-on Outflow
Before discussing the outflow structure of DK Cha, we compare the DK Cha outflow with another pole-on outflow. Fernandez-Lopez et al. (2020) reported that the Class II star DO Tau has a similar outflow structure in the same 12CO(J = 2–1) emission line as our detected outflow structure. They identified ring-shaped outflows with three different radii and velocities. Based on the disk inclination angle (i = 19°) and other factors, they interpreted these structures to be a pole-on view of the outflow. The ring-like structures of DO Tau are closer to a perfect circle than the crescent-shaped structures of DK Cha. This difference may be attributed to the inclination angle, and we expect that the inclination angle of DO Tau is smaller than that of DK Cha. The radii of the rings of DO Tau range from 220 to 800 au, slightly smaller than for DK Cha. The velocities of the DO Tau outflow are −10–8 km s−1. DK Cha is considered to be younger than DO Tau. The physical properties of DK Cha, such as the outflow emission, velocity, and spatial scale, are greater than those of DO Tau. Thus, DK Cha could be a more suitable object for observing outflow-driven protostellar systems from nearly face-on directions and for discussing the spatial velocity structure of the outflow.
4.1.2. Three-dimensional Outflow Structure
In the following, we discuss which model could reasonably explain the spatial velocity structure of the outflow observed in the CO emission. As described in Section 3.1, the redshifted component is likely to interact with the surrounding gas, resulting in a complicated structure. On the other hand, the blueshifted component has a relatively simple velocity structure. Thus, we focused only on the velocity structure of the blueshifted outflow (see the left panel of Figure 3).
A simple model proposed by Lee et al. (2000) is often used to interpret the outflow velocity structure emerging on the PV diagram. Their model describes the outflow as a parabolic surface with a velocity structure that accelerates along the outflow axis. The model appears to explain well the outflow velocity structure on the PV diagram along the outflow axis, while it is not obvious that the model can explain the spatial velocity structure in the plane of the sky. We, therefore, present a simplified three-dimensional illustration that provides an overview of the velocity structure in the left panels in Figure 5. We assume continuous acceleration, while for simplicity we represent the outflow as being composed of three different velocities (orange for the low-, green for the intermediate-, and blue for the high-velocity component). The lower left panel of Figure 5 clearly shows that the high-velocity component has a more extended structure than that of the low-velocity component in the plane of the sky. Figures 2 and 3 show that the low-velocity component surrounds the high-velocity component, which is the opposite to what is observed for the model reported by Lee et al. (2000). Thus, it is difficult to reproduce our results with the vertical acceleration model. Note that we do not mean that outflows are not actually accelerating along the outflow axis.

Figure 5. Schematic view of the outflow driven from the protostar. Left: model of an outflow gradually accelerating along the outflow axis. The orange-, green-, and blue-filled regions have low-, intermediate-, and high-velocity components, respectively. For simplicity, only three different velocities are shown in the figure. The dark gray sphere and gray region represent the central protostar and circumstellar disk, respectively. Right: model of an outflow with a horizontal velocity gradient.
Download figure:
Standard image High-resolution image
Another possible approach is to examine the horizontal velocity structure of the outflow (or the velocity distribution in the plane perpendicular to the outflow axis, not along the outflow surface). We consider the horizontal velocity gradient model, in which the gas in the inner regions flows outward at higher velocity (Figure 5 right panels). If we observe such an outflow from a direction close to pole-on, a layered velocity structure should appear, as shown in the lower right panel of Figure 5. In addition, the high-velocity component is expected to be more compact than the low-velocity one. The velocity structure of the observed outflow in the left panel of Figure 3 has a similar layered velocity gradient, with a compact high-velocity component surrounded by an extended low-velocity component. In the panel, the missing part of the ellipse could be due to interactions with the ambient gas, lack of sensitivity outside the observation area, or other factors. Therefore, our observations reveal that outflows with different velocities are driven from different radii. Such a velocity structure can be naturally reproduced by an outflow directly driven by the magnetocentrifugal mechanism (e.g., Machida 2014; Machida & Basu 2019).
4.2. Outflow Launching Regions
The outflow driving mechanism is still under debate. There are two main scenarios. In one, the outflow is produced by ambient gas receiving momentum from the high-velocity jet (e.g., Arce et al. 2007). In the other, the outflow is driven directly from the circumstellar disk by the magnetocentrifugal mechanism irrespective of the appearance of the jet (e.g., Machida 2014). Recent ALMA observations have supported the latter. For example, Bjerkeli et al. (2016) reported that the TMC-1A outflow is driven from the outer edge of the disk. A clear signature of rotation could be detected in the bipolar outflow of Orion Source I (Hirota et al. 2017). The large angular momentum of the outflow indicates that the outflow is driven far from the central protostar. Note that the outflow driven from the region close to the central star cannot have a large angular momentum (or rapid rotation). Matsushita et al. (2019) discovered an extremely high-velocity flow and outflow around MMS 5 in the Orion Molecular Cloud 3, and found that their axes are misaligned, whereas if the low-velocity flow is entrained by the high-velocity flow, their axes should be aligned.
Here, based on the directly driven outflow scenario, we estimate the driving radius from the observed outflow velocities shown in Figures 1–3. Classical theoretical studies (e.g., Mestel 1961, 1968) have shown that the terminal velocity of the outflow (or disk wind) roughly corresponds to the Keplerian velocity at its launching radius. Thus, we simply assume that the observed outflow velocity vout agrees with the Keplerian velocity vK at each launching radius r0,

With Equation (2), the outflow launching radius r0 can be described as

where we have used a protostellar mass Mstar of 2M⊙ (Spezzi et al. 2008). As shown in Figures 1–3, the outflow of DK Cha has crescent-shaped structures across the low-velocity (<5 km s−1) to the high-velocity (>50 km s−1) components. The outflow launching region extends over 2 orders of magnitude (∼0.7–70 au) if these outflow components with different velocities are driven directly from their respective radii. Note that the driving radius depends somewhat on the Alfvén radius (i.e., the intensity of the magnetic field and ram pressure). Thus, there is uncertainty in estimating the launching radius within a factor of ≲10 (e.g., Pudritz & Norman 1986; Koenigl & Ruden 1993; Kudoh & Shibata 1997a; Pudritz & Ray 2019). Therefore, the inner (∼0.7 au) and outer (∼70 au) launching radii can be changed according to the extent of the Alfvén radius. However, the large extent of the outflow driving region (over 2 orders of magnitude in radius) would not change significantly, because the outflow velocity at each shell (see Figure 5 right panels) is primarily determined by the Keplerian velocity at each launching radius (Kudoh & Shibata 1997a, 1997b; Machida et al. 2008), and the difference in the outflow velocity (∼5–50 km s−1) gives the difference in the launching radius proportional to the outflow velocity (see Equation (3)).
Considering the conservation of the (specific) angular momentum ( ), it is valuable to estimate the rotational velocity of the outflow vrot,

where rout is the observed outflow radius (the half width of the outflow lobe). Thus, the rotational velocity of the outflow is clearly less than the velocity resolution in this observation. Since the outflow rotational velocity becomes smaller due to the inclination angle, it is natural that we could not detect any sign of outflow rotation.
4.3. Rotating Infalling Envelope and Streamer
In this subsection, we discuss the gas motion expected from the 13CO(J = 2–1) emission. As described in Section 3.2, two velocity gradients around DK Cha are detected in the 13CO emission (Figure 4), one perpendicular and one parallel to the outflow axis. Relative velocities seem to be higher in regions closer to the central protostar. This velocity structure is similar to the infalling and rotating gas motion reported in recent ALMA observations (e.g., Aso et al. 2015; Sakai et al. 2016; Yen et al. 2017). In particular, the velocity structure (moment 1 map) of HL Tau (Yen et al. 2017, Figure 1) is very similar to our results (Figure 4(a)) in that both sources have a 1000 au scale envelope gas, velocity gradients parallel and perpendicular to the outflow axis, and an S-shaped structure with the gas having velocities close to the systemic velocity in the 13CO(J = 2–1) emission. Thus, it seems that the 13CO emission has traced the rotating infalling envelope.
We can also confirm the existence of 13CO arc-like structures in Figure 4(a). There is no sign of a binary star in DK Cha, and thus the structure is unlikely to be the result of gravitational interactions in a multiple system (Matsumoto et al. 2015) like MC27/L1521F (Tokuda et al. 2014, 2016). Rather, it is more natural to interpret these structures as nonaxisymmetric accretion flows toward the central protostellar system since these are connected to the rotating infalling envelope described above. In other words, we expect that the structures are the same phenomenon as the streamers recently observed (Pineda et al. 2022, and references therein). Among Class I objects, streamers have been detected in HL Tau and Per-emb-50 with lengths of 520 and 3000 au, respectively (Yen et al. 2019; Valdivia-Mena et al. 2022). The streamers detected in DK Cha have a similar size (∼1000 au) to these objects. Our observations may be a case in which the rotating infalling envelope and the streamers were detected simultaneously. HL Tau, Per-emb-50, and DK Cha are all intermediate-mass protostars (∼2M⊙). Therefore, it is interesting to investigate whether streamers are associated with a broader range of protostellar mass. In addition, since shock tracers such as SO have been detected together with streamers (Garufi et al. 2022), it will be important to observe different molecular emission lines for DK Cha.
5. Conclusions
We have analyzed the ALMA archival data toward the intermediate-mass protostar DK Cha in the Chamaeleon II star-forming region. Our results are summarized as follows.
- 1.A 12CO(J = 2–1) emission was detected in the very high-velocity outflow (∣vLSR − vsys∣ ≥ 70 km s−1) driven by DK Cha, which exhibits a ∼3000au scale crescent-shaped structure surrounding the 1.3 mm continuum source. The outflow has a layered velocity gradient; the lower-velocity component is located southwest toward the continuum peak, and the higher-velocity component is shifted northeastward. These observations revealed the spatially resolved velocity structure of the pole-on outflow.
- 2.We considered two models to explain the velocity structure of the CO outflow revealed in this study. One is to interpret the observed velocity structure as a vertical acceleration of the outflow. The other interprets the observed velocity structure as a horizontal velocity gradient of the outflow. Based on the fact that the high-velocity component is more compact than the low-velocity one, the latter model is more plausible to explain the velocity gradient of the outflow observed in the CO emission. Furthermore, based on the directly driven outflow scenario, we clarified the outflow driving region from the observed outflow velocities. The results suggest that the driving region extends over 2 orders of magnitude (∼0.7–70 au).
- 3.We detected two different velocity gradients in the 13CO(J = 2–1) emission. One is a 500 au scale compact velocity gradient around the protostar from northwest to southeast, which is perpendicular to the expected axis of the 12CO outflow. The other is a 2500 au scale velocity gradient extending from northeast to southwest, parallel to the expected outflow axis. The relative velocity ∣vLSR − vsys∣ is >3 km s−1and tends to be higher in regions closer to the central protostar. Considering the directions of the gradients and the acceleration toward the protostar, the 13CO emission traces the rotating infalling envelope. In addition, the 13CO emission shows two arc-like structures. One has a blueshifted central velocity of ∼2 km s−1and extends to the northwest toward DK Cha. The other has a redshifted central velocity of ∼4 km s−1and extends to the northeast. Both have a length of ∼1000 au. Since these structures are connected to the infalling envelope, we concluded that the arc-like structures correspond to nonaxisymmetric accretion flows, i.e., streamers, often reported in recent years.
DK Cha has the potential to become a reasonable template for understanding the characteristics of face-on protostellar systems, as it allows us to simultaneously observe various phenomena, such as a crescent-shaped outflow, a rotating infalling envelope, and streamers. It is expected that future wide-field and deep observations of DK Cha will help us to further understand the inner and outer structures in more detail.
We would like to thank the anonymous referees for useful comments that we applied to improve our manuscript. This paper makes use of the following ALMA data: ADS/JAO.ALMA#2019.1.01792.S. ALMA is a partnership of ESO (representing its member states), the NSF (USA), and NINS (Japan), together with the NRC (Canada), MOST, and ASIAA (Taiwan), and KASI (Republic of Korea), in cooperation with the Republic of Chile. The Joint ALMA Observatory is operated by the ESO, AUI/NRAO, and NAOJ. This work was supported by a NAOJ ALMA Scientific Research grant (No. 2022-22B), Grants-in-Aid for Scientific Research (KAKENHI) of the Japan Society for the Promotion of Science (JSPS; grant Nos. JP17H06360, JP17K05387, JP17KK0096, JP21K13962, JP21H00049, JP21K03617, and JP21H00046). N.H. was supported by the ALMA Japan Research Grant of NAOJ ALMA Project, NAOJ-ALMA-274.
Software: CASA (v5.6.1–8; THE CASA TEAM et al. 2022), Astropy (Astropy Collaboration et al. 2018).