


Abstract
We present a precise measurement of the asymptotic normalization coefficient (ANC) for the 16O ground state (GS) through the 12C(11B, 7Li)16O transfer reaction using the Quadrupole‐3‐Dipole (Q3D) magnetic spectrograph. The present work sheds light on the existing discrepancy of more than 2 orders of magnitude between the previously reported GS ANC values. This ANC is believed to have a strong effect on the 12C(α, γ)16O reaction rate by constraining the external capture to the 16O ground state, which can interfere with the high-energy tail of the 2+ subthreshold state. Based on the new ANC, we determine the astrophysical S-factor and the stellar rate of the 12C(α, γ)16O reaction. An increase of up to 21% in the total reaction rate is found within the temperature range of astrophysical relevance compared with the previous recommendation of a recent review. Finally, we evaluate the impact of our new rate on the pair-instability mass gap for black holes (BH) by evolving massive helium core stars using the MESA stellar evolution code. The updated 12C(α, γ)16O reaction rate decreases the lower and upper edges of the BH gap about 12% and 5%, respectively.
Export citation and abstract BibTeX RIS
1. Introduction
The 12C(α, γ)16O reaction is of overall importance in the nucleosynthesis of carbon, oxygen, and heavier elements, and the evolution of the massive stars. As the black hole (BH) is the most attractive object in the universe and one of the final fates of the massive stars, finding a reliable prediction of its mass distribution is a very meaningful topic. A gap in the mass distribution of BHs from collapsed stars was predicted based on the pair-instability mechanism in the evolution of the massive stars (Fowler & Hoyle 1964; Woosley et al. 2002). A determination of the BH mass gap was also provided by recent gravitational wave measurements of binary BH-merger events detected by LIGO and Virgo (Acernese et al. 2014; Abbott et al. 2016, 2019). According to the stellar evolution theory, the BH mass gap depends on the sensitively of the 12C(α, γ)16O reaction rate (Farmer et al. 2019, 2020) as it influences the ratio of the carbon and oxygen at the end of the core helium burning stage and impacts the final fate of massive stars (Farmer et al. 2020). This demonstrates another strong motivation for a precise determination of the 12C(α, γ)16O reaction rate.
Considerable efforts have been made in the past few decades to advance our understanding of this fundamental reaction, but most estimates show that we are still far from the uncertainty of less than 10% required by stellar models (Weaver & Woosley 1993; Woosley et al. 2002). Because of the extremely low cross section due to a low Coulomb penetrability at stellar energies, all direct measurements have been performed at center-of-mass (c.m.) energies greater than Ec.m. = 891 keV (see Fey 2004; Hammer et al. 2005a, 2005b and references therein). At the 300 keV energy related to stellar helium burning, the cross section is estimated to be on the order of 10−17 barn, which is about 5 orders of magnitude lower than the sensitivity from the most advanced measurements. As a result, a reliable extrapolation of the cross section from such higher energies to the Gamow window is highly desirable and has long been a big challenge. To date phenomenological R-matrix (Lane & Thomas 1958; Barker & Kajino 1991; Azuma et al. 2010; Descouvemont & Baye 2010) has been the main method used to extrapolate the cross section from higher observed energies down to the astrophysical ones.
Recently, deBoer et al. (2017) has emphasized that the interference between the contributions from the high-energy tail of the 2+ subthreshold state and the E2 external capture to the ground-state (GS) results in a similar energy dependence over the energy range of the available experimental data. This means that the GS and 2+ state asymptotic normalization coefficients (ANCs) will be highly correlated in any R-matrix fit. Therefore, precise measurement of the GS ANC is crucial for determination of the 12C(α, γ)16O reaction rate. Currently, the reported experimental GS ANC values range from 13.9 ± 2.4 to 3390 fm−1/2 (Adhikari & Basu 2009; Morais & Lichtenthäler 2011; Sayre et al. 2012; Adhikari et al. 2017). These values were derived from different methods including the 16O breakup (Adhikari & Basu 2009), the elastic transfer reaction 12C(16O, 12C) 16O (Morais & Lichtenthäler 2011), the 12C(7Li, t)16O reaction (Adhikari et al. 2017), and the R-matrix fitting (Sayre et al. 2012). In light of this large discrepancy between the GS ANC values and the consistent values for the 2+ ANC determined through sub-Coulomb transfer reactions, a value of 58 fm−1/2 for the GS ANC was adopted in that work (deBoer et al. 2017).
In the present experiment, we use the 12C(11B, 7Li)16O transfer reaction to extract the 16O GS ANC to shed light on these discrepancies of more than 2 orders of magnitude. Based on our new ANC and the R-matrix fit parameters obtained by deBoer et al. (2017), we make a new R-matrix calculations to evaluate the low-energy E2 S-factor of the 12C(α, γ)16O reaction. A subset of the present data (focusing on determination the GS E2 S-factor at 300 keV) has been published previously (Shen et al. 2020, 2021). In this article, we present a detailed description of the experimental setup and give an analysis of the full data set. Moreover, we obtain the total S-factor and the total rate of the 12C(α, γ)16O reaction. The new ANC causes an increase of up to 21% in the total reaction rates within the temperature range of astrophysical interest, compared with the previous recommendation in the review (deBoer et al. 2017). Finally, the impact of new rates on the pair-instability mass gap for BH is evaluated by evolving massive helium core stars using the 1D open-source MESA stellar evolution code.
2. The 12C(11B, 7Li)16Og.s. Experiment
The measurement of the 12C(11B, 7Li)16Og.s. angular distribution was performed at the HI-13 tandem accelerator of China Institute of Atomic Energy (CIAE) in Beijing, China. The experimental setup and procedures are similar to those previously reported (Guo et al. 2012, 2014; Shen et al. 2019a, 2019b). As shown in Figure 1, the experimental setup is a typical one for a high-energy transfer measurement performed using the Q3D magnetic spectrograph at the HI-13 tandem accelerator. A 50 MeV 1 mm spot 11B beam was delivered and imprinted onto a self-supporting natural carbon target. We accumulated the beam current with a Faraday cup connected to a calibrated charge integrator. A ΔE-E silicon telescope was also placed at θlab = 25° to monitor the beam current simultaneously.

Figure 1. Typical experimental setup for a high-energy transfer measurement performed using the Q3D magnetic spectrograph at HI-13 tandem accelerator of CIAE. The Q3D magnetic spectrograph consists of a target chamber, a quadrupole, three dipoles, and detector arrays at the focal plane.
Download figure:
Standard image High-resolution imageAt the beginning of the experiment, we used the Rutherford scattering cross sections on a gold-foil target to evaluate several of the main sources of systematic uncertainty. The carbon target thickness, which was a major source of systematic uncertainty, was calibrated and monitored by measuring the differential cross sections of 11B+12C elastic scattering at θlab = 14°, 15°, 16° both at the beginning and end of the experiment (see Figure 2). By comparing with the previous experimental data of 11B+12C elastic scattering (Shen et al. 2019a), the thickness of the target was determined to be 80 ± 4 μg cm−2, and no obvious carbon buildup or loss was found. The same experimental setup was adopted in the calibration of the target thickness and the following measurements. Therefore, the systematic uncertainties from the beam charge collection efficiency, the acceptance of the Q3D magnetic spectrograph, the transport efficiency, and other parameters of the measurement system, have already been included in the uncertainty of target thickness. The position and energy of the focal silicon detectors were also calibrated with the events from elastic scattering on gold and 12C and the easily identifiable 12C(11B, 7Li)16O to the 16O 6.92 MeV 2+ and 7.12 MeV 1− states.

Figure 2. (Color online.) Elastic scattering angular distributions and fits of the 11B+12C at 50 MeV and 7Li+16O at 36 MeV by the optical model calculation. The experimental data of 7Li+16O elastic scattering are taken from Schürmann et al. (2011). The red curves are the optical model fittings. The blue squares and red triangles are the calibration data at the beginning and end of the experiment to calibrate and monitor the target thickness.
Download figure:
Standard image High-resolution imageTypically, the Q3D magnetic spectrograph has an energy resolution of 0.02%, which corresponds to several keV per millimeter at the focal plane, and an angular resolution of 0.1°. Its high resolution makes it possible to resolve the closely spaced states that cannot be achieved using silicon detectors alone, and to obtain high-precision data of angular distributions at forward angles where the direct mechanism dominates. For example, the position of the 7Li events from 12C(11B, 7Li0.478)16Og.s. reaction is 60–90 mm away from those from the 12C(11B, 7Lig.s.)16Og.s. reaction. The desired reaction products were separated and focused by the Q3D magnetic spectrograph and detected by an array consisting of five 2D position sensitive silicon detectors fixed at the focal plane. The silicon array's 2D position data completely records the products collected within the acceptable solid angle of the Q3D.
Along with the expected reaction products, a large number of background particles with the same magnetic rigidity, such as 1,2,3H and 3,4He, will be produced on contaminants in the target and structures such as the target frame or collimators. To remove those impurities with the same magnetic rigidity, a 2D particle identification diagram (PID) combining the energy and horizontal position provided by the focal silicon detectors was used. As an example, Figure 3 shows the PID of 12C(11B, 7Li)16Og.s. at θlab = 7°, 10°, 14°, and 19°. The events in the solid red rectangles are the 7Li produced by the 12C(11B, 7Li)16Og.s. reaction. Different impurities are clustered in different horizontal lines based on their energies determined by the same magnetic rigidity. The major impurities are labeled shown in Figure 3.

Figure 3. (Color online.) The particle identification diagram (PID) at θlab = 7°, 10°, 14°, and 19°. The 7Li events from the 12C(11B, 7Li)16Og.s. reaction are marked with solid red rectangles. Other clustered events represent different impurities, such as 2,3H, 4He, 11B, and 12C. Light impurities like 2,3H and 4He are mostly produced by the multibody breakup of the incident 11B ions on the target. 11B events come from elastic scattering on the target frame or collimators. 12C events are produced by the proton-pickup reaction of 11B on 12C or other contaminants in the target.
Download figure:
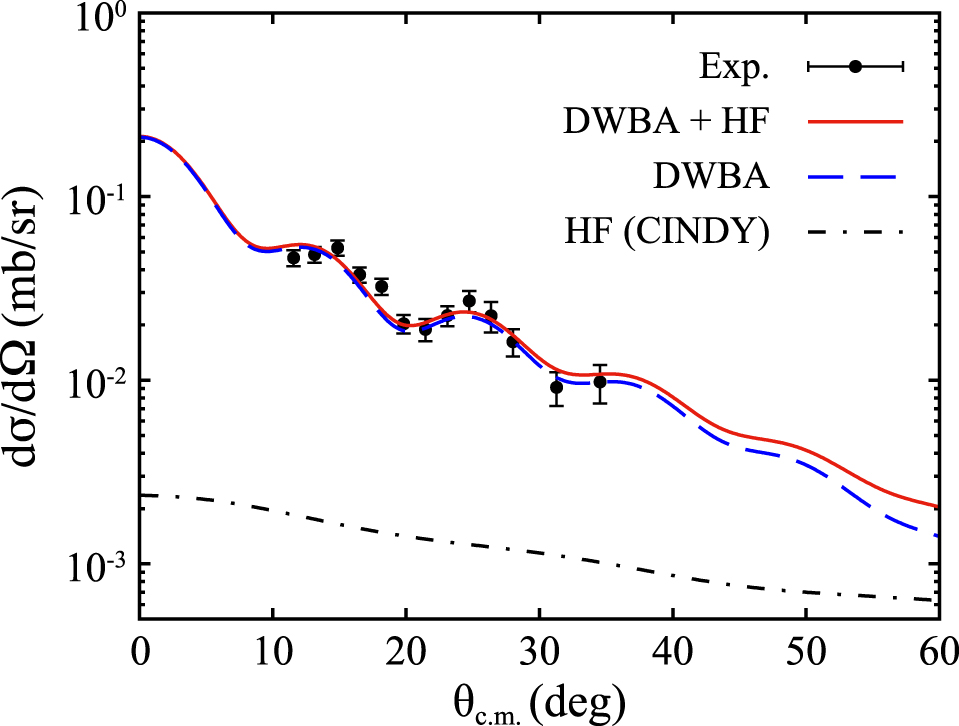
Standard image High-resolution imageBy counting the 7Li events at the angular range θlab = 7°–21°, the angular distribution of 12C(11B, 7Li)16Og.s. at E(11B) = 50 MeV was obtained, which is represented by the solid black points in Figure 4. In the following section, we will go over how to use distorted-wave Born approximation (DWBA) theory to calculate the angular distribution and ANC of the 16O GS.

Figure 4. (Color online.) Angular distribution of the 12C(11B, 7Li)16O reaction leading to the ground state of 16O. The dashed blue line denotes the DWBA calculation normalizing to the experimental data. The dashed–dotted black line denotes the compound-nucleus contribution. The solid red line denotes the combined DWBA and compound-nucleus contributions.
Download figure:
Standard image High-resolution image3. Extracting the ANC of the 16O Ground State
In this energy regime, the direct and compound-nucleus reaction mechanisms are most likely to be dominant. This is because such reactions are extremely fast, resulting in fewer internal collisions, and this kind of reactions often exhibit high cross sections at forward angles. The finite-range DWBA theory, which assumes a one-step transition between the initial and final scattering states, is more commonly used to explain the direct reactions. Of course, the compound-nucleus reaction mechanism should be taken into account, particularly at lower energies or at backward angles. Therefore, the contribution of the compound-nucleus reaction is also discussed in the following analysis.
In the 12C(11B, 7Li)16Og.s. reaction, the conventional DWBA differential cross section can be related to the experimental one by
where  and
and  denote the conventional DWBA and experimental differential cross sections.
  and
and  are the α-cluster spectroscopic factors of the GSs of 11B(=α+7Li) and 16O(=α+12C), respectively. In addition,
  can be normalized to the experimental data through the ANC defining the amplitude of the tail of the radial overlap function by
where  and
and  are the ANCs for the α-cluster bound states in the 11B and 12O, respectively;
  and
and  are the corresponding single-particle ANCs, which can be derived from the single-particle wave functions calculated with the optical potential model. The ANC can be related to the spectroscopic factor by

Therefore, to extract the ANC of the 16O GS ( ), the DWBA calculations are normalized to the experimental data. The DWBA calculations are made with the computer code FRESCO (Thompson 1988). The essential ingredients of these calculations are the optical model potentials (OMPs) for the entrance and exit channels, the core–core (7Li+12C) interaction, the binding potentials for the (11B = α+7Li) and (16O = α+12C) systems, and the spectroscopic factor for the 11B GS.
The OMP parameters for the entrance and exit channels are obtained by fitting the experimental angular distributions of the 11B+12C (Shen et al. 2019a) and 7Li+16O elastic scattering (Schumacher et al. 1973) with a single-folding model (Pang et al. 2011; Xu & Pang 2013). When compared to the standard Woods–Saxon-type OMP, which requires more than six free parameters, the single-folding potential only requires two free parameters: the normalization factors (Nr and Ni ) for the real and imaginary parts of the OMP. Nucleon density distributions of 11B, 12C, and 16O required by the calculations of the single-folding model are obtained using Hartree–Fock calculations with the Coulomb exchange interaction (SkX) interaction (Alex Brown 1998), while those of 7Li were taken from an independent-particle model (Satchler 1979). These density distributions were folded using the systematic nucleon–nucleus potential of the JLMB model (Bauge et al. 2001). The depths of these single-folding potentials are adjusted by normalizing parameters to provide an optimal reproduction of the experimental data. The comparison of the optical model calculations with the experimental data is depicted in Figure 2. The minimum-χ2+1 principle is used to assess the uncertainty of the normalization parameters of the single-folding potentials for the entrance and exit channels (see, e.g., Dobaczewski et al. 2014). The normalization factors, Nr and Ni , are found to be 1.071 ± 0.034 and 1.388 ± 0.049 for the entrance 11B+12C channel, and 0.657 ± 0.029 and 1.348 ± 0.031 for the exit 7Li+16O channel using the minimum-χ2+1 method. Figure 2 shows the calculated DWBA curves using the single-folding potentials that gave a good reproduction of the experimental angular distributions. A common approximation that we implemented was that the same optical potential was used for both the exit channel and the core–core interaction. Details about the validation of this approximation can be found in our previous work (Shen et al. 2019a).
The general method to find the OMPs for the binding systems 11B(= α+7Li) and 16O(= α+12C) is to use a universal parameter set of radius r0 and diffuseness a, such as (r0, a) = (1.25, 0.65) fm. This is quite arbitrary and will introduce a large uncertainty into the final results. Therefore, we adopted the rms radii of the related nuclei to constrain the OMP parameters for the binding systems. For the (C = α+X) binding system, the radius and diffuseness are adjusted so that the corresponding r.m.s. radius of the α-cluster wave function,  , satisfied the following relation, which is also introduced in Guo et al. (2012),

where  ,
,  , and
, and  are the mean-square radii of the core, the α particle, and the composite nucleus, respectively. As the depth of the binding OMP will be determined with the usual separation energy prescription, we can find a set of (r0, a) parameters that can both satisfy Equation (4) and reproduce the experimental angular distribution.
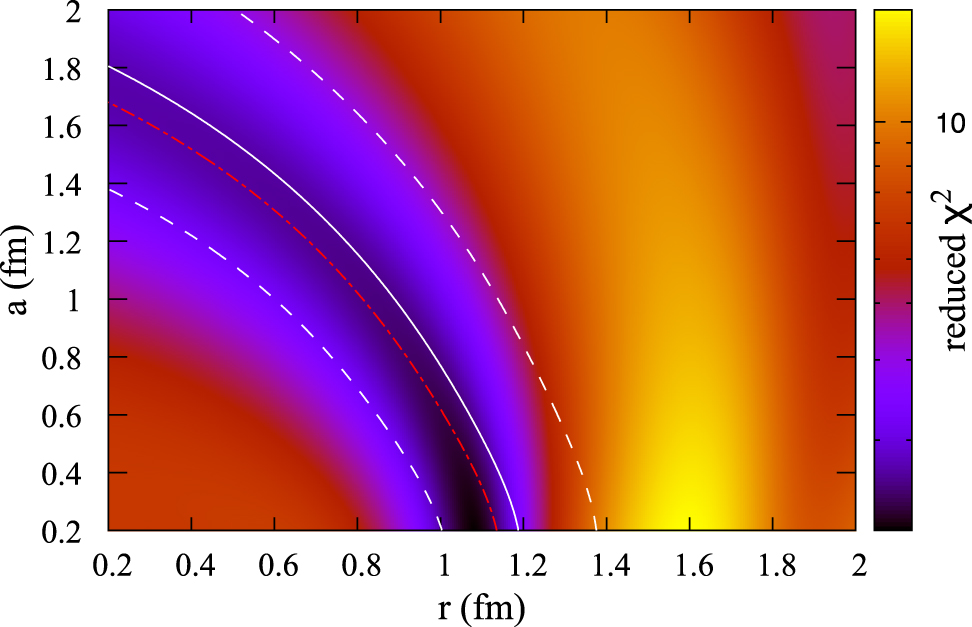
The binding OMP parameters for the 11B(= α+7Li) were taken from our previous study (Shen et al. 2019b), in which the 7Li(6Li, d)11B angular distribution was measured, and the binding parameters were calculated using the same technique as stated above. The binding OMP parameters for the 16O(= α+12C) were extracted by fitting the 12C(11B, 7Li)16Og.s. angular distribution in the present experiment. We also used Equation (4) to constrain the binding potential by reproducing the rms radius of the α-cluster wave function. The rms radii of 4He, 12C, and 16O were taken to be 1.47(2) fm (Khoa 2001), 2.481(80) fm (Liatard et al. 1990), and 2.631(61) fm (Liatard et al. 1990), respectively. In Figure 5, we show a 2D χ2 plot for the fit of the 12C+α binding potential parameters (r0 and a) to the experimental 12C(11B, 7Li)16Og.s. angular distribution. By achieving the minimum χ2, a set of parameters, r0 = 1.00 fm and a = 0.65 fm, was determined. The dependence of the retrieved ANC on these potential parameters was investigated within the range of radius r0 (0.98–1.015 fm) and diffuseness a (0.57–0.71 fm) set by the minimum-χ2+1 principle (see, e.g., Dobaczewski et al. 2014). The impact of this alteration on the  was found to be 7.5%, showing a favorable peripheral nature for the 12C(11B, 7Li)16O transfer reaction.

Figure 5. (Color online.) 2D χ2 plot for the fit of the 12C+α binding potential parameters (r0 and a) to the experimental 12C(11B, 7Li)16Og.s. angular distribution. The red dashed–dotted line represents the r0 and a values corresponding to the rms radius of 2.96 fm for the α-cluster wave function constrained by the minimum-χ2 fitting. The white solid line represents the r0 and a values corresponding to the rms radius of 3.068 fm constrained using Equation (4), while the white dashed lines show its uncertainty, which is propagated from the uncertainties of the rms radii of 4He, 12C, and 16O.
Download figure:
Standard image High-resolution imageWe have also evaluated the contribution of the compound nuclear (CN) process with the Hauser–Fesbach (HF) code CINDY (Sheldon & Rogers 1973). The optical potentials for the entrance and exit channels were retained from the above DWBA calculation and were entered into HF calculation. The contribution from the CN process was found to be small (less than 3% on the  ) for the present transfer reaction. The DWBA and CN calculations for the 12C(11B, 7Li)16Og.s. reaction were shown in Figure 4. The experimental data was reasonably reproduced by the DWBA calculation, providing strong evidence of the direct nature of the 12C(11B, 7Li)16O reaction at this energy. By normalizing the DWBA calculation to the experimental angular distribution after subtracting the CN contribution, the
  was extracted to be 337 ± 45 fm−1/2, and the spectroscopic factor was determined to be 0.184 ± 0.043. The uncertainty for the
  mainly results from the OMPs for the entrance and exit channels (1.4% and 0.9%), the binding potentials for the (11B = α+7Li) and (16O = α+12C) systems (1.9% and 7.5%), the spectroscopic factors of the 11B GS (10.2%), the target thickness (2.5%), and the statistics (2.3%). In Table 1, we list the model parameters used in the DWBA analysis and the uncertainty budget for the extraction of the
  .
.
Table 1. List of the Model Parameters and Uncertainty Budget for the Extraction of the ANC
| Parameter | Value | σ |

|
|---|---|---|---|
| Nren | 1.071 | 0.034 | 1.1% |
| Nien | 1.388 | 0.049 | 0.93% |
| Nrex | 0.657 | 0.029 | 0.18% |
| Niex | 1.348 | 0.031 | 0.84% |

| 0.64 | 0.09 | 4.5% |

| 0.74 | 0.09 | 9.2% |
| r0 of 16O (fm) | 1.0 |

| 7.5% |
| a of 16O (fm) | 0.65 |

| |
| r0 of 11B (fm) | 0.98 |

| 1.9% |
| a of 11B (fm) | 0.60 |

| |
| Statistics | 2.3% | ||
| Target thickness | 2.5% | ||
Total uncertainty in 
| 13.4% | ||
Note. The main parameters used in the DWBA calculation are shown in the first column. The last column,  , represents the uncertainty of the
  from each parameter. Nr and Ni are the normalization factors of the real and imaginary part of the single-folding potential. The subscripts "en" and "ex" represent the entrance and exit channels, respectively.
Download table as: ASCIITypeset image
Because the  is a key input for constraining the contribution of the external capture in the 12C(α, γ)16O reaction, there have already been four independent investigations, in addition to our result. A very small
  of 13.9 ± 2.4 fm−1/2 was found by Adhikari & Basu (2009) with the experiment of 16O breakup on 208Pb. Following that, they carried out a new experiment of 12C(7Li, t)16O using the silicon detector telescopes and updated the
  to be 637 ± 86 fm−1/2 (Adhikari et al. 2017). Morais & Lichtenthäler (2011) investigated the
  by analyzing the elastic transfer reaction of 12C(16O, 12C) 16O and derived the
  to be 750, 1230, and 3390 fm−1/2 using three sets of the binding potential. They claimed that such a significant dependence on the potential is probably due to the fact that this reaction cannot be considered a peripheral one. In addition, Sayre et al. (2012) included the E2 external capture in their R-matrix fit to the E2 capture data and found the
  to be 709 fm−1/2. In Table 2, we list the ANC values from the present work and from the literature sources mentioned above. Mukhamedzhanov et al. (1997) emphasized that the most important region for reliably extracting the ANC is at most forward angles where the pole mechanism dominates. Previous measurements (Morais & Lichtenthäler 2011; Adhikari et al. 2017) presented the transfer reaction angular distributions at a wide range of angles, but were insufficient at the most forward angles. This work focuses on the measurement of the transfer reaction angular distribution at the most forward angles by using a high-precision magnetic spectrograph, and thus determines the
  with an uncertainty of 13.4% due to the constraint on the binding potential using a minimum-χ2 fitting to the present experimental data and the peripheral nature of the 12C(11B, 7Li)16O reaction.
Table 2. Present ANC of the 16O GS and Other Available Results in the Literature
| Reference |
 (fm−1/2) (fm−1/2) | Method |
|---|---|---|
| Adhikari & Basu (2009) | 13.9 ± 2.4 | 16O+Pb breakup |
| Morais & Lichtenthäler (2011) | 3390 (WS1) |

|
| 1230 (WS2) | ||
| 750 (FP) | ||
| Sayre et al. (2012) | 709 | R-matrix |
| Adhikari et al. (2017) | 637 ± 86 | 12C(7Li, t)16O |
| Present a | 337 ± 45 | 12C(11B, 7Li)16O |
Note.aWS1 and WS2 are two sets of Woods‐Saxon potentials defined in Morais & Lichtenthäler (2011). FP is a set of folding potential.
Download table as: ASCIITypeset image
4. The S-factors and Stellar Reaction Rates of 12C(α, γ)16O
Because the energy of the Coulomb barrier between the charged particles is much larger than the c.m. energy in a stellar environment, the cross sections of the charged-particle-induced reactions decrease rapidly due to the hindrance of the Coulomb repulsion. Therefore, for capture reactions below the Coulomb barrier, the typical observable is the astrophysical S-factor S(E), which is proportional to the cross section σ but is not exponentially suppressed at low energies,

Here η is the Sommerfeld parameter,
where the c.m. energy E is in the unit of MeV, and M is the mass of the interacting particles in units of atomic mass.
In the case of 12C(α, γ)16O, the major reaction components that contribute to the total S-factor can be divided into three broad categories: the ground-state E1 transition, the ground-state E2 transition, and the sum of the weaker cascading transitions. In order to make an initial estimate of the effect of our new determination of the  , R-matrix calculations have been performed based on those reported in deBoer et al. (2017) using the code AZURE2 (Azuma et al. 2010; Uberseder & deBoer 2015) as shown in Figure 6. In that work, a smaller value of the
  of 58 fm−1/2 was adopted considering the value of 13.9 ± 2.4 fm−1/2 obtained by Adhikari & Basu (2009) and by the precise and consistent values of the
  reported by Brune et al. (1999); (1.14 ± 0.10) × 105 fm−1/2), Avila et al. (2015; (1.22 ± 0.07) × 105 fm−1/2).

Figure 6. (Color online.) Comparison of R-matrix calculations for the S-factors of total, GS E1 and GS E2 components of the 12C(α, γ)16O reaction. The solid black line indicates the total S-factor of 12C(α, γ)16O with the external capture contribution constrained by the present  . The dashed red, dashed–dotted blue, and dash–double-dotted yellow lines denote the S-factors of GS E1, GS E2, and cascading components of 12C(α, γ)16O reaction. The black points are the experimental data of the total S-factors of 12C(α, γ)16O given by Schürmann et al. (2005). The red and green points are the experimental GS E1 and GS E2 S-factors given by Hammer et al. (2005a, 2005b).
Download figure:
Standard image High-resolution imageIn the present work, the  is found to be significantly larger than that adopted in deBoer et al. (2017). However, the
  and
and  are highly correlated R-matrix fit parameters. That is, if the value of one is increased (decreased), the other can be increased (decreased) to produce a nearly identical S-factor over the energy range of all the available experimental data. Only at the lowest energies of the observed experimental data do the S-factors begin to diverge, and over these energies, the experimental uncertainties are large in comparison. This presents a challenge to future low-energy ground-state E2 S-factor measurements, to reach a level of precision where the data can better differentiate between these two reaction components. For example, proposed measurements using the inverse reaction 16O(γ, α)12C (Ugalde et al. 2013; Smith et al. 2021) and the
  reaction (Friščć et al. 2019) estimate such improved levels of uncertainty (Holt & Filippone 2019; Holt et al. 2019); and future direct measurements at underground laboratories like JUNA (Liu et al. 2016) and LUNA (Broggini et al. 2018) will also aim to greatly reduce the uncertainty in the low-energy S-factor.
When our value of 337 ± 45 fm−1/2 is used for the  , a nearly identical reproduction of the S-factor compared to that given in deBoer et al. (2017) can be obtained by increasing
  to (1.55 ± 0.09) × 105 fm−1/2. This ANC value for the
  subthreshold state is significantly larger than the precise sub-Coulomb transfer reaction values obtained by Brune et al. (1999; (1.14 ± 0.10) × 105 fm−1/2), Avila et al. (2015; (1.22 ± 0.07) × 105 fm−1/2), and more recently by Shen et al. (2019a; (1.05 ± 0.14) × 105 fm−1/2) but is consistent with the transfer measurements of Belhout et al. (2007), Oulebsir et al. (2012), and Adhikari et al. (2017), where larger uncertainties are reported. Furthermore, a substantial enhancement of the E2 S-factor is found at very low energies, rising to the E2 S-factor of 70 ± 7 keV b at 300 keV compared to the value of 45 keV b given in deBoer et al. (2017).
With the astrophysical S-factor calculated by the R-matrix theory, the charged-particle thermonuclear reaction rate of the 12C(α, γ)16O reaction is calculated with the following standard integral (Iliadis 2015):
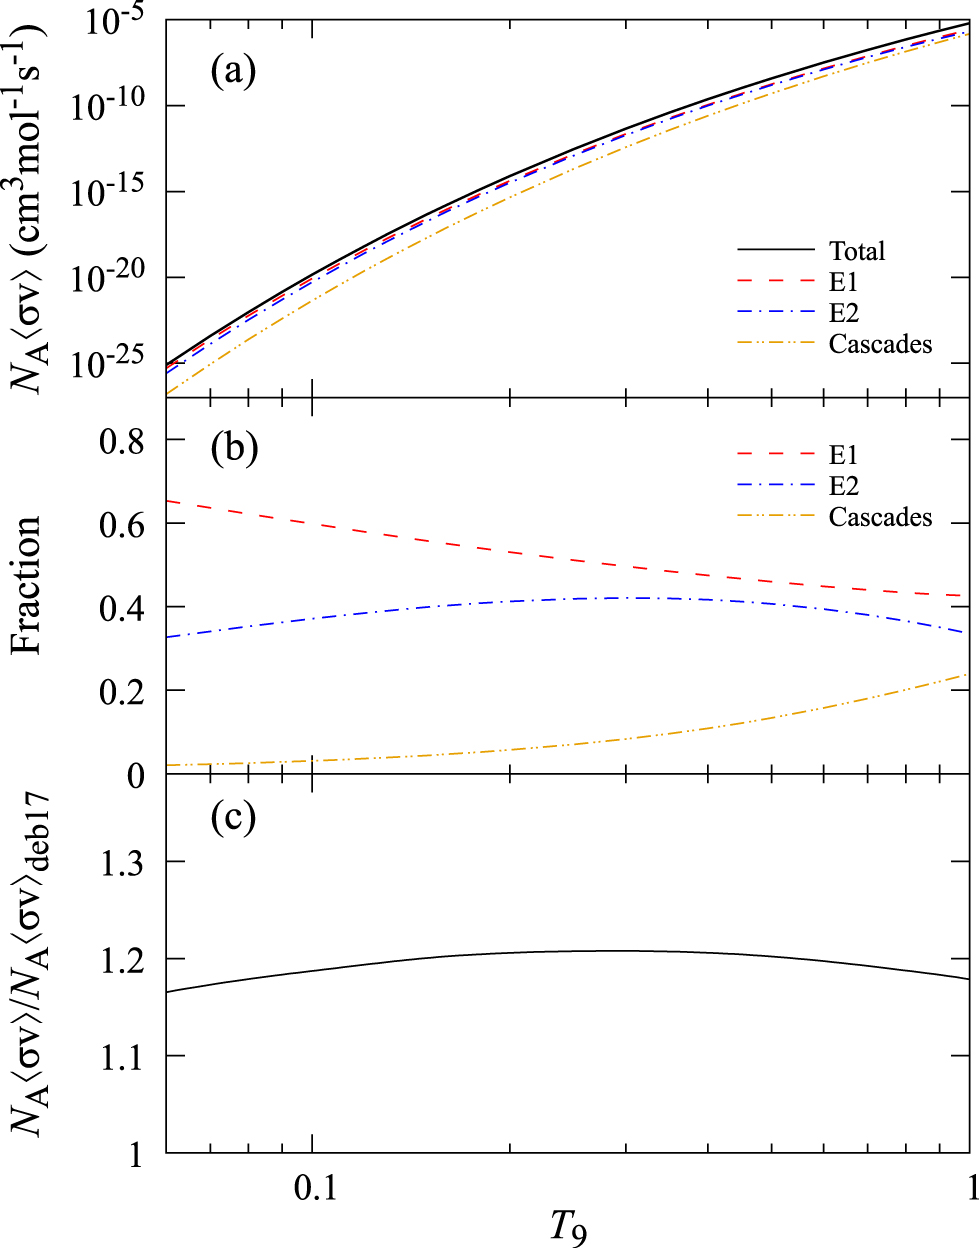
where μ is the reduced mass of the projectile-target system, NA is Avogadros number, kB is the Boltzmann constant, T is the temperature, η is the Sommerfeld parameter, and E is the c.m. energy. In this paper, the reaction rate was calculated by introducing the S factors shown in Figure 6 into Equation (7). The resulting 12C(α, γ)16O reaction rate is tabulated in Table 3 as a function of the temperature parameter T9( = T/109K) and plotted in Figure 7.

Figure 7. (Color online.) The 12C(α, γ)16O reaction rates of the present work. (a) The solid black line is the total reaction rate of the 12C(α, γ)16O. The dashed red, dashed–dotted blue, and dash–double-dotted yellow lines represent the partial rates of the ground-state E1, E2, and cascading components, respectively. (b) The fractions of the E1, E2, and cascades components' contributions to the total reaction rate. (c) The solid black line is the ratio of the present total reaction rate to that of deBoer et al. (2017).
Download figure:
Standard image High-resolution imageTable 3. Reaction Rates of the 12C(α, γ)16O Reaction and the Comparison with deBoer et al. (2017)
| Temperature | Reaction Rate (cm3 s−1 mol−1) | Ratio | |
|---|---|---|---|
| T9 | Present | ||
| 0.06 | 7.90 × 10⁻²⁶ | 6.78 × 10⁻²⁶ | 1.16 |
| 0.07 | 3.85 × 10⁻²⁴ | 3.28 × 10⁻²⁴ | 1.17 |
| 0.08 | 9.43 × 10⁻²³ | 8.00 × 10⁻²³ | 1.18 |
| 0.09 | 1.40 × 10⁻²¹ | 1.18 × 10⁻²¹ | 1.19 |
| 0.1 | 1.42 × 10⁻²⁰ | 1.20 × 10⁻²⁰ | 1.18 |
| 0.11 | 1.08 × 10⁻¹⁹ | 9.03 × 10⁻²⁰ | 1.2 |
| 0.12 | 6.42 × 10⁻¹⁹ | 5.38 × 10⁻¹⁹ | 1.2 |
| 0.13 | 3.17 × 10⁻¹⁸ | 2.65 × 10⁻¹⁸ | 1.2 |
| 0.14 | 1.33 × 10⁻¹⁷ | 1.11 × 10⁻¹⁷ | 1.21 |
| 0.15 | 4.90 × 10⁻¹⁷ | 4.08 × 10⁻¹⁷ | 1.21 |
| 0.16 | 1.61 × 10⁻¹⁶ | 1.34 × 10⁻¹⁶ | 1.21 |
| 0.18 | 1.32 × 10⁻¹⁵ | 1.09 × 10⁻¹⁵ | 1.21 |
| 0.2 | 8.02 × 10⁻¹⁵ | 6.64 × 10⁻¹⁵ | 1.21 |
| 0.25 | 2.94 × 10⁻¹³ | 2.43 × 10⁻¹³ | 1.21 |
| 0.3 | 4.52 × 10⁻¹² | 3.73 × 10⁻¹² | 1.21 |
| 0.35 | 3.96 × 10⁻¹¹ | 3.28 × 10⁻¹¹ | 1.2 |
| 0.4 | 2.36 × 10⁻¹⁰ | 1.96 × 10⁻¹⁰ | 1.2 |
| 0.45 | 1.06 × 10−09 | 8.82 × 10⁻¹⁰ | 1.2 |
| 0.5 | 3.87 × 10−09 | 3.22 × 10−09 | 1.2 |
| 0.6 | 3.23 × 10−08 | 2.70 × 10−08 | 1.2 |
| 0.7 | 1.75 × 10−07 | 1.47 × 10−07 | 1.2 |
| 0.8 | 7.03 × 10−07 | 5.92 × 10−07 | 1.19 |
| 0.9 | 2.27 × 10−06 | 1.92 × 10−06 | 1.18 |
| 1 | 6.24 × 10−06 | 5.30 × 10−06 | 1.17 |
Download table as: ASCIITypeset image
The present 12C(α, γ)16O reaction rates are compared with that of deBoer's in Figure 7(c) (deBoer et al. 2017). One can see that our reaction rate is about 20% larger. The astrophysical implication of this difference will be discussed in the following section.
To meet the format requirements of network models for the reaction rates, a function of the 12C(α, γ)16O reaction rate R(T9) was presented based on the formula form of JINA-REACLIB (Cyburt et al. 2010):
The parameters axy are tabulated in Table 4. This function works within the T9 range of 0.06–10 with an maximum deviation of less than 2%.
Table 4. The Values of the Parameters aij in the Function (Equation (8)) of the 12C(α, γ)16O Reaction Rate
| a0j | a1j | a2j | |
|---|---|---|---|
| ai0 | −2.175 × 10³ | −8.985 × 10² | 5.143 × 10² |
| ai1 | −4.449 × 10² | −1.784 × 10² | −1.528 × 100 |
| ai2 | 3.302 × 10³ | 2.852 × 10³ | 1.434 × 10² |
| ai3 | −7.165 × 10² | −1.842 × 10³ | −7.963 × 10² |
| ai4 | −2.967 × 100 | 5.568 × 101 | 1.683 × 10² |
| ai5 | 5.562 × 10⁻¹ | −2.108 × 100 | −4.066 × 101 |
| ai6 | 9.724 × 10² | 1.347 × 10³ | 2.171 × 10² |
Download table as: ASCIITypeset image
5. Astrophysical Implication on Pair-instability Supernova Black-hole Mass Gap
Energetic photons can create electron-positron pairs if they have an energy exceeding the rest-mass energy of two electrons, this process is called pair production, and the reverse process is electron-positron annihilation. Pair production was first observed in Patrick Blackett's counter-controlled cloud chamber (Blackett & Occhialini 1933), leading to the 1948 Nobel Prize in Physics.
In a massive evolved star, the core temperature is high enough to produce a significant amount of electron-positron pairs from γ-rays. The reduction of γ-ray energy density lowers the radiation pressure that resists gravitational collapse and supports the outer layers of the star. When the adiabatic index Γ1 = dlnP/dlnρ∣S ≤ 4/3 (where P and ρ are the local pressure and density, S is the entropy) happens in the star, it will enter the pair-instability region (Marchant & Moriya 2020; Farmer et al. 2019; Mehta et al. 2022). If the pair-instability eruption blows the star completely apart, it becomes a pair-instability supernova (PISN; Woosley & Heger 2021) without leaving a stellar remnant behind. If the pair-instability eruption sheds only part of the star and undergoes a series of these pulses until it sheds sufficient mass, leaving the mass too small for electron-positron pair creation, finally becoming a core-collapse supernova leaving a BH, the star becomes a pulsational pair-instability supernova (PPISN; Woosley 2017).
The pair-instability evolution was proposed in the latter half of the 1960s by Fowler & Hoyle (1964) and pushed forward by Woosley et al. (2002). Pair-instability is of primary importance and is receiving more and more attention, not only because it makes bulk amounts of newly synthesized matter that is returned to the interstellar medium but also because it provides a check for stellar evolution models and connects gravitational waves and the BH masses detected by the LIGO and Virgo detectors (Acernese et al. 2014; Abbott et al. 2016).
According to the theory of stellar evolution, stars with zero-age main sequence (ZAMS) have masses larger than about 250 M⊙; their core temperatures are high enough to allow endothermic photodisintegration reactions that absorb enough energy to prevent the stars from unbinding (Heger et al. 2003) and leaving behind BHs. Stars with ZAMS mass between about 130 M⊙ and 250 M⊙ will be subject to PISN, while mass between about 100 M⊙ and 130 M⊙ will undergo PPISN (Mehta et al. 2022). Therefore, there may be a BH mass gap because of PISN.
Farmer et al. (2019, 2020) found that the location of the BH mass gap is robust against model uncertainties, but it does depend sensitively on the 12C(α, γ)16O reaction rate. When a massive star burns out the hydrogen in its core, the star will contract, and the central temperature will increase until helium in the core is ignited and transformed to carbon by the 3α reaction (Hoyle 1954). The mixture of the carbon and helium can then burn via the 12C(α, γ)16O reaction to produce oxygen. It is found that lower 12C(α, γ)16O reaction rates increase the core C/O ratio to avoid PISN, and the result is that the lower and upper boundaries of the BH mass gap are increased (Takahashi 2018; Farmer et al. 2019, 2020).
Following the calculation of Farmer et al. (2019, 2020), the 1D open-source MESA stellar evolution code (Paxton et al. 2011, 2013, 2015, 2018, 2019; version r11701) is employed to evolve massive helium stars to probe the influence of the present 12C(α, γ)16O rates to the boundaries of the BH mass gap. The approx21.net is used to do the network calculation. 21 isotopes are included in the network: 1H, 3He, 4He, 12C, 14N, 16O, 20Ne, 24Mg, 28Si, 32S, 36Ar, 40Ca, 44Ti, 48Cr, 52Fe, 54Fe, 56Fe, 56Ni, 56Cr, proton, and neutron. 56Cr is used to set the final electron to baryon ratio value, proton and neutron are from photodisintegration reactions that participate only in reactions that neutronize material in. The network also includes alpha chain reactions of the 21 isotopes and compound reactions to follow (α, γ) and (p, γ) reactions assuming that the intermediate isotope is in a steady-state equilibrium (Timmes 1999; Timmes et al. 2000). The initial composition used in this study is Z = 10−5 by normalization of the values given by Asplund et al. (2009), and the initial 4He mass fraction of 0.99999 is used to create helium stars. Mehta et al. (2022) pointed out that some factors could influence the BH mass gap calculations. These factors include the number of the temperature point reaction rate, the mass resolution, and the time resolution. In our network calculations, the mass resolution is doubled, and the time resolution is increased by a factor of 2.5 comparing with the calculation of Farmer et al. (2020) as Mehta et al. (2022) did.
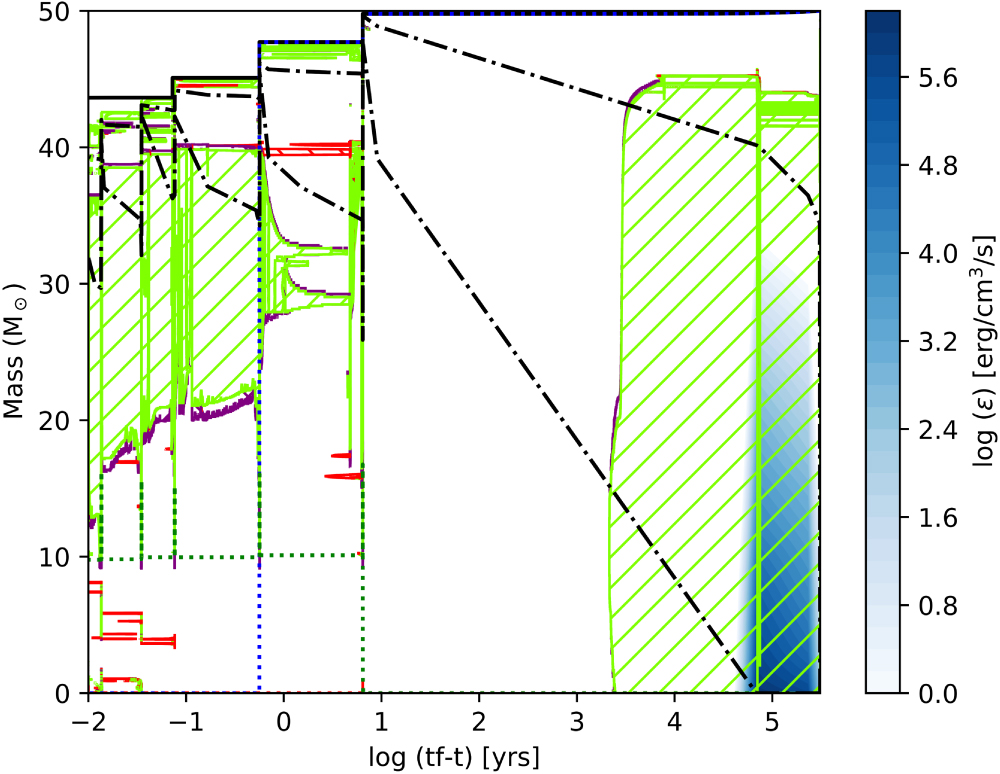
Figure 8 shows the Kippenhahn diagram of a 50 M⊙ star with the energy released by the 12C(α, γ)16O reaction on a color logarithmic scale. The energy released by the 12C(α, γ)16O reaction increases with the evolution time at the beginning of the evolution because of the increasing of 12C, and then it decreases because of the decreasing of 4He. One can see that the 12C(α, γ)16O reaction is important between 0.1 and 0.4 GK where the present 12C(α, γ)16O reaction rate is about 20% larger than the reaction rate of deBoer et al. (2017).

Figure 8. (Color online.) Kippenhahn diagram for a 50 M⊙ star. The green shaded areas correspond to areas of convection. The cyan shaded areas correspond to overshooting. The red shaded areas correspond to semiconvection. The blue dotted line indicates the hydrogen-depleted core, or helium core, where the hydrogen mass fraction is below 0.01, and the 4He mass fraction is above 0.1. The green dotted line indicates the same with the blue dotted line but with carbon and oxygen. The black dashed–dotted lines are edge of the temperature between 0.1 and 0.4 GK. The blue color scale shows the log function of the 12C(α, γ)16O reaction energy production in unit of ergs per gram per second as a function of the mass coordinate and time.
Download figure:
Standard image High-resolution imageThe calculated BH masses as a function of the initial helium core mass are shown in Figure 9, together with the masses of the BH from the first, second, and third Gravitational-Wave Transient Catalogs (GWTC1, GWTC2, and GWTC3). The model parameters used by us are those of Mehta et al. (2022), and a temperature grid that is similar to that of Mehta et al. (2022) is employed by us. One can see that the present reaction rate decreases the lower and upper edges of the BH mass gap by about 12% and 5%, respectively. This calculation confirms the results of Farmer et al. (2020), Mehta et al. (2022) that the boundaries of the BH mass gap decreases as the 12C(α, γ)16O reaction rate increases. The existence of the low boundary of the BH mass gap have been challenged by the discovery of several BHs, which distribute in the forbidden gap (Abbott et al. 2020a, 2020b; The LIGO Scientific Collaboration et al. 2021). Our result will certainly simulate future work to explain the BHs observed in the forbidden gap, such as considering the effects of rotation (Marchant & Moriya 2020) or super-Eddington accretion (van Son et al. 2020).

Figure 9. The BH masses as a function of the initial helium core mass with respect to the updated 12C(α, γ)16O reaction rate. The blue dots with line represent the results using the rates from deBoer et al. (2017), Mehta et al. (2022), and the green dots with the line represent the results using our new rates. Their boundaries of the BH mass gap are presented by the blue dashed–dotted lines and green dotted lines, respectively. Mehta et al. (2022) did not give the upper part of the BH masses' function but only the upper boundary of it. The right panel shows the masses of the BH from the first, second, and third Gravitational-Wave Transient Catalogs (GWTC1, GWTC2, and GWTC3) with the restriction that the median estimated mass of the primary is ≥10 M⊙, with their 90% confidence intervals (Abbott et al. 2019, 2020a; The LIGO Scientific Collaboration et al. 2021).
Download figure:
Standard image High-resolution image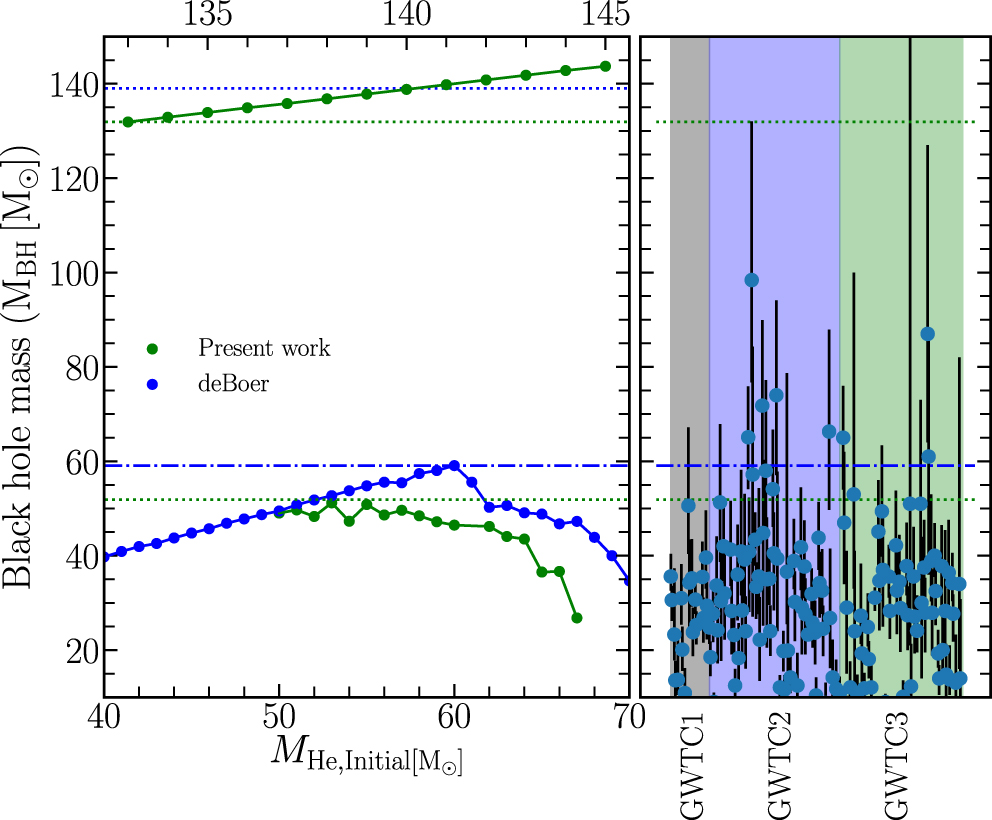
6. Conclusion
In this paper, the ANC for the 16O GS is measured through the 12C(11B, 7Li)16O transfer reaction using the Q3D magnetic spectrograph. The existing discrepancy of more than 2 orders of magnitude between the previously reported GS ANC values is solved. This ANC is employed to determine the astrophysical S-factor and the stellar rate of the 12C(α, γ)16O reaction. The total reaction rate is increased by about 20% within the temperature range of astrophysical relevance compared with that of the previous review.
Following the calculation of Farmer et al. (2019, 2020), the MESA code was employed to evolve massive helium stars to determine the dependence of the updated 12C(α, γ)16O rate on the boundaries of the BH mass gap. Our result shows that the updated 12C(α, γ)16O reaction rate decreases the lower and upper edges of the BH mass gap about 12% and 5%, respectively. Our result will stimulate new works to explain the BHs observed in the forbidden gap.
This work was supported by the National Key Research and Development Project under grant No. 2022YFA1602301, the National Natural Science Foundation of China under grants Nos. 12125509, 12222514, 12175152, 12005304, 11961141003, and U1867214, the CAST Young Talent Support Plan, the CNNC Science Fund for Talented Young Scholars, and the Basic Scientific Research Program under grant No. JCKY2020201C002. R.J.D. utilized resources from the Notre Dame Center for Research Computing and was supported by the National Science Foundation through grant Nos. PHY-1713857 and PHY-2011890, and the Joint Institute for Nuclear Astrophysics through grant No. PHY-1430152 (JINA Center for the Evolution of the Elements).