


Abstract
We present Karl G. Jansky Very Large Array K-band (19 GHz) observations of the redshifted CO(1–0) line emission toward the radio galaxy TN J0924−2201 at z = 5.2, which is one of the most distant radio galaxies with CO detected. With an angular resolution of ∼2'', the CO(1–0) line emission is resolved into three clumps, within ±500 km s−1 relative to its redshift, which is determined by Lyα. We find that the clumps are located off-center and 12–33 kpc away from the center of the host galaxy, which has counterparts in the Hubble Space Telescope i band, Spitzer/IRAC, and the Atacama Large Millimeter/submillimeter Array (ALMA) band 6 (230 GHz; 1.3 mm). With the ALMA detection, we estimate the infrared luminosity LIR and the star formation rate (SFR) of the host galaxy to be (9.3 ± 1.7) × 1011L⊙ and 110 ± 20 M⊙ yr−1, respectively. We also derive the 3σ upper limit of  M⊙ at the host galaxy. The detected CO(1–0) line luminosities of the three clumps,
  = (3.2–4.7) × 1010 K km s−1 pc2, indicate the presence of three massive molecular gas reservoirs, with
  = (2.5–3.7) × 1010 M⊙, assuming a CO-to-H2 conversion factor of αCO = 0.8
  , although the SFR is not elevated due to the nondetection of the ALMA 1.3 mm continuum (SFR < 40 M⊙ yr−1). From the host galaxy, the nearest molecular gas clump, labeled "clump A," is apparently in alignment with the radio jet axis, showing radio–CO alignment. The origins of these three clumps around TN J0924–2201 can possibly be interpreted as outflows, mergers, or jet-induced metal enrichment.
Export citation and abstract BibTeX RIS

Original content from this work may be used under the terms of the Creative Commons Attribution 4.0 licence. Any further distribution of this work must maintain attribution to the author(s) and the title of the work, journal citation and DOI.
1. Introduction
High-redshift radio galaxies (HzRGs) are the most massive (stellar mass M* ≳ 1011
M⊙) galaxies in the early universe, with characteristic powerful radio jets (radio luminosity L500MHz > 1027 W Hz−1) at z ≳ 2 (see Miley & De Breuck 2008 for a review). In contrast to local quiescent massive galaxies, HzRGs are actively star-forming, lying either on or below the star-forming main sequence (Drouart et al. 2014; Falkendal et al. 2019). Comparing with other populations of galaxies, HzRGs show high star formation efficiencies (SFEs) of 100–102 Gyr−1, short depletion times of 100–10−2 Gyr (Man et al. 2019), and low molecular gas fractions  , where
  is the molecular gas mass (see Figure 1).
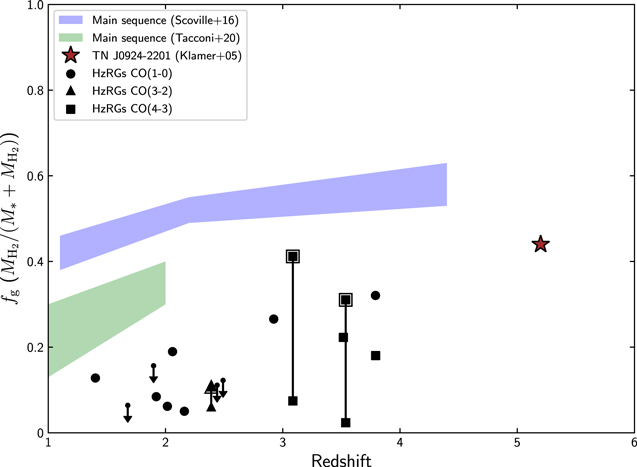
Figure 1. The molecular gas fraction fg of HzRGs at different redshifts. The blue and green shaded areas show the star-forming main sequences from Scoville et al. (2016) and Tacconi et al. (2020), respectively. The stellar masses of the main sequences here are >1011 M⊙, which are similar to HzRGs. The black symbols show HzRGs in the literature (Papadopoulos et al. 2000; Greve et al. 2004; De Breuck et al. 2005; Papadopoulos et al. 2005; Emonts et al. 2013, 2014; Gullberg et al. 2016). The circles, triangles, and squares represent observations based on CO(1−0), CO(3−2), and CO(4−3), respectively, including 3σ upper limits. Those with large open square and triangle symbols are assumed to have M* = 1011 M⊙, when deriving their possible range of fg. The vertical lines between symbols show the range of fg: the lower limits are derived from the upper limits of their M*, and the higher values are derived by assuming M* = 1011 M⊙. The stellar masses of the HzRGs are from De Breuck et al. (2010). The star symbol indicates the z = 5.2 radio galaxy TN J0924 (derived from unresolved CO(1–0); Klamer et al. 2005).
Download figure:
Standard image High-resolution imageRegarding the molecular gas mass measurements, as CO(1–0) line emission is one of the most convincing tracers of molecular gas, Emonts et al. (2013) have reported the CO(1–0) detection in an HzRG at z ∼ 2 and Emonts et al. (2014) have conducted a CO(1–0) survey of z ∼ 2 HzRGs, to measure the amount of molecular gas in HzRGs. They found that HzRGs with stellar masses M* ∼ 1011–1012
M⊙ have molecular gas masses  –1011
M⊙. At z ∼ 3–4, there are also several studies that have estimated the molecular gas masses of HzRGs by observing the CO(1–0), CO(3–2), or CO(4–3) (Papadopoulos et al. 2000; Greve et al. 2004; De Breuck et al. 2005; Papadopoulos et al. 2005; Gullberg et al. 2016). Combining these measurements of the molecular gas masses in the literature with the estimation of the stellar masses from De Breuck et al. (2010), the molecular gas fraction of HzRGs at z ∼ 2 is measured as ranging from a few percent to 20%, which is much lower than that of the star-forming main sequence with M* ∼ 1011
M⊙, in the same redshift range (Scoville et al. 2016; see Tacconi et al. 2018, 2020 for reviews). Also, the molecular gas fraction of HzRGs at z ∼ 3–4 is ∼0.2–0.3, lower than that of the main sequence with M* ∼ 1011
M⊙, as well (Figure 1).
–1011
M⊙. At z ∼ 3–4, there are also several studies that have estimated the molecular gas masses of HzRGs by observing the CO(1–0), CO(3–2), or CO(4–3) (Papadopoulos et al. 2000; Greve et al. 2004; De Breuck et al. 2005; Papadopoulos et al. 2005; Gullberg et al. 2016). Combining these measurements of the molecular gas masses in the literature with the estimation of the stellar masses from De Breuck et al. (2010), the molecular gas fraction of HzRGs at z ∼ 2 is measured as ranging from a few percent to 20%, which is much lower than that of the star-forming main sequence with M* ∼ 1011
M⊙, in the same redshift range (Scoville et al. 2016; see Tacconi et al. 2018, 2020 for reviews). Also, the molecular gas fraction of HzRGs at z ∼ 3–4 is ∼0.2–0.3, lower than that of the main sequence with M* ∼ 1011
M⊙, as well (Figure 1).
In terms of the HzRGs with CO detections, Emonts et al. (2014) have reported that in several CO(1–0)-detected HzRGs, the CO line emission is spatially offset from the galaxy centers (i.e., off-center CO) and located along the radio jet axis (i.e., radio–CO alignment). They found marginal statistical significance that such radio–CO alignment is present in HzRGs. In addition to mergers, some causal connections between the jets and the gas reservoirs have also been suggested. For instance, jet-induced star formation, an important physical process in positive feedback, appears to be related to these spatial properties (e.g., Klamer et al. 2004; Emonts et al. 2014).
TN J0924−2201 (hereafter, TN J0924) is one of the most distant radio galaxies, at z = 5.1989, as determined by the measurement of Lyα (van Breugel et al. 1999). Klamer et al. (2005) have reported detections of CO(1–0) and CO(5–4) line emissions, and a corresponding massive (1011
M⊙) molecular gas reservoir, in TN J0924, using the Australia Telescope Compact Array (ATCA). They found that the CO(1–0) emission shows a tentative spatial offset of ∼4 5 north of the nucleus of TN J0924, although the spatial offset is smaller than the beam size of 145 × 101. On the other hand, the CO(5–4) emission shows a tentative spatial offset of ∼28 south of the radio galaxy. The offset is also less than the beam size. In addition, in combination with the stellar mass of 1011.1
M⊙, estimated with mid-IR data by De Breuck et al. (2010), the molecular gas fraction of TN J0924 can be derived as 0.44, which is high for HzRGs (Figure 1). As TN J0924 is the only CO-observed HzRG at z ∼ 5, showing many of the intriguing properties mentioned above, we have conducted further CO(1–0) observations of TN J0924 with the Karl G. Jansky Very Large Array (VLA), to investigate the distribution of the associated molecular gas and the reason why the molecular gas fraction of this object is apparently high. We here present our new VLA observations of TN J0924, which provide the highest–spatial resolution CO(1–0) imaging, reaching ∼2''. We also use archival Atacama Large Millimeter/submillimeter Array (ALMA) data in this work, to constrain the rest-frame far-IR properties of the system. In Section 2, we describe the observations and data. The results are shown in Section 3. We discuss the results in Section 4, and we conclude in Section 5. Throughout this paper, we assume a standard ΛCDM cosmology, with H0 = 70 km s−1
M pc−1, ΩM = 0.3, and ΩΛ =0.7. At z = 5.2, 1'' corresponds to ∼6.2 kpc.
5 north of the nucleus of TN J0924, although the spatial offset is smaller than the beam size of 145 × 101. On the other hand, the CO(5–4) emission shows a tentative spatial offset of ∼28 south of the radio galaxy. The offset is also less than the beam size. In addition, in combination with the stellar mass of 1011.1
M⊙, estimated with mid-IR data by De Breuck et al. (2010), the molecular gas fraction of TN J0924 can be derived as 0.44, which is high for HzRGs (Figure 1). As TN J0924 is the only CO-observed HzRG at z ∼ 5, showing many of the intriguing properties mentioned above, we have conducted further CO(1–0) observations of TN J0924 with the Karl G. Jansky Very Large Array (VLA), to investigate the distribution of the associated molecular gas and the reason why the molecular gas fraction of this object is apparently high. We here present our new VLA observations of TN J0924, which provide the highest–spatial resolution CO(1–0) imaging, reaching ∼2''. We also use archival Atacama Large Millimeter/submillimeter Array (ALMA) data in this work, to constrain the rest-frame far-IR properties of the system. In Section 2, we describe the observations and data. The results are shown in Section 3. We discuss the results in Section 4, and we conclude in Section 5. Throughout this paper, we assume a standard ΛCDM cosmology, with H0 = 70 km s−1
M pc−1, ΩM = 0.3, and ΩΛ =0.7. At z = 5.2, 1'' corresponds to ∼6.2 kpc.
2. Observations and Data
2.1. VLA Observations
Our VLA K-band observations of TN J0924 were conducted in semester 20A (Project ID: 20A-303; PI: K. Lee), as part of the observations of seven HzRGs at z > 4.5 (K. Lee et al. 2023, in preparation). The observations were conducted with 27 antennas in the C-array configuration, with the baseline length ranging from 45 m to 3.4 km. The primary calibrator (bandpass and amplitude) was 3C138 and the secondary calibrator (phase) was J0921–2618. Three executions, in scheduling blocks lasting for 140 minutes, were carried out on 2020 February 16, 25, and March 7, resulting in a total on-source integration time of 300 minutes.
The K-band receiver was tuned to cover the frequency of the redshifted CO(1–0) line, which was estimated from the Lyα redshift. We noted that the CO(1–0) line emission is redward of zLyα , with a velocity offset of ∼150 km s−1 (Klamer et al. 2005). The total bandwidth was 2 GHz, covering 18.09 to 20.11 GHz. It was divided into 16 spectral windows, with bandwidths of 128 MHz, and the spectral resolution was 2 MHz (∼32 km s−1). In the VLA data, there are small spectral gaps between the spectral windows, where the sensitivity drops. One of the gaps between two spectral windows, which is 6 MHz wide, is located close to the targeted frequency of the redshifted CO(1–0) (18.5954 GHz). Three channels (18.5977–18.6037 GHz) at the edges of the spectral windows need to be flagged out. This leads to a blank spectral region, with a width of ∼96 km s−1, in the spectrum close to zLyα . Basic information about TN J0924 and descriptions of our VLA observations are summarized in Table 1.
Table 1. VLA Observations
| TN J0924–2201 | |
|---|---|
| R.A. (J2000) | 09h24m19 90 90 |
| Decl. (J2000) | −22°01'414 |
| zLyα | 5.1989 |
| Baseline (m) | 45–3400 |
| On-source time (min) | 300 |
| Primary calibrator | 3C138 |
| Secondary calibrator | J0921–2618 |
| Frequency coverage (GHz) | 18.09–20.11 |
| 2020-2-16 | |
| Date | 2020-2-25 |
| 2020-3-07 | |
Note. This is the optical peak position (identified from the HST/ACS i-band image—see Figure 8).
Download table as: ASCIITypeset image
The data reduction was performed with the Common Astronomy Software Applications (CASA; CASA Team et al. 2022), version 5.6.1, in the standard manner. All the images were produced with the CASA task tclean. The continuum map was produced with the deconvolver mtmfs, being cleaned down to the 5σ level, with nterms = 2, because the ratio of the bandwidth to the frequency is relatively large. A Briggs weighting with robust = 0.5 was applied. The synthesized beam size was 18 × 09 (with position angle or PA = −6°7). The rms noise level was 4.3 μJy beam−1. To obtain spectral cubes, we used the CASA task uvcontsub to subtract the continuum. All the channels were used for the fit, and we set fitorder = 1. We then applied tclean on the continuum-subtracted measurement set, with the deconvolver hogbom. We did not clean the cube, because after the subtraction of the continuum, there were no strong sources in the data cube. A Briggs weighting with robust = 2.0 was applied. We adopted a native spectral resolution of 2 MHz, corresponding to a velocity resolution of ∼32 km s−1. Our spectral cubes were produced at two different synthesized beam sizes, one being 23 × 12 (PA = –7°0) and the other being 44 × 23 (PA= –7°0), and they were smoothed using imsmooth, with the resulting rms noise levels being 46.8 μJy beam−1 channel−1 and 66.2 μJy beam−1 channel−1, respectively, where one channel corresponds to ∼32 km s−1. The pixel scales of all the VLA images were set to 03. Descriptions of the images are summarized in Table 2.
Table 2. VLA and ALMA Images
| VLA Continuum Map | |
|---|---|
| Central frequency (GHz) | 19 |
| Beam size | 1 8×0 9 |
| PA | –6°7 |
| rms noise (μJy beam−1) | 4.3 |
| VLA Spectral Cube | |
| Beam size | 2 3×1 2 |
| PA | –7°0 |
| rms noise (μJy beam−1 channel−1) | 46.8 |
| Beam size | 4 4×2 3 |
| PA | –7°0 |
| rms noise (μJy beam−1 channel−1) | 66.2 |
| ALMA Continuum Map | |
| Central frequency (GHz) | 230 |
| Beam size | 1 6×1 0 |
| PA | –81°6 |
| rms noise (μJy beam−1) | 58.9 |
Note. In VLA spectral cubes, one channel is ∼32 km s−1.
Download table as: ASCIITypeset image
2.2. ALMA Data
The archival millimeter-wave data are from ALMA band 6 observations (Project ID: 2013.1.00039.S). The on-source integration time was about 8 minutes. The total bandwidth was 7.5 GHz, covering 221.60 to 238.48 GHz (∼230 GHz, corresponding to a wavelength of ∼1.3 mm). It was divided into four spectral windows, with bandwidths of 1.875 GHz. Since the data reduction had to be run with the ALMA pipeline that is included in the older CASA versions 4.2 or 4.3, we requested to support with the data reduction from the East Asian ALMA Regional Center. After receiving the calibrated measurement set, we used CASA version 6.2.0 to perform further analysis. We used the CASA task tclean, with the deconvolver hogbom, cleaning down to the 3σ level, to obtain the continuum image. A Briggs weighting with robust = 2.0 was applied. The synthesized beam size was 16 × 10 (PA = −81°6). The rms noise level was 43.1 μJy beam−1. The pixel scale was set to 01. The details of the ALMA continuum image are summarized in Table 2.
3. Results
3.1. CO(1–0) Line and 19 GHz Continuum
Figure 2 shows the velocity-integrated (moment-0) CO(1–0) images and the flux-weighted velocity distributions (moment 1) of the CO(1–0) line. We integrated the velocity from 0 to 500 km s−1 in the spectral cubes, to produce the moment images, using the CASA task immoments. Two sets of images, with different angular resolutions of 44 and 23, are shown. The images with a larger beam size of 44 are shown in comparison to the ATCA detection reported by Klamer et al. (2005). We used a 2D Gaussian fit to estimate the velocity-integrated intensity of the CO(1−0) line. The velocity-integrated intensity of the CO(1−0) line from our 44 image is 0.078 ± 0.016 Jy km s−1, which is comparable to the ATCA result, 0.087 ± 0.017 Jy km s−1, and the resulting molecular gas mass is comparable as well. The peak of the CO(1–0) emission at 44 resolution is ∼4, offset from the optical position of TN J0924. Klamer et al. (2005) have tentatively reported that the CO(1–0) emission appears to be 45 offset to the north, from the center of the host galaxy, with a ∼10 beam. Our results confirm that the spatial offsets between CO(1–0) and the nucleus of the galaxy exist, although they are generally to the southwest. However, these are similar to the earlier result for CO(5–4), which is ∼28 offset to the south. This is reasonable, since the beam size of their CO(5–4) observation is about 5, which is smaller than the 10 beam of their CO(1–0) observation.

Figure 2. The velocity-integrated (moment-0) CO(1–0) images and the flux-weighted velocity distributions (moment 1) of the CO(1–0) line. The two panels to the left show the moment-0 images, with the white contours indicating 3σ and 4σ, where, in the upper and lower images, 1σ = 0.014 Jy beam−1 km s−1 and 1σ = 0.010 Jy beam−1 km s−1, respectively. The two panels to the right show the moment-1 images, with 1σ cutoff. The integration range of the velocity is 0–500 km s−1. The upper two panels show the images with a beam size of ∼4''4, while the bottom two panels show the images with a beam size of ∼2''3. The white and black crosses indicate the optical position that is considered to be the galaxy center of TN J0924. The red and blue crosses in the two panels to the left indicate the peaks of CO(1–0) and CO(5–4), respectively, from Klamer et al. (2005). The ellipses in the bottom left corners of each image show the synthesized beams. In the bottom left image, the white letters "A," "B," and "C" indicate clumps A, B, and C, respectively.
Download figure:
Standard image High-resolution imageFrom the moment-0 images with a 44 beam, the CO(1–0) emission is elongated in the north–south direction, similar to the shape of the beam, but it also appears to be partially resolved. In the image with the 23 beam, the CO(1–0) emission is resolved into three clumps: we label them clumps A, B, and C, from north to south.
Given the moment-1 (with 1σ cutoff) images, which suffered from low signal-to-noise ratios (S/Ns), it is difficult to tell the motions of the three clumps. In the images with either a 44 beam or a 23 beam, it appears that the velocity distribution is centered around 300 km s−1, with little dispersion. Nevertheless, we require deeper CO observations to study the velocity structure of the system.
Figure 3 shows the detected CO(1–0) line in the spectral cube with a beam size of 44. The S/N of the peak is 4.6. The dark shaded areas in Figure 3 show the data blanks in our spectrum, due to the sensitivity drops between the spectral windows, as mentioned in Section 2.1. Nonetheless, since the detection appears redward of zLyα
, and the fluxes close to the blank channels are negative, we do not consider the blank region to affect the significance of the CO(1–0) detection in our data.
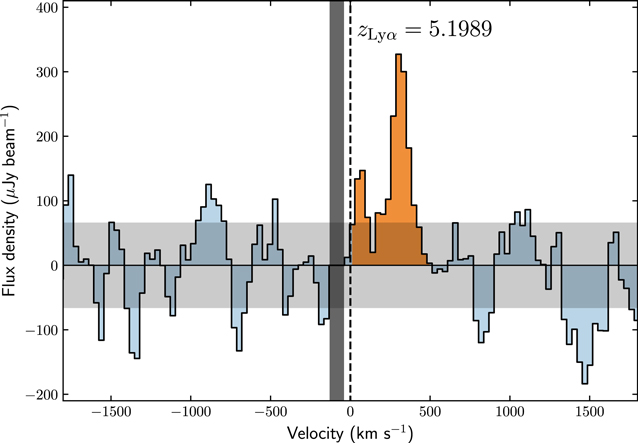
Figure 3. The CO(1–0) spectrum of TN J0924 in a spectral cube with a beam size of 44. The dashed line indicates the redshift zLyα
= 5.1989, as derived from Lyα (van Breugel et al. 1999). The orange area shows the velocity range that we integrated to produce the velocity-integrated map. The lightly shaded area indicates the 1σ noise level, while the darkly shaded areas represent the blank regions in the data. The spectrum is extracted from the peak of the emission.
Download figure:
Standard image High-resolution imageAs Klamer et al. (2005) have reported, the detection of CO(1–0) is redward of zLyα
, and two kinematic features are apparent in the spectrum. However, the brighter dominant component that we find is centered at v = 300 km s−1, which is similar to the weaker feature that Klamer et al. (2005) reported, but ∼150 km s−1 redder than the dominant feature that they found. On the other hand, the weaker feature in our spectrum, centered at v = 100 km s−1, is ∼50 km s−1 bluer than their dominant feature. We treated both of the features as detections, and integrated them over 0–500 km s−1, to produce the velocity-integrated map. For a comparison, we also smoothed our VLA data to the ATCA beam size of 145 × 101, finding that the peak flux density of the signal is ∼0.5 mJy beam−1, which is consistent with the ATCA result from Klamer et al. (2005). The stronger line feature is still on the red side, though, and it has the same spatial location as analyzed with our VLA data cubes at higher angular resolutions. However, the S/N only reaches ∼2 (1σ noise, ∼0.25 mJy beam−1) when we smooth the data to 145 × 101.
Figure 4 shows the spectra of clumps A, B, and C. The CO(1–0) line in each clump generally peaks at v = 300 km s−1, which is consistent with the velocity of the dominant component at an angular resolution of 44 (Figure 3). We find that in clump A, although there is a blank region in the spectrum, the detection of the CO(1–0) appears to be broader than those in clumps B and C. To obtain the highest S/Ns for each of the clumps on the velocity-integrated maps, we applied different ranges of velocity for integration, since there were some velocity differences between the three clumps. In clump A, the flux within the data blank is integrated as zero.
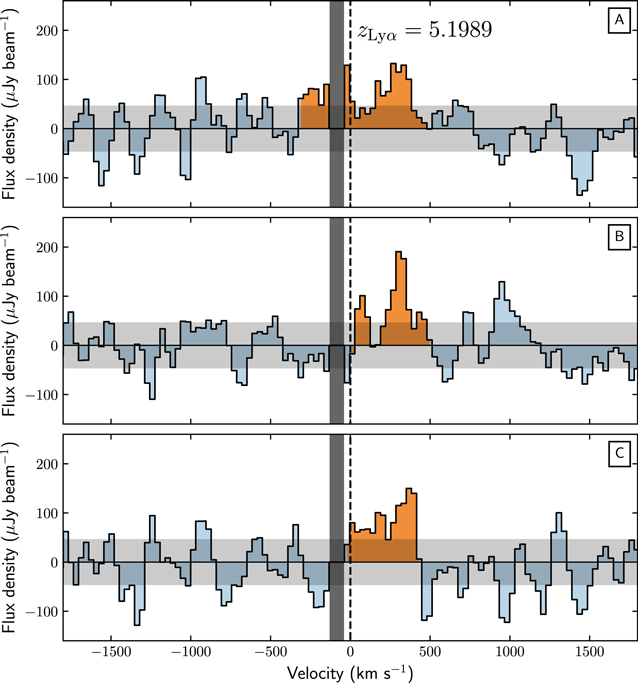
Figure 4. The CO(1–0) spectra of TN J0924 in a spectral cube with a beam size of 23. The upper, middle, and lower panels show the spectra of clumps A, B, and C, respectively. The dashed line indicates the redshift zLyα
= 5.1989 derived from Lyα (van Breugel et al. 1999). The orange areas show the velocity range that we integrated to produce the velocity-integrated map. The lightly shaded areas indicate the 1σ noise level, while the darkly shaded areas represent the blank regions in the data. The spectra are extracted from the peaks of the emissions in each region.
Download figure:
Standard image High-resolution imageFigure 5 shows spatial distributions of the 19 GHz continuum image and the CO(1–0) velocity-integrated emission with a 23 beam. There are apparent spatial offsets between the continuum emission and the CO(1–0) line emissions.

Figure 5. Colored 19 GHz continuum map, with the CO(1–0) velocity-integrated emission from a 23 beam size overlaid in yellow. The yellow contours indicate 3σ and 4σ, where, for clumps A, B, and C, 1σ = 0.013 Jy beam−1 km s−1, 1σ = 0.010 Jy beam−1 km s−1, and 1σ = 0.013 Jy beam−1 km s−1, respectively. The white contours indicate 10σ, 20σ, 40σ, and 70σ, where 1σ = 4.3 μJy. The dashed contours show –3σ. The white cross indicates the optical position. The white dotted line indicates the jet axis. The ellipses in the bottom left corner show the synthesized beams, which correspond to the continuum map and the CO(1–0) velocity-integrated emission, in white and yellow, respectively. The white letters "A," "B," and "C" indicate the clumps A, B, and C, respectively. The integration velocity range of each clump is shown in orange in Figure 4.
Download figure:
Standard image High-resolution imageThe 19 GHz continuum is considered to be dominated by nonthermal synchrotron emission from the radio jet. It is partially resolved into two components—east and west. We used a 2D Gaussian fit to estimate the integrated flux on each side. The peak and the integrated flux density of the eastern component are 0.333 ± 0.004 mJy and 0.451 ± 0.030 mJy, respectively, which are brighter than those of the western component, with a peak and an integrated flux density of 0.206 ± 0.004 mJy and 0.347 ± 0.015 mJy, respectively. The uncertainty is from the 2D Gaussian fit. We also smoothed the continuum image to 145 × 101, giving an integrated flux density of 0.715 ± 0.038 mJy, which is well consistent with the measurement reported by Klamer et al. (2005). The radio jet axis is in the east–west direction, almost aligning with clump A. Therefore, besides the confirmation of the off-center CO, we also observe the radio–CO alignment in TN J0924 for the first time.
The velocity-integrated flux densities of the CO(1–0) emission ICO(1−0) at clumps A, B, and C are 0.050 ± 0.008 Jy km s−1, 0.034 ± 0.006 Jy km s−1, and 0.039 ± 0.006 Jy km s−1, respectively. The uncertainty is from the 2D Gaussian fit. The corresponding CO line luminosities  of clumps A, B, and C are (4.7 ± 0.7) × 1010 K km s−1 pc2, (3.2 ± 0.5) × 1010 K km s−1 pc2, and (3.7 ± 0.5) × 1010 K km s−1 pc2, respectively. These physical properties and the spatial offsets between the three clumps and the nucleus, which is assumed to be located at the optical peak (R.A. 09h24m1990, decl. −22°01'414), are summarized in Table 3. On the other hand, given the assumption that the full width at zero intensity (FWZI) of the line emission is 500 km s−1, the 3σ upper limit for nondetection is 1.7 × 10¹⁰ K km s−1 pc2.
Table 3. Physical Properties of the Observed CO(1–0) Line Emission
| Clump A | Clump B | Clump C | |
|---|---|---|---|
| R.A. (J2000) | 09h24m1977 | 09h24m1979 | 09h24m1990 |
| Decl. (J2000) | −22°01'423 | −22°01'450 | −22°01'468 |
| ΔR.A. a (arcsec) | −1.8 | −1.5 | +0.0 |
| Δdecl. b (arcsec) | −0.9 | −3.6 | −5.4 |
| Peak (μJy beam−1) | 132.3 ± 46.8 | 190.6 ± 46.8 | 149.9 ± 46.8 |
| Velocity width c (km s−1) | 840 | 500 | 450 |
| ICO(1−0) d (Jy km s−1) | 0.050 ± 0.008 | 0.034 ± 0.006 | 0.039 ± 0.006 |
 (K km s−1 pc2) (K km s−1 pc2) | (4.7 ± 0.7) × 1010 | (3.2 ± 0.5) × 1010 | (3.7 ± 0.5) × 1010 |
 e
(M⊙)
e
(M⊙) | (3.7 ± 0.6) × 1010 | (2.5 ± 0.4) × 1010 | (3.0 ± 0.4) × 1010 |
Notes.
a Relative to R.A. 09h24m1990, where the optical peak is.
b
Relative to decl. −22°01'414, where the optical peak is.
c
Referring to the FWZI.
d
The uncertainty is from the 2D Gaussian fit.
e
Corresponding to αCO = 0.8  .
.Download table as: ASCIITypeset image
3.2. ALMA 1.3 mm Continuum
Figure 6 shows the ALMA band 6 (230 GHz; 1.3 mm) continuum image. The source at the center is considered to be the thermal dust emission from the host galaxy of TN J0924. The peak flux is 0.35 ± 0.059 mJy beam−1 and the integrated flux is 0.64 ± 0.12 mJy.
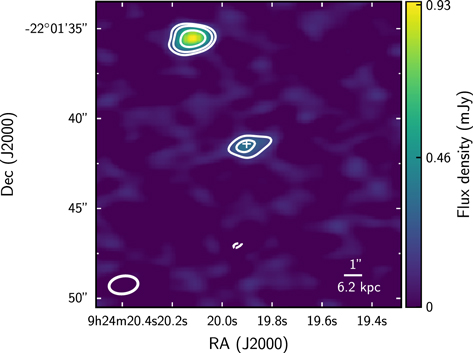
Figure 6. Colored ALMA band 6 continuum image. The white contours indicate 3σ, 5σ, and 10σ, where 1σ = 58.9 μJy. The dashed contours show −3σ. The white cross indicates the optical position. The ellipse in the bottom left corner shows the synthesized beam.
Download figure:
Standard image High-resolution imageA source is located to the north of TN J0924, with a peak flux of 0.94 ± 0.059 mJy beam−1 and an integrated flux of 1.12 ± 0.090 mJy. No line emission is obtained at its position from our VLA data, and there is no Lyα detection in Venemans et al. (2004). It has a mid-IR counterpart in the IRAC 3.6 μm image, showing an integrated flux of 37.3 ± 0.4 μJy. The measured 3.6 μm to 1.3 mm flux ratio, 3.3 × 10⁻², seems to suggest a redshift lower than that of TN J0924 (Yamaguchi et al. 2019). Further constraints are needed to see whether the northern 1.3 mm continuum source is part of the overdensity in the TN J0924 field at z = 5.2.
3.3. Spectral Energy Distribution
Figure 7 shows the spectral energy distribution (SED) of TN J0924. The observational data points are from Spitzer/IRAC, IRS, MIPS (De Breuck et al. 2010), Herschel/PACS, SPIRE (Drouart et al. 2014), JCMT/SCUBA (Reuland et al. 2004), WSRT, VLA (De Breuck et al. 2000; Falkendal et al. 2019), ALMA (Falkendal et al. 2019), and this work (VLA and ALMA). From the extrapolation of the power law with the spectral index α = −1.7 (assuming Sν ∝ να ), which is derived from the fluxes at 365 MHz and 19 GHz, the nonthermal synchrotron emission is estimated to be about 2% of the flux density of 0.64 ± 0.117 mJy observed from ALMA band 6 (230 GHz). Therefore, we can confidently consider that the observed flux at 230 GHz is dominated by the thermal dust emission.
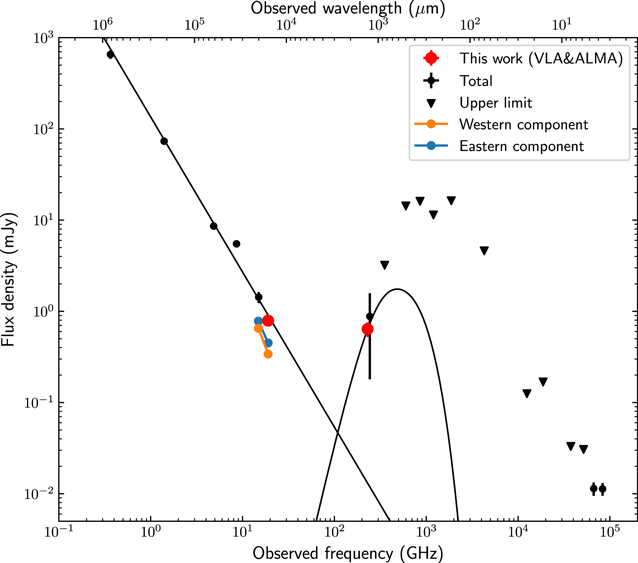
Figure 7. SED of TN J0924. The black dots and downward triangles represent the total flux densities and 3σ upper limits, respectively, from IRAC, IRS, MIPS (De Breuck et al. 2010), PACS, SPIRE (Drouart et al. 2014), SCUBA (Reuland et al. 2004), WSRT, VLA (De Breuck et al. 2000; Falkendal et al. 2019), and ALMA (Falkendal et al. 2019), in the literature. The data in this work are plotted with the red dots. The western and eastern components of the radio continuum are indicated by the orange and blue dots, respectively. The red dot representing VLA is simply the summation of the western and eastern components. The power laws of the nonthermal synchrotron emission (α = −1.7) and the normalized modified blackbody (β = 2.5, Tdust = 50 K) are indicated by the solid black lines.
Download figure:
Standard image High-resolution imageNoticing that the ALMA data used by Falkendal et al. (2019) were observed at 243 GHz, with an integration time of about 2 minutes, the low S/N of the detection from that data shows a large uncertainty of flux. Nevertheless, our robust ALMA detection at 230 GHz is consistent with their modified blackbody fitting. By assuming a modified blackbody with the same parameters that they used—an emissivity spectral index of β = 2.5 and a dust temperature of Tdust = 50 K—we perform a fit with our ALMA 230 GHz data and plot the results in Figure 7.
4. Discussion
4.1. Spatial Offsets
Figure 8 shows the grayscale Hubble Space Telescope (HST)/Advanced Camera for Surveys (ACS) F775W (i-band) image and the Spitzer/IRAC 3.6 μm image overlaid with the VLA 19 GHz continuum, the CO(1–0), and the ALMA 1.3 mm continuum contours. By comparing the position of a nearby star in the Gaia catalog (Gaia Collaboration et al. 2021), we find that the HST image has little astrometric offset (R.A. −017, decl. +006). It is negligible when comparing the HST image with the ALMA and VLA images. It appears that, at the center, the source on the HST and IRAC images overlaps with the ALMA continuum and the western component of the VLA 19 GHz continuum, indicating that it is the location of the host galaxy and the active galactic nucleus (AGN) of TN J0924. We find that clump A is about 20 (12 kpc) offset to the west of the nucleus, and that it apparently aligns with the radio jet axis, which is roughly in the east–west direction. Furthermore, clumps B and C are about 39 (24 kpc) and 54 (33 kpc) offset to the southwest and the south, respectively. Spatial offsets between the molecular gas reservoirs, the nuclei of the HzRGs, and the alignment between the molecular gas and the radio jet have been reported in lower-z HzRG studies (Emonts et al. 2014; Gullberg et al. 2016; Falkendal et al. 2021). Our results reveal that such spatial offsets and alignments between the molecular gas and the radio jet occur in z > 5 environments.
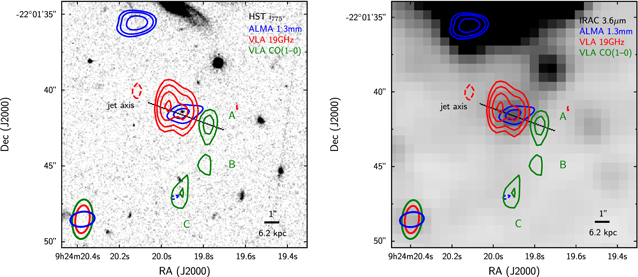
Figure 8. The grayscale HST/ACS F775W (i-band) map (left) and the grayscale Spitzer/IRAC 3.6 μm map (right), with the velocity-integrated CO(1–0) emission from a 23 beam overlaid in green contours, the 19 GHz continuum overlaid in red contours, and the ALMA 1.3 mm continuum overlaid in blue contours. The green contours indicate 3σ and 4σ, where, for clumps A, B, and C, 1σ = 0.013 Jy beam−1 km s−1, 1σ = 0.010 Jy beam−1 km s−1, and 1σ = 0.013 Jy beam−1 km s−1, respectively. The red contours indicate 10σ, 20σ, 40σ, and 70σ, where 1σ = 4.3 μJy. The blue contours indicate 3σ, 5σ, and 10σ, where 1σ = 58.9 μJy. The dashed contours show −3σ. The black dotted line indicates the jet axis. The ellipses in the bottom left corners show the synthesized beams corresponding to the contours in the same colors.
Download figure:
Standard image High-resolution imageIn TN J0924, the spatial distribution of the nucleus and the three molecular gas clumps that we find are special. All three clumps are off-center, with only clump A being on the jet axis. In addition, since clumps B and C are about 24 kpc and 33 kpc away from the nucleus, respectively, we suggest that only clump A is a part of the radio galaxy, while clumps B and C are companion objects with massive molecular gas. In Figure 4, although the S/N of clump A is not high, the broad CO(1–0) line emission may support our suggestion. On the other hand, we do not find counterparts of clumps A, B, and C in the HST, ALMA, and IRAC images.
4.2. Molecular Gas and Star Formation Rate
In the literature, the CO-to-H2 conversion factor αCO of ultraluminous IR galaxies (ULIRGs) is adopted for HzRGs. For consistency with the previously reported molecular gas mass measurements of HzRGs, including those of Klamer et al. (2005), we adopt αCO = 0.8  (Downes & Solomon 1998) to derive the molecular gas masses of the three clumps. The molecular gas masses of clumps A, B, and C are (3.7 ± 0.6) × 1010
M⊙, (2.5 ± 0.4) × 1010
M⊙, and (3.0 ± 0.4) × 1010
M⊙, respectively. In total, this amounts to about 90% of the molecular gas mass derived by Klamer et al. (2005). At the host galaxy, we constrain the molecular gas mass with the 3σ upper limit of 1.3 × 10¹⁰
M⊙.
(Downes & Solomon 1998) to derive the molecular gas masses of the three clumps. The molecular gas masses of clumps A, B, and C are (3.7 ± 0.6) × 1010
M⊙, (2.5 ± 0.4) × 1010
M⊙, and (3.0 ± 0.4) × 1010
M⊙, respectively. In total, this amounts to about 90% of the molecular gas mass derived by Klamer et al. (2005). At the host galaxy, we constrain the molecular gas mass with the 3σ upper limit of 1.3 × 10¹⁰
M⊙.
We estimate the IR luminosity LIR (rest frame 8–1000 μm) and the star formation rate (SFR) of TN J0924 by following the assumptions in Falkendal et al. (2019). They use a modified blackbody originating from star formation to fit the monochromatic ALMA band 6 (243 GHz) data. As mentioned in Section 3.3, in spite of the large uncertainties of LIR and the SFR in Falkendal et al. (2019), due to the shallow ALMA data, the integrated flux of our robust ALMA band 6 (230 GHz) detection (peak S/N = 8) is consistent with their fitting. Therefore, we use a modified blackbody with the same physical parameters to fit our data and estimate LIR to be (9.3 ± 1.7) × 1011 L⊙, which is consistent with their result, 1 × 10¹² L⊙. Compared to their data, the uncertainty of our ALMA data is smaller, and the result is reliable on the same order of magnitude. Changing β and Tdust vary the LIR by a factor of a few. For instance, using β = 2.5 and Tdust = 40 K results in LIR = (3.6 ± 0.7) × 1011 L⊙; using β = 1.5 and Tdust = 50 K results in LIR = (9.1 ± 1.7) × 1011 L⊙. Also, for consistency with the stellar mass derived by De Breuck et al. (2010), we adopt a Kroupa initial mass function, resulting in an SFR of 110 ± 20 M⊙ yr−1. From the ALMA image, it appears that the dusty star formation activity is more associated with the host galaxy than with the molecular gas reservoirs. The dusty star formation activity appears to be confined to the host galaxy. Thus, at the positions of the three molecular gas clumps, we constrain their LIR and SFR with the 3σ upper limits of 3.5 × 10¹¹ L⊙ and 40 M⊙ yr−1, respectively. The low upper limit on the SFR leads to concerns about the applied CO-to-H2 conversion factor. We discuss this in relation to Figure 9 later in the text.
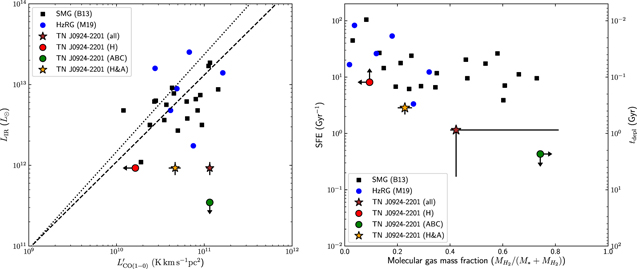
Figure 9. Comparison of the physical properties of TN J0924 with those of other SMGs and HzRGs. The left panel shows LIR versus  . The right panel shows the SFE and tdepl versus the molecular gas fraction
  . In both panels, TN J0924 is plotted with four data sets: "TN J0924 (all)," represented by the brown stars, indicates the host galaxy and the three clumps; "TN J0924 (H)," represented by the red dots, indicates the host galaxy; "TN J0924 (ABC)," represented by the green dots, indicates the three clumps; and "TN J0924 (H&A)," represented by the orange stars, indicates the host galaxy and clump A. HzRGs at z = 2.1–3.8 ("M19"; Man et al. 2019) and SMGs at z = 1.4–4.1 ("B13"; Ivison et al. 2011; Bothwell et al. 2013) are shown by the blue dots and black squares, respectively. The black dashed line and the black dotted line indicate the fit of the SMGs and the fit of the SMGs together with (U)LIRGs, respectively, from Bothwell et al. (2013).
Download figure:
Standard image High-resolution imageIn Figure 9, to show the properties of TN J0924, we divide TN J0924 into four data sets: (1) "TN J0924 (all)" indicates the host galaxy and the three clumps as a whole; (2) "TN J0924 (H)" indicates only the host galaxy; (3) "TN J0924 (ABC)" indicates the three clumps; and (4) "TN J0924 (H&A)" indicates the host galaxy and clump A. HzRGs at z = 2.1–3.8 (Man et al. 2019) and submillimeter galaxies (SMGs) at z = 1.4–4.1 (Ivison et al. 2011; Bothwell et al. 2013) are shown for comparison. The fits of the SMGs and the SMGs together with (U)LIRGs (Bothwell et al. 2013) are also plotted.
Figure 9(a) shows the CO(1–0) line luminosity  and the IR luminosity LIR of TN J0924. The TN J0924 (all) data set shows that in this galaxy, the molecular gas is abundant, compared to objects that have a similar LIR. Also, the TN J0924 (ABC) data set represents an object with abundant molecular gas but low LIR. And if we assume that only clump A is part of TN J0924, as indicated by the TN J0924 (H&A) data set, its high
  is reduced by a factor of 2.5 and becomes comparable with that of other HzRGs.
On the other hand, the TN J0924 (H) data set is located close to the fits of the SMGs and (U)LIRGs (Bothwell et al. 2013), consistent with an ULIRG-like object with an upper limit of  K km s−1 pc2. In addition, regarding an LIR ∼ 1012
L⊙ object, its dust mass is estimated to be on the order of 107
M⊙ (Schreiber et al. 2018). Assuming a gas-to-dust ratio of 100, the molecular gas mass should be about 109
M⊙, which is consistent with our constraint on the molecular gas mass at the host galaxy being <1.3 × 10¹⁰
M⊙, with αCO = 0.8
K km s−1 pc2. In addition, regarding an LIR ∼ 1012
L⊙ object, its dust mass is estimated to be on the order of 107
M⊙ (Schreiber et al. 2018). Assuming a gas-to-dust ratio of 100, the molecular gas mass should be about 109
M⊙, which is consistent with our constraint on the molecular gas mass at the host galaxy being <1.3 × 10¹⁰
M⊙, with αCO = 0.8  . As this upper limit is still higher than the best fits of the SMGs and (U)LIRGs, it is consistent with the host galaxy maintaining its SFR of 110 ± 20 M⊙ yr−1.
Figure 9(b) shows the SFE ≡ SFR/ and depletion time tdepl ≡
  /SFR = SFE−1 versus molecular gas fraction fg
. TN J0924 is shown via all four data sets as well. To estimate the upper limits of the stellar masses of the molecular gas clumps, we apply a simple estimation. The stellar mass 1011.1
M⊙ of the host galaxy is derived by an SED fitting with its IRAC detection and the other upper limits for longer wavelengths (De Breuck et al. 2010). Since only a stellar population model is involved for SED fitting at IRAC wavelengths, we use the same IRAC images to simply apply a scaling estimation. The 3σ upper limit of the IRAC 3.6 μm photometry at the clumps is one-fourth of that at the host galaxy, so we estimate the 3σ upper limit of the stellar mass as 3 × 10¹⁰
M⊙. This upper limit is only applied to the molecular gas clumps. When the host galaxy is combined, we only consider the stellar mass of the host galaxy.
/SFR = SFE−1 versus molecular gas fraction fg
. TN J0924 is shown via all four data sets as well. To estimate the upper limits of the stellar masses of the molecular gas clumps, we apply a simple estimation. The stellar mass 1011.1
M⊙ of the host galaxy is derived by an SED fitting with its IRAC detection and the other upper limits for longer wavelengths (De Breuck et al. 2010). Since only a stellar population model is involved for SED fitting at IRAC wavelengths, we use the same IRAC images to simply apply a scaling estimation. The 3σ upper limit of the IRAC 3.6 μm photometry at the clumps is one-fourth of that at the host galaxy, so we estimate the 3σ upper limit of the stellar mass as 3 × 10¹⁰
M⊙. This upper limit is only applied to the molecular gas clumps. When the host galaxy is combined, we only consider the stellar mass of the host galaxy.
Here, we mark TN J0924 (all) with αCO = 0.8  , for the comparison with other star-forming objects (SMGs and HzRGs). But we extend its error bar to cover the properties that are derived by applying αCO = 4.3
  on clumps B and C. Because the upper limits on the SFR are only <40 M⊙/yr, indicating that the star formation in the clumps is not as active as that in ULIRGs, the conditions of the interstellar medium (ISM) may be more similar to those of Milky Way (MW)–like galaxies than ULIRGs. If we adopt the MW conversion factor αCO = 4.3
  , the molecular gas masses become five times larger than those we originally estimated. Therefore, we regard the above estimates on the molecular gas mass as lower limits. In this regard, the errors would be even larger if the αCO applied on clump A were to be higher than the assumed 0.8
  . This would also be the same for TN J0924 (H&A) as well. As expected, in comparison to other HzRGs, TN J0924 (all) is in a special position, due to its high molecular gas fraction, while TN J0924 (H&A) appears to be a typical radio galaxy, with a low molecular gas fraction and high SFE.
4.3. Interpretations of Clumps
The intriguing spatial distribution of the radio jet, the host galaxy, and the multiple molecular gas clumps implies that TN J0924 is in a special phase of galaxy evolution. Our observation reveals a radio–CO alignment between the radio jet axis and clump A, which is similar to several cases observed at lower redshifts (Emonts et al. 2014). Note that there is a difference between TN J0924 and the findings of Emonts et al. (2014). In Emonts et al. (2014), the CO detection is found on the side where the radio source is the brightest, while in TN J0924, clump A is on the west side, where the radio continuum component is weaker. The physical origins of the radio–CO alignment and the off-center CO have been considered in relation to outflows, mergers, and metal enrichment (Klamer et al. 2004; Emonts et al. 2014). Emonts et al. (2014) have suggested that molecular gas reservoirs exist in the halo environments (∼50 kpc scale) of HzRGs at z ∼ 2. Our result, of three molecular gas clumps that are located 12–33 kpc away from TN J0924, within its halo environment, is consistent with previous studies, while being at z ∼ 5. Observations of multiphase gas have also suggested that the environment of the off-center CO is consistent with the ionization front of the AGN (Falkendal et al. 2021). It is difficult for us to apply the photodissociated region model to TN J0924, however, without any information about multiphase gas.
Considering that TN J0924 is located in an overdense region of Lyα emitters (Venemans et al. 2004) and Lyman-break galaxies (Overzier et al. 2006), merger events could possibly explain the existence of the clumps. However, they cannot explain the radio–CO alignment, since the companion object does not necessarily align with the jet axis. Certainly, though, the possibility of clump A being a merger cannot be ruled out, as a merger event could align with the jet axis by chance. Furthermore, if the jet axis is aligned with the major axis of the elliptical orbit of the merger, the probability of the alignment between the merger and the jet is likely to be higher.
Previous studies (Klamer et al. 2004; Emonts et al. 2014) have also suggested that massive stars may form primarily along the jet, as the jet can induce the compression of gas. Carbon and oxygen produced by massive stars would thus be more abundant along the jet axis. Therefore, CO would be more abundant, and also more detectable, along the jet axis, due to the jet-induced metal enrichment. However, the numerical simulations that have been performed by Mandal et al. (2021) may provide a different perspective. By combining the jet-induced turbulence and the compression that occurs in a radio galaxy, Mandal et al. (2021) show that the SFR is enhanced in the inner region of the galaxy, rather than in the region along the jet. However, observational studies have shown that the anisotropic metal enrichment is related to AGN jets (e.g., Kirkpatrick et al. 2011). This may suggest that jet-induced metal enrichment is still possible, but the origin of the metal is not necessarily related to the jet-induced star formation. Besides, Mandal et al. (2021) have shown that jet–ISM interactions globally regulate the SFR of the galaxy. This regulation is much more effective on the outskirts than in the inner region. The enhanced SFR in the inner region can exhaust the molecular gas in the host galaxy faster than at the outskirts. Thus, the molecular gas at the outskirts remains abundant, due to the low local SFR. This may explain the high SFR observed in the host galaxy where CO(1–0) is not detected, as well as the off-center clump A, which has no HST, IRAC, or ALMA counterparts. However, this does not also explain the observed radio–CO alignment.
The clumps can also be interpreted as outflows from the AGN. Observations of the X-ray cavities in brightest cluster galaxies (BCGs) suggest that the orientation of the jet axis is caused by the precession. Dunn et al. (2006) show that in the BCG of the Perseus cluster, the precession with an opening angle of 50° has a timescale of about 3 × 10⁷ yr, which is comparable to or shorter than the period of radio-loud activity (107–108 yr; Bird et al. 2008). In TN J0924, each clump could possibly be an outflow for each period of radio-loud activity at the AGN, because the timescale of the large precession is shorter than the period of the radio-loud activity. Furthermore, if we assume that the velocity of the outflow is ∼500 km s−1, the clump could be 30 kpc away from the AGN after ∼6 × 10⁷ yr. This is consistent with the timescale of the radio-loud activity and the distance between the observed clumps and the AGN. At z = 0.596, the BCG of the Phoenix cluster shows an outflow of ∼1010 M⊙, which is ∼50% of the total molecular gas mass of the galaxy (Russell et al. 2017). This is different from the off-center CO, but shows that outflows of such massive amounts of molecular gas are possible. However, unlike the X-ray cavities in clusters that appear in pairs, the clumps in TN J0924 are only detected on one side of the AGN.
On the other hand, regarding the companion molecular gas reservoirs, Gullberg et al. (2016) have suggested that these types of objects could follow the accretion flow that is associated with the growth of the cosmic web of dark matter, toward HzRGs. As TN J0924 is in an overdense region (Venemans et al. 2004; Overzier et al. 2006), clumps B and C could be objects that are following the accretion flow and moving toward TN J0924. In the event that clumps B and C eventually fall, and thus fuel the star formation activity, TN J0924 may move between the positions of TN J0924 (H&A) and TN J0924 (all) in Figure 9(b), during its evolution. Assuming that clumps B and C will simply freefall onto the host galaxy, the estimation of the freefall time tff is as follows:
where R is the distance between the point source mass M and m, and G is the gravitational constant. Assuming that M is the stellar gas mass of the host galaxy and that m is the molecular mass of clump B or clump C, the estimation of tff is about 0.2–0.3 Gyr. This timescale is comparable with the depletion time of the host galaxy with only clump A (H&A). Following this assumption, it is possible that the clumps will merge with TN J0924 and continually fuel the further star formation in the host galaxy. Nevertheless, as the molecular gas will be exhausted, due to star formation, if the SFR remains constant, TN J0924 will eventually move toward the left top corner of Figure 9(b), following other HzRGs.
5. Conclusions
We have observed TN J0924 with the VLA at 19 GHz to obtain a spatially resolved CO(1–0) image of one of the most distant radio galaxies that is known. We present these new VLA K-band observations alongside archival ALMA band 6 data. The main results from this work are as follows:
- 1.We detect CO(1–0) in TN J0924, with a beam size of 23 × 12. Three clumps (clumps A, B, and C, from north to south) are detected.
- 2.Clump A is about 20 (12 kpc) offset to the west of the nucleus of the TN J0924 host galaxy, and is apparently in alignment with the radio jet axis, showing radio–CO alignment. Clumps B and C are about 39 (24 kpc) and 54 (33 kpc) offset to the southwest and the south, respectively.
- 3.The CO(1–0) line luminosities
 of clumps A, B, and C are (4.7 ± 0.7) × 1010 K km s−1 pc2, (3.2 ± 0.5) ×1010 K km s−1 pc2, and (3.7 ± 0.5) × 1010 K km s−1 pc2, respectively. With the CO-to-H2 conversion factor αCO =0.8 , the corresponding molecular gas masses of clumps A, B, and C are (3.7 ± 0.6) × 1010
M⊙, (2.5 ± 0.4) × 1010
M⊙, and (3.0 ± 0.4) × 1010
M⊙, respectively. The summation of these molecular gas masses agrees well with the previously reported molecular gas mass from spatially unresolved CO measurements by Klamer et al. (2005).
of clumps A, B, and C are (4.7 ± 0.7) × 1010 K km s−1 pc2, (3.2 ± 0.5) ×1010 K km s−1 pc2, and (3.7 ± 0.5) × 1010 K km s−1 pc2, respectively. With the CO-to-H2 conversion factor αCO =0.8 , the corresponding molecular gas masses of clumps A, B, and C are (3.7 ± 0.6) × 1010
M⊙, (2.5 ± 0.4) × 1010
M⊙, and (3.0 ± 0.4) × 1010
M⊙, respectively. The summation of these molecular gas masses agrees well with the previously reported molecular gas mass from spatially unresolved CO measurements by Klamer et al. (2005). - 4.The ALMA 1.3 mm continuum image shows that the host galaxy of TN J0924 is dominated by thermal dust emission and is located at the same position as the western component of the radio continuum. By extrapolating a power law with α = −1.7, the nonthermal synchrotron emission only contributes about 2% of the flux density observed at 1.3 mm.
- 5.With the robust ALMA 1.3 mm continuum detection, we fit the modified blackbody with the parameters β = 2.5 and Tdust = 50 K. We therefore estimate the LIR and the SFR of the host galaxy of TN J0924 as (9.3 ± 1.7) × 1011 L⊙ and 110 ± 20 M⊙ yr−1. In the host galaxy, we constrain the with a 3σ upper limit of 1.3 × 10¹⁰
M⊙.
- 6.For the molecular gas clumps, by applying a simple scaling estimation to the ALMA 1.3 mm and IRAC 3.6 μm continuum images, we constrain the LIR, SFR, and M* of the molecular gas clumps to be <3.5 × 10¹¹ L⊙, <40 M⊙, yr−1, and <3 × 10¹⁰ M⊙, respectively.


From these results, we have demonstrated the properties of different combinations of the host galaxy and clumps A, B, and C. We have also discussed different scenarios relating to interpretations of the phenomena of the off-center CO and the radio–CO alignment. Regarding the origins or the fate of the host galaxy and its companions, further observational data, which can reveal their dynamic properties, will be crucial.
We thank the reviewer for the comprehensive and constructive comments. K.L. acknowledges support from the Japan-Taiwan Exchange Association. F.E. is supported by JSPS KAKENHI grant No. JP17K14259. M.I. acknowledges support from JSPS KAKENHI grant No. JP21K03632. H.U. acknowledges support from JSPS KAKENHI grant No. 20H01953. This study was supported by JSPS KAKENHI grant No. JP17H06130 and NAOJ ALMA Scientific Research Number 2017-06B. The National Radio Astronomy Observatory is a facility of the National Science Foundation that is operated under cooperative agreement by Associated Universities, Inc. This paper makes use of the following ALMA data: ADS/JAO.ALMA#2013.1.00039.S. ALMA is a partnership of ESO (representing its member states), NSF (USA), and NINS (Japan), together with NRC (Canada), MOST and ASIAA (Taiwan), and KASI (Republic of Korea), in cooperation with the Republic of Chile. The Joint ALMA Observatory is operated by ESO, AUI/NRAO, and NAOJ.