


Abstract
The abundance of 26Al carries a special role in astrophysics, since it probes active nucleosynthesis in the Milky Way and constrains the Galactic core-collapse supernovae rate. It is estimated through the detection of the 1809 keV γ-line and from the superabundance of 26Mg in comparison with the most abundant Mg isotope (A = 24) in meteorites. For this reason, high precision is necessary also in the investigation of the stable 27Al and 24Mg isotopes. Moreover, these nuclei enter the so-called MgAl cycle, playing an important role in the production of Al and Mg. Recently, high-resolution stellar surveys have shown that the Mg–Al anticorrelation in red-giant stars in globular clusters may hide the existence of multiple stellar populations, and that the relative abundances of Mg isotopes may not be correlated with Al. The common thread running through these astrophysical scenarios is the 27Al(p,α)24Mg reaction, which is the main 27Al destruction channel and directly correlates its abundance with the 24Mg one. Since available reaction rates show large uncertainties owing to the vanishingly small cross section at astrophysical energies, we have applied the Trojan Horse Method to deduce the reaction rate with no need of extrapolation. The indirect measurement made it possible to assess the contribution of the 84 keV resonance and to lower upper limits on the strength of nearby resonances. In intermediate-mass AGB stars experiencing hot bottom burning, a sizeable increase in surface aluminum abundance is observed at the lowest masses, while 24Mg is essentially unaffected by the change in the reaction rate.
Export citation and abstract BibTeX RIS

Original content from this work may be used under the terms of the Creative Commons Attribution 4.0 licence. Any further distribution of this work must maintain attribution to the author(s) and the title of the work, journal citation and DOI.
1. The Astrophysical Thread
The measurements of magnesium and aluminum abundances and their isotopes prove crucial in many astrophysical contexts. An especially interesting recent observation regards the anticorrelation of Mg–Al abundances in red-giant-branch stars of globular clusters (e.g., NGC 2808, ωCen, and M4). High-resolution stellar spectroscopy has demonstrated the likely existence of several stellar populations and even the lack of an apparent correlation of the relative abundances of 24Mg, 25Mg, and 26Mg with Al (Da Costa et al. 2013; Lind et al. 2015). This complicated observational scenario suggest multiple polluters, including massive fast-rotating stars and intermediate-mass AGB and super AGB stars (Carretta et al. 2018). Moreover, such peculiar observations need to fine-tune the theoretical models, since the production, the destruction, or the buildup of 24Mg is very sensitive to the temperature of the stellar H-burning (Yong et al. 2003), in particular in the quite narrow 0.07 ≤ T9 ≤ 0.08 range, where T9 is the temperature expressed in GK.
Mg and Al isotopes participate in the so-called MgAl cycle, typical of high-temperature (T9 ∼ 0.055) H-burning of evolved stars (Iliadis 2015).
The MgAl cycle is not as relevant as the CNO one for energy production in stars because of the higher Coulomb barriers involved, yet it has large influences on the nucleosynthesis of Mg and Al. The thread linking all these isotopes and isotopic ratios is the 27Al(p,α)24Mg reaction. It drives the destruction of 27Al and contributes to the production of 24Mg. The closure of the MgAl cycle depends on the competition of this reaction with the 27Al(p,γ)28Si: while the (p,α) rate is clearly dominant above 1 GK, it slightly exceeds the (p,γ) rate in the range 0.03–0.08 GK (according to Iliadis et al. 2010b), with large uncertainties, so that they make astrophysical predictions unreliable (Iliadis 2015). This calls for a careful assessment of its cross section in the energy range typical of stellar nucleosynthesis (around 100 keV).
Moreover, a better knowledge of the 27Al(p,α)24Mg reaction rate might help in understanding also the 26Al nucleosynthesis in our Galaxy.
Present Galactic 26Al abundances have been deduced through the detection of the widely distributed 1809 keV γ emission from 26Mg, following 26Al β decay (with a 7.17 × 10⁵ yr half-life), using the satellite-borne Ge spectrometer telescope (SPI) on the INTEGRAL γ-ray observatory (Diehl et al. 2006), but the initial presence of 26Al in the early solar system is indicated by the large excesses of 26Mg measured in presolar grains (Groopman et al. 2015). Such excesses of 26Mg pointing at the 26Al occurrence are quantified with respect to the most abundant Mg isotope (A = 24) in meteorites. In detail, the 26Al/27Al ratio in the ancient Galaxy and the age of the ancient solids therein contained are estimated from the abundance ratios 26Mg/24Mg and 26Mg/27Al measured in presolar grains, meteorites, and early solar system materials (Vescovi et al. 2018).
Therefore, the high accuracy achieved in these isotopic ratio determinations (Groopman et al. 2015) calls for high-precision investigations of the nucleosynthesis of 26Al and, necessarily, of 27Al and 24Mg as well. Focusing on the magnesium isotopes, presently their abundances in the interstellar medium have been recognized as a yardstick that efficiently gauges the star formation process over cosmological timescales. Indeed, while the main contributors to 24Mg are identified in massive stars, the 25Mg and 26Mg supply is mostly ascribed to intermediate-mass objects (Vangioni & Olive 2019).
While studies (e.g., Iliadis et al. 2011) support massive objects and supernova progenitors as likely origins, low- and intermediate-mass stars during the AGB phase are regarded as probable suppliers of 26Al fossil abundances in Al-rich dust (Karakas & Lattanzio 2014; Ventura et al. 2016; Palmerini et al. 2017). Therefore, even if the 27Al(p,α)24Mg reaction seems to not deeply affect the nucleosynthesis of 26Al in massive objects, where Mg and Al nucleosynthesis mainly occurs in the C/Ne shell burning (Iliadis et al. 2011), more accurate measurements of proton-capture reactions on Al and Mg isotopes at energies typical of H-burning might modify, strengthen, or weaken this scenario of Al nucleosynthesis in AGB stars, due to the sensitivity of their yields on the cross sections.
2. Status of the 27Al(p,α)24Mg Rate
Focusing on the previously published 27Al(p,α)24Mg reaction rate reported in Iliadis et al. (2010) and widely adopted in astrophysical predictions, its lower, median, and upper values are 1.85 × 10⁻¹¹, 4.34 × 10⁻¹¹, and 8.51 × 10⁻¹¹ cm3 mol−1 s−1, respectively, at T9 = 0.1, covering almost one order of magnitude, the uncertainty range becoming larger at lower temperatures.
The reaction rate in Iliadis et al. (2010) is based on direct measurements (Timmermann et al. 1988), on compiled spectroscopic data (Endt 1990, 1998), on transfer-reaction-based branching ratios (Champagne et al. 1988), and on shell-model calculations (Endt & Booten 1993). For some states, estimates of the resonance strengths are excerpted from the previous compilation in Iliadis et al. (2001). Before discussing the present knowledge of the 27Al(p,α)24Mg reaction from a nuclear physics perspective, it is worth noting that more than 90 resonances occur in the region Ecm ≤ 3 MeV, so establishing a reliable reaction rate is clearly very challenging. Regarding direct data, Timmermann et al. (1988) explored the low-energy region (between 200 and 360 keV), setting upper limits for the resonance strengths, later used in the evaluation of the reaction rate in Iliadis et al. (2010). Spectroscopic data in Endt (1990, 1998) represent the backbone of calculation of the recommended reaction rate (Iliadis et al. 2010), making it clear that most data sets are quite outdated, lacking experimental data focusing on astrophysical energies. Champagne et al. (1988) used the  reaction to populate 28Si states close to the p-emission threshold, setting useful upper limits and using the measured branching ratios to calculate partial widths and resonance strengths. Finally, shell-model calculations (Endt & Booten 1993) were used to exclude some states in the reaction rate calculation, based on their predicted unnatural parity.
Already in Iliadis et al. (2001) an accurate analysis of the available data (which, clearly, have not had a significant update since 1998), combined with improved estimates of spectroscopic factors for threshold states, lead to large deviations from the previous recommended rate in Angulo et al. (1999), yet the uncertainties remained very large (even 3 orders of magnitude below T9 ∼ 0.3). The main update from 2001 to 2010 leading to the presently recommended reaction rate in Iliadis et al. (2010) was the new, improved approach used to calculate the reaction rate uncertainties, based on a Monte Carlo method, making it possible to propagate the uncertainties on the resonance strengths and partial widths in a statistically correct way to the total reaction rate. Also, upper limits were properly accounted for, eventually resulting in a statistically rigorous definition of the low, median (recommended), and high rate, at odds with the classical definition used in most works for "upper" and "lower" limits (see Iliadis et al. 2010b and Longland et al. 2010 for a detailed discussion).
Taking into account the need for updated data for the 27Al(p,α)24Mg reaction, the lack of data close to the energies of astrophysical interest, and that, if resonances of the 27Al(p,α)24Mg reaction are found at low energies, the contribution of low-mass-star H-burning to the Al nucleosynthesis should be revised, we have carried out a new measurement of the 27Al(p,α)24Mg reaction using the indirect Trojan Horse Method (THM; Tribble et al. 2014). Combining new, high-accuracy experimental data with state-of-the-art reaction rate calculations, based on a Monte Carlo method (Iliadis et al. 2010b; Longland et al. 2010), we aim to provide a novel 27Al(p,α)24Mg reaction rate and point out possible astrophysical consequences of our results.
Preliminary results have been published in La Cognata et al. (2022). In the present work, we delve deeper into the method, the uncertainty evaluation, and into the astrophysical consequences.
3. Summary of the Method and Experimental Details
3.1. The THM for Resonant Reactions
The indirect label is used to indicate those techniques making it possible to deduce the astrophysical S-factor (Iliadis 2015) of a reaction by measuring the cross section of a closely related process, and by applying nuclear reaction theory to link the two. In the present work, we have investigated the 27Al(p,α)24Mg reaction using the THM, which is an experimental indirect technique successfully applied to study several astrophysically relevant reactions by appropriate three-body quasi-free (QF) processes (Tribble et al. 2014; Spitaleri et al. 2019). One can briefly describe the technique as follows (see Figure 1), for the case under investigation. A 27Al projectile is accelerated onto a deuteron target nucleus, having a very simple p + n structure, the p − n motion taking place mostly in an s-wave (Lamia et al. 2012). Under selected kinematic conditions, 27Al interacts only with the proton (or neutron), which is the participant in the Trojan Horse (TH) reaction, then the neutron (or proton) is emitted without taking part in the 27Al + p(n) interaction (therefore it is labeled as spectator). This is enforced by selecting small p − n relative momenta, corresponding to large p − n relative distances. Following the QF interaction, 28Si excited states are populated (lower vertex of Figure 1), later decaying into the 24Mg + α channel to be selected in the offline analysis.

Figure 1. Sketch of the QF transfer reaction used to study the 27Al(p,α)24Mg reaction by means of the THM.
Download figure:
Standard image High-resolution imageIf the bombarding energy is chosen to overcome the Coulomb barrier in the entrance channel of the d(27Al, α24Mg)n reaction, the participant proton is brought into the nuclear field of 27Al to induce the 27Al(p,α)24Mg reaction. Moreover, since the beam energy can be compensated for by the deuteron binding energy, the two-body reaction can take place in the energy region of astrophysical relevance of the 27Al + p interaction. Since the scrutiny of the resonance list in Iliadis et al. (2010) shows that the low-energy cross section of the 27Al(p,α)24Mg reaction is dominated by narrow resonances, in comparison with the typical THM energy resolution of a few tens of keV (FWHM), the THM approach for narrow resonances thoroughly discussed in La Cognata et al. (2010) and the corresponding equations have been adopted in the present work. Here, we review the basic ones.
The TH double differential cross section for the d(27Al, α24Mg)n reaction, integrated over  , is given by (see Equation (6) of La Cognata et al. 2010):
under the simplifying assumption that a single resonant state at energy ER
is populated; in the equation above,  is the differential cross section for the stripping
  to the resonant state of 28Si,
  is the α−24Mg relative energy, and Γ and
  are the total and partial width for the resonance under examination. From the comparison with the resonant cross section in the Breit–Wigner approximation for a direct measurement, it is clear that a straightforward connection with the resonance strength (Iliadis 2015) can be established. This is a very important point since, in the case of reactions controlled by narrow resonances, the reaction rate is essentially determined by the resonance energies and strengths. See La Cognata et al. (2010b) for the description of the broad-resonance case.
Following the discussion and using the same notation as in La Cognata et al. (2010), if Ni is the area of the ith peak in the THM cross section described by Equation (1) and ωi is the statistical factor (Iliadis 2015), the strength (ω γ)i of the ith resonance is given in arbitrary units by:

where the superscript s. p. is used to indicate that single-particle wave functions should be used in the calculation of the quantities therein, therefore devoid of explicit spectroscopic factors. As discussed in La Cognata et al. (2010), the rightmost factor is then an easily calculable and unambiguous quantity.
While, in principle, the strengths could be deduced in absolute units (see, e.g., the discussion in La Cognata et al. 2009), in the THM application to resonant reactions high accuracy is achieved by scaling the indirectly deduced strengths to measured ones at high energies. This makes it possible to use the simplifying plane wave approximation, while the double ratio (see Equation 22 of La Cognata et al. 2010) compensates for possible systematic errors coming from the model assumptions. Furthermore, additional sources of systematic errors due to the determination of collected charge, of the target thickness, of solid angles, and dead time are removed or strongly reduced. Finally, it has been shown that extending the normalization procedure to more than one resonance greatly reduces possible systematic errors affecting directly measured strengths (see La Cognata et al. 2015 for details).
3.2. The Experimental Approach
The 2H(27Al, α24Mg)n reaction (Q = −0.6 MeV) sketched in Figure 1, used to study the 27Al(p,α)24Mg reaction (Q = 1.6 MeV), was measured at the INFN-LNS Tandem (Catania, Italy). A 80 MeV 27Al beam, ∼1 pnA intensity was delivered onto a CD2 target (isotopically enriched to 98%) about 100 μ g cm−2 thick, placed at 90° with respect to the beam axis. The beam energy was chosen to span the 27Al−p energy range between the threshold and ∼1.5 MeV for normalization to measured resonance strengths. In this work, a higher beam energy than in the previous run (see Palmerini et al. 2021 for details) was considered to explore a phase-space region where the contribution of the 25Mg compound-nucleus decay to the reaction yield is negligible.
The experimental setup was made of four 1000 μm double-sided silicon strip detectors (DSSSD); two (named B and C) were placed at 700 mm from the target, centered at 5 5 and covering each about 4° on opposite sides with respect to the beam direction. The other two DSSSDs (A and D, A on the same side as B) were placed at about 135 mm from the target at about 25°, each covering about 105 on opposite sides of the beam axis. The use of DSSSDs in the place of PSDs as in Palmerini et al. (2021) made it possible to increase statistics, each DSSSD covering a solid angle 5 times larger than a PSD. Also, the symmetric setup made it possible to double statistics. Thanks to a reanalysis of the data in Palmerini et al. (2021), it turned out that no ΔE–E technique was necessary to perform particle selection, as will be clear later in this paper. The nonuse of an ionization chamber as a ΔE detector, as in Palmerini et al. (2021), made it possible to improve the energy resolution in the particle detection and to improve the accuracy of measurement by reducing the systematic errors due, for instance, to the measurement of the pressure in the ionization chambers. Given the reaction kinematics, the forward detectors were used to detect the heavy fragment emitted in the reaction, while the other two detectors, placed closer to the target, were used to measure the light fragment. The trigger of the data acquisition was then the logical AND of the signals from the more forward and the more backward detectors.
Since we aim to measure a reaction with three particles in the exit channel, only two of them have to be detected. Indeed, from their measured energies and emission angles, it is possible to deduce all the kinematic variables with no need to use neutron detectors to observe the candidate spectator particle.
Detector calibration was carried out using reactions and scattering of 27Al, at energies of between 40 and 80 MeV, off Au and CD2 targets, as well as standard calibration alpha sources. Elastic scattering at the lowest energy of 40 MeV was used to check detectors' positions and solid angles by comparison of the measured yields with the result of a Monte Carlo simulation, the cross section at the angles of the measurement closely following the Rutherford trend.
4. From the QF Yield to the Resonance Strengths
4.1. Selection of the Reaction Channel
As discussed above, the results from Palmerini et al. (2021) showed us that no particle identification was necessary using the ΔE–E technique. Instead, we carried out channel identification using the kinematic techniques discussed in, e.g., La Cognata et al. (2010). Indeed, we need to verify that trigger logic is enough to remove competing reaction channels, as foreseen in the previous experiment. The first step was the application of the procedure discussed in Costanzo et al. (1990) and Badala et al. (2022). In brief, for a generic a + b → c + d + e reaction the following X and Y variables are introduced:


assuming that b is at rest in the laboratory frame (target), pe is the particle e momentum, and u the unit mass in a.m.u. It was shown (Costanzo et al. 1990) that the value of pe is calculated with no need to introduce any hypothesis on its mass. Ea is the beam energy, and Ec and Ed are the energies measured by the detectors. Then, the two quantities above are related through the simple relation:

Therefore, events from the a + b → c + d + e reaction should fall along a straight line, defined by Equation (5), if data are drawn in the X–Y plane. This line intercepts the Y-axis at Y = −Q and has a slope given by 1/Ae (Ae being the mass of the undetected particle in a.m.u.), making it possible to identify the reaction channels feeding the reaction yield.
The X–Y plot for the present experiment is shown in Figure 2. The picture clearly shows two loci only, with apparently no background, making us confident about the absence of parasitic processes since they are both linked to the 2H(27Al,α24Mg)n reaction. A closer examination and the comparison with the theoretical lines demonstrate that the events gathering along the short-dashed line correspond to the 2H(27Al,α24Mg)n reaction populating the 24Mg ground state (Q0 = −0.624 MeV, 0 for ground state, Ae = 1). The other locus, marked by the dotted–short-dashed line, is instead due to the 2H(27Al,α24Mg)n reaction populating the 24Mg first excited state at 1.369 MeV (Q1 = −1.993 MeV, 1 for the first excited state, Ae = 1). The slopes of the lines clearly define the mass of the undetected particle to be about 1 a.m.u., while the intercepts prove the accuracy of the detector calibration we have carried out. This is also confirmed by the Q-value spectrum (Figure 3), obtained by consequently assuming that the undetected particle is a neutron. It exhibits two distinctive peaks, the arrows indicating the theoretical values (−0.624 MeV and −1.993 MeV for 24Mg ground and first excited state, respectively). While no other peak is present, suggesting that no other reaction is populating the spectrum, a skewness is definitely present toward smaller Q. Simulations show that this can be attributed to a less efficient charge collection in the interstrip region of the Si detectors (Torresi et al. 2013). Therefore, in the following analysis a gate on the Q-value spectrum was set, rejecting events having Q ≤ −1 MeV or Q ≥ −0.2 MeV to improve our energy resolution and to discard events corresponding to the population of the 24 Mg first excited state.
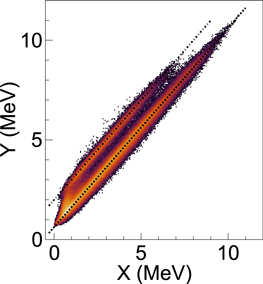
Figure 2. X–Y plot obtained following the procedure in Costanzo et al. (1990) and La Cognata et al. (2010). Two lines are displayed: the short-dashed line is used to mark the expected locus for the 2H(27Al,α24Mg)n reaction populating the 24Mg ground state (Q0 = −0.624 MeV, Ae = 1). The dotted–short-dashed line represents the same reaction populating the 24Mg first excited state (Q1 = −1.993 MeV, Ae = 1).
Download figure:
Standard image High-resolution image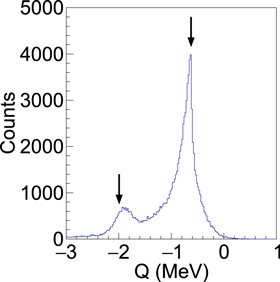
Figure 3. The Q-value spectrum inferred from the present-experiment data, from energy and momentum conservation equations, taking the undetected particle mass equal to 1.008665 a.m.u. (neutron). The two arrows mark the theoretical Q-values for the two channels observed in Figure 2.
Download figure:
Standard image High-resolution imageFinally, Figure 4 shows the experimental kinematic locus, obtained by charting the energies detected in detectors A and C in coincidence events, for the angular couple θA = 255 ± 05, θC = 55 ± 05 (similar results are obtained also for other angular couples and for the B–D detectors couple). In agreement with what is expected from simulations (see, e.g., Palmerini et al. 2021), events from the 2H(27 Al,α24Mg)n three-body reaction gather along a characteristic locus in the EA−EC plane, while no additional spots are visible. A striking feature of the present experiment is the much-improved statistics with respect to that discussed in Palmerini et al. (2021; compare to Figure 4 therein).
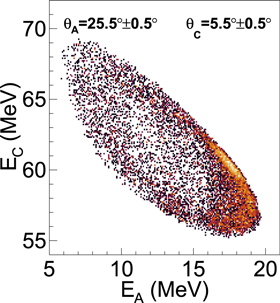
Figure 4. Experimental kinematic locus for detector coincidence A–C and detection angles θA = 255 ± 05, θC = 55 ± 05.
Download figure:
Standard image High-resolution image4.2. Investigation of the Reaction Mechanism for THM Application
Given a unique identification of the events of interest and the absence of any observable background, we carried out the investigation of the reaction mechanisms leading to the population of the exit channel. Indeed, the equations briefly sketched in Section 3.1 can be applied only under the assumption that the 2H(27Al,α24Mg)n reaction can be described as a QF process in some phase-space regions. Following, e.g., the procedure outlined in La Cognata et al. (2010), we first tested the relative energy spectra to exclude the presence of sequential decay processes. In the cases in which the 2H(27Al,α24Mg)n three-body reaction takes place as a two-step process, where 5He or 25Mg are formed, subsequently emitting a neutron to populate the α + 24 Mg + n final channel, the neutron cannot be regarded as a spectator to the 27Al(p,α)24Mg lower vertex of Figure 1. Therefore, deuteron breakup cannot be direct, and the 2H(27Al,α24Mg)n does not proceed through a QF process. If 5He or 25Mg are formed, the relative energy spectra would clearly bear a signature, through the formation of resonances in the coincidence yield in correspondence of 5He or 25Mg excited states (the excitation is easily calculated from the 4He−n and 24Mg−n relative energies by summing the corresponding neutron emission threshold energies).
Figure 5 presents the 4He−n versus 24Mg−n relative energy 2D spectrum. It does not exhibit horizontal or vertical loci that would signal the formation of 5He or 25Mg intermediate nuclei, respectively, at least above  . Instead, oblique loci are clearly seen and an energy conservation consideration suggests to attribute them to the formation of 28Si excited states. The correlation plot in Figure 5 was obtained for the A–C couple of detectors; similar results are obtained for B–D as well. At
  and
and  , a cluster of events is recognizable, which is not clearly associated with sequential processes due to the formation of 5He or 25Mg compound systems. We will show that such a cluster does not affect the extraction of the resonance strengths.

Figure 5. 4He−n vs. 24Mg−n relative energy 2D spectrum obtained for the A–C couple of detectors in coincidence. Clear sloping lines are visible.
Download figure:
Standard image High-resolution imageUsing a similar approach, it is possible to find out whether 28Si states are populated in the 2H(27Alα24Mg)n reaction. We know from Palmerini et al. (2021) that hints of the presence of 28Si states were reported, yet further work was necessary to extract quantitative information. In Figure 6, we illustrate the  versus
  2D spectrum, where the feeding of 28Si states right above the α separation energy is apparent. Clear vertical loci are present below ∼3.5 MeV (corresponding to the sloping ones in Figure 5), corresponding to 28Si states. Such a picture demonstrates that reaction mechanisms leading to the population of 5He or 25Mg excited states, if any, can only affect the
  energies well above the α threshold (≥3 MeV), far from the interval of astrophysical interest, so its influence will be neglected in the forthcoming analysis. Comparison with the previous experiment results (Palmerini et al. 2021) proves that the drawbacks therein pointed out have been solved in the present one.
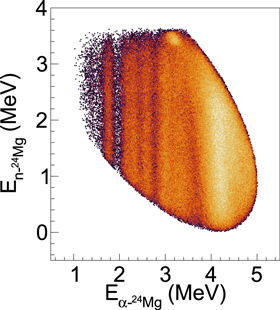
Figure 6. 24Mg−n vs. 24Mg−α relative energies correlation plot for the A–C couple of detectors. Clear vertical bands are attributable to the excitation of 28Si states right above α emission threshold.
Download figure:
Standard image High-resolution imageThe analysis above cannot establish whether 28Si states are populated in a two-step process (sequential mechanism) or following QF deuteron breakup. Therefore, additional tests are carried out, in particular the study of the experimental neutron momentum distribution,  . Indeed, if the process is direct, neutrons should keep the same momentum as inside deuterons, so deviation from the theoretical trend (Lamia et al. 2012) would signal the prevalence of a non-QF reaction mechanism. The experimental
  was obtained following the prescriptions in Lamia et al. (2012), selecting a narrow
  energy range (smaller than the widths of the bands in Figure 6) to keep the cross section almost constant within the interval, and then correcting the three-body reaction cross section for the phase-space factor. The resulting experimental momentum distribution is displayed as solid circles in Figure 7 for an
  energy window 50 keV wide, centered at 2.2 MeV. Similar results are obtained for other energy values. In the construction of Figure 7, we attributed a positive or negative sign to p3 depending on the sign of the cosine of the azimuthal angles
  . In this figure, the theoretical p−n relative-momentum distribution is rendered with a red solid line; the theoretical line was scaled to match the arbitrary normalization of the experimental data. Good agreement is present up to about
  , as should be expected (see Spitaleri et al. 2019 for an extensive discussion). This makes us confident about the occurrence of the QF mechanism in the 2H(27Al,α24Mg)n reaction at the 80 MeV beam energy, in agreement with what was found by Palmerini et al. (2021), and suggests the most suitable cut to introduce in the next steps to single out the QF reaction process.
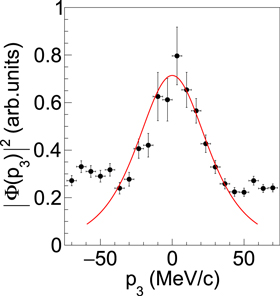
Figure 7. Neutron momentum p3 distribution for an  energy window 50 keV wide centered at 2.2 MeV. The spectrum is obtained taking positive p3 from the A–C couple and negative ones from B–D. The theoretical red curve (Lamia et al. 2012) follows very closely the experimental points up to about
  .
.
Download figure:
Standard image High-resolution image4.3. Analysis of the Angular Distributions
From our analysis, we concluded that no background affects our reaction and that there is a well-defined phase-space region where the reaction mechanism is QF, so the THM standard equations can be applied (La Cognata et al. 2010). Since the 27Al + p relative energy Ecm is calculated as  (Q = 1.6 MeV), we obtained the raw Ecm spectra for the 2H(27Al,α24Mg)n reaction, shown as solid circles in Figure 8. The lower and upper panels refer to the A–C and B–D detector couples, respectively. In agreement with our scrutiny of Figure 6, for both couples we see pronounced resonances, which were only suggested in Palmerini et al. (2021). Superimposed onto the experimental spectra (solid circles), we present the result of a Monte Carlo simulation (red histogram), obtained including all experimental effects such as beam spot size and beam divergence, energy and angular straggling in the targets, strip size in detectors, and measured energy resolutions. Also, the number of events is fixed to the experimental one in the simulations, the only free parameters being the resonances' relative heights. Only the strongest resonances as listed in Iliadis et al. 2010b (see Table 1 of Palmerini et al. 2021 for more details) were considered in the simulations, and a single resonance at 84 keV was adequate to reproduce the lowest energy peak. No states leading to resonances above about 1.6 MeV were considered in the analysis, since they lie well beyond the energy region of astrophysical interest (this is why the histograms in Figure 8 do not follow the trend of experimental data above about Ecm = 1.6 MeV).
Table 1. List of the Levels Showing the Highest Strength in the 27Al(p,α)24Mg Reaction Below About 2 MeV
 (keV) (keV) | Jπ | ω γ (eV) | δ ω γ (eV) | |
|---|---|---|---|---|
| (1) | 71.5 | 2+ | 2.47 × 10⁻¹⁴ | - |
| (2) | 84.3 | 1− | 2.60 × 10⁻¹³ | - |
| (3) | 193.5 | 2+ | 3.74 × 10⁻⁷ | - |
| (4) | 214.7 | 3− | 1.13 × 10⁻⁷ | - |
| (5) | 486.74 | 2+ | 0.11 | 0.05 |
| (6) | 609.49 | 3− | 0.275 | 0.069 |
| (7) | 705.08 | 2+ | 0.52 | 0.13 |
| (8) | 855.85 | 2+ | 0.83 | 0.21 |
| (9) | 903.54 | 3− | 4.3 | 0.4 |
| (10) | 1140.88 | 2+ | 79 | 27 |
| (11) | 1316.7 | 2+ | 137 | 47 |
| (12) | 1388.8 | 1− | 54 | 15 |
| (13) | 1661.4 | 3− | 12.5 | 2.5 |
| (14) | 1838.8 | 1− | 30.0 | 6.0 |
Note. States for which only an upper limit for the strengths is available are reported in italics. Resonance parameters (resonance energies, strengths and their uncertainties) are taken from Iliadis et al. (2010b). Jπ 's are taken from NuDat2 database 2.8 (2021).
Download table as: ASCIITypeset image
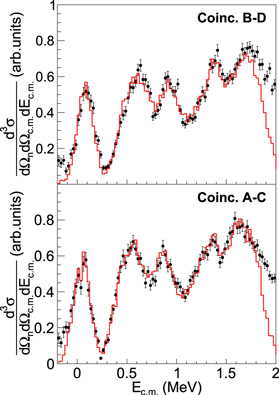
Figure 8. Raw Ecm spectra obtained with the analysis cut on Q and neutron momentum p3, for the A–C and the B–D couples of detectors. The red histogram is the result of the Monte Carlo simulation, accounting for all experimental aspects, with resonances' relative heights as the only free parameters.
Download figure:
Standard image High-resolution imageThe simulation shows that experimental effects are well understood while indicating that most peaks in the spectra are the superposition of two or more 28Si resonances. Therefore, the analysis of the angular distributions will help to determine the dominant orbital angular momentum of the populated resonances in the different peaks of Figure 8, which will make it possible to determine which resonances are dominantly populated in this work. To carry out the angular distribution integration, we adopted the phenomenological approach as in La Cognata et al. (2008, 2010). In brief, we have expressed the coincidence yield obtained by gating on each peak as a function of the α emission angle in the p−27Al center-of-mass system:

where  are the (Galilean invariant) relative momenta. The resulting THM angular distributions are displayed in Figure 9. Each panel, from (a) to (e), is relative to a peak in Figure 8, from the one at the lowest energy (about 90 keV) to the one at the highest ones (about 1.6 MeV). The experimental distributions in the pictures are the sum of the results for the A–C and B–D couples for each peak, since they show an identical trend and covered θc.m. range. Following the prescription of Evans (1955), we fitted the angular distributions (solid/open symbols) with the polynomial:

(we restricted the order to 4 since it is always enough to achieve a good reproduction of the experimental data), leading to the red curves in Figure 9. According to the considerations in Evans (1955), since b ≠ 0 is necessary to fit the spectra in Figures 9(d) and (e), we can conclude that only for the two highest energy resonances the dominant wave is ℓ = 2, the other peaks being mostly controlled by p-waves (in both p and α channels). Such results are in very good agreement with what is listed in the compilations of 28Si resonances (Endt 1998; Iliadis et al. 2010b; NuDat2 database 2.8, 2021). The most intense resonances below about 2 MeV were already identified by Palmerini et al. (2021) and are listed in Table 1. Above about 1.6 MeV the contribution of strong tails from higher energy resonances cannot be neglected, as seen in Figure 8, contributing the ℓ = 2 wave in Figure 9(e).
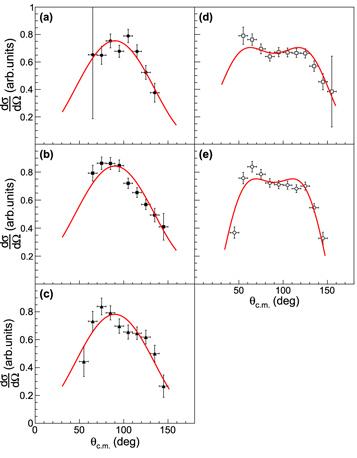
Figure 9. THM angular distributions obtained following the procedure in La Cognata et al. (2010); solid/open symbols). Letters from (a) to (e) are used to identify the energy gates, centered at: (a) → ∼90 keV, (b) → ∼0.5 MeV, (c) → ∼0.8 MeV, (d) → ∼1.4 MeV and (e) → ∼1.6 MeV. Each distribution is coming from the sum of those for A–C and B–D DSSSD couples. The red lines are fits using Equation (7).
Download figure:
Standard image High-resolution imageRegarding Figure 9(a), the dominant contribution is clearly linked to excitation of the  keV resonance (see Table 1), which has been measured for the first time in this 27Al(p,α)24Mg study. However, the Ec.m. energy resolution deduced from the Monte Carlo simulation (σ = 95 keV) does not make it possible to separate the possible contribution of the
  keV resonance. The shape of measured angular distribution still makes it possible to set an upper limit to it, conservatively established to be equal to 36% of the total, taking into account the error bars affecting the experimental angular distribution under inspection. The next two angular distributions (Figures 9(b) and (c)) are also dominated by p-waves, matching the presence of the two strong 3− states at
  and
and  . At higher energies, at about 1.4 MeV (Figure 9(d)), where the d-wave is dominating angular distributions, the shape of the angular distribution may be likely controlled by the
  resonance. The situation is less clear at about 1.7 MeV (Figure 9(e)), where tails of higher energy resonances could give a substantial contribution to the reaction yield (as is apparent from Figure 8). Since these energies are already well beyond the ones of astrophysical interest, we will not dwell on their discussion in the present work.
An evident feature of the measured angular distributions is that we could not cover the whole θc.m. range with the present choice of detector configuration. Therefore, for angular integration, angular distributions were extrapolated beyond the measured regions using the fitting curves. Uncertainties on the fitting parameters were used to determine the contribution to the total error budget from the integration of the angular distributions. However, in the experiment preparation we took care to span the θc.m. region around π/2, which is the most influential for angular distribution integration, strongly reducing the systematic error due to the extrapolation of the trend into the θc.m. region where data are not available. As a result, such an uncertainty contributes to the overall error budget from 2% up to 12% for the highest energy peak.
The integrated cross sections are shown in Figure 10, still for the two separated couples of detectors, even if the integration formulas are the same. Indeed, we preferred to carry out independent analyses as far as possible to check compatibility and reduce systematic errors. The figures clearly show that uncertainties are larger for higher energies, due to the larger uncertainty on the angular distribution fitting.
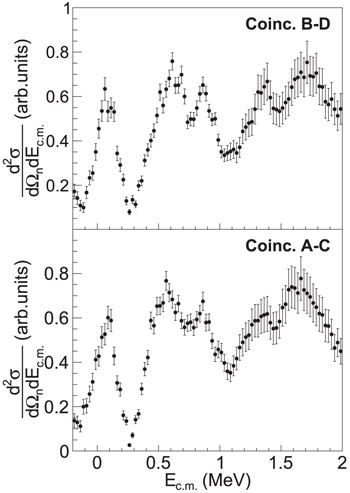
Figure 10. Ec.m. spectra integrated over θc.m., for the A–C and the B–D couples of detectors.
Download figure:
Standard image High-resolution image4.4. Deducing the Resonance Strengths
Since the A–C and the B–D cross sections are in perfect agreement with one another, we took the sum and the resulting 2H(27Al,α24Mg)n cross section is shown in Figure 11 (solid circles). According to La Cognata et al. (2010), since the widths in the literature are much narrower than our estimated energy resolution, we carried out a fit with Equation (A5) therein:
to deduce the THM resonance strengths Ni (see also Equation (2) and the discussion therein). In the fitting, the only free parameters are the Ni coefficients, the ai parameters used to reproduce the combinatorial background being unnecessary to fit the experimental data. Also, the resonance energies were taken from Table 1 and the Gaussian σs were taken all equal to 95 keV (the experimental energy resolution) as deduced from the Monte Carlo simulation (which is devoid of free parameters). The resulting fitting curve is shown as a red solid line in Figure 11, while the individual contribution from each resonance is shown as a red dashed line. The quality of the fitting is worse above about 1.5 MeV owing to tails of higher energy resonances and larger error bars, yet this region is not going to be discussed in the present work, since it is quite remote from the energy range of astrophysical interest, around about 100 keV.
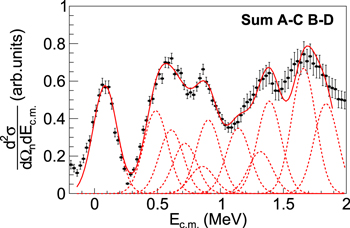
Figure 11. Double differential cross section of the 2H(27Al,α24Mg)n reaction (solid circles). The red solid line is the result of the fitting using Equation (A5) of La Cognata et al. (2010), where ai are taken equal to zero. Dashed lines are used to mark the contribution of each resonance.
Download figure:
Standard image High-resolution imageFocusing first on the energy region of astrophysical interest, we could fit very well the lowest energy peak with a single resonance centered at about 84 keV. This state is very important given that the energy region of greatest astrophysical relevance is around 100 keV. A small tail of a subthreshold state is also recognizable, as it is visible in Figure 6. Even if its contribution is negligible (a few percent), it is accounted for in the fitting procedure. Besides the state at 71.5 keV, for which we could set an upper limit, the two additional resonances at 193.5 and 214.7 keV (states (3) and (4) in Table 1) may influence the reaction rate at T9 ∼ 0.055. If the corresponding Ni are left as free parameters, values compatible with zero are inferred from the data fitting. Therefore, to set an upper limit we shifted the 84.3 keV peak by 1 energy bin (the energy uncertainty) and added a Gaussian as large as possible, within the total error shown in the Figure 11. In this way, we could set an upper limit to the THM strength summed over the contributions of the resonances around 200 keV (states (3) and (4) in Table 1) equal to 8.6% of the strength of the 84.3 keV resonance.
Then, since the THM strengths are deduced in arbitrary units, we need to single out one or more measured resonance strengths for normalization, following the procedure outlined in La Cognata et al. (2010). These resonances have to sit at energies larger than those for which electron screening effects are expected (see Sergi et al. 2015 for a discussion about electron screening in resonant reactions) and, obviously, a smaller uncertainty would imply a lower normalization error. Moreover, if normalization is extended to more than one resonance, La Cognata et al. (2015) shows that a significant reduction in unpredictable systematic errors affecting direct measurements can be achieved. That said, model dependence in this application of the THM is strongly reduced thanks to the use of double ratios as shown in La Cognata et al. (2010). Given their resonance energies and the uncertainties affecting their strengths (Table 1), and since they are prominent among other peaks in Figure 11, two resonances at 903.54 keV (9) and 1388.8 keV (12) are particularly suited for normalization of the THM strengths. The normalized strengths are shown in Table 2, together with the resulting weighted average.
Table 2. Strengths of the Levels in the 27Al(p,α)24Mg Reaction
 (keV) (keV) | Jπ | ω γ (eV) a | δ ω γ (eV) a | ω γ (eV) b | δ ω γ (eV) b | ω γ (eV) c | δ ω γ (eV) c | |
|---|---|---|---|---|---|---|---|---|
| (1) | 71.5 | 2+ | 9.28 × 10⁻¹⁵ | ⋯ | 7.17 × 10⁻¹⁵ | ⋯ | 8.23 × 10⁻¹⁵ | ⋯ |
| (2) | 84.3 | 1− | 1.90 × 10⁻¹⁴ | 4.7 × 10⁻¹⁵ | 1.47 × 10⁻¹⁴ | 4.3 × 10⁻¹⁵ | 1.67 × 10⁻¹⁴ | 3.2 × 10⁻¹⁵ |
| (3) | 193.5 | 2+ | 2.82 × 10⁻⁷ | ⋯ | 2.18 × 10⁻⁷ | ⋯ | 2.50 × 10⁻⁷ | ⋯ |
| (4) | 214.7 | 3− | 4.92 × 10⁻⁸ | ⋯ | 3.80 × 10⁻⁸ | ⋯ | 4.36 × 10⁻⁸ | ⋯ |
| (5) | 486.74 | 2+ | 0.122 | 0.031 | 0.094 | 0.028 | 0.107 | 0.021 |
| (6) | 609.49 | 3− | 0.282 | 0.082 | 0.218 | 0.071 | 0.245 | 0.054 |
| (7) | 705.08 | 1− d | 0.30 | 0.10 | 0.232 | 0.086 | 0.261 | 0.065 |
| (8) | 855.85 | 3− e | 0.71 | 0.56 | 0.55 | 0.44 | 0.61 | 0.35 |
| (9) | 903.54 | 3− | 4.3 | 0.4 | 3.3 | 1.2 | 4.20 | 0.38 |
| (10) | 1140.88 | 2+ | 83 | 21 | 64 | 19 | 73 | 14 |
| (11) | 1316.7 | 2+ | 142 | 43 | 110 | 37 | 124 | 28 |
| (12) | 1388.8 | 1− | 70 | 18 | 54 | 15 | 61 | 12 |
Notes. Best values are given in the two rightmost columns. Resonance energies and spin-parities are the same as in Table 1 if not otherwise noted. Strengths in italic are upper limits.
a Strengths normalized to the resonance at 903.54 keV and corresponding error. b Strengths normalized to the resonance at 1388.8 keV and corresponding error. c Weighted average of the two results and corresponding error. d Our analysis suggests this state is more compatible with a 1− instead of a 2+ assignment, in agreement with Nann (1982). e Our analysis suggests this state is more compatible with a 3− instead of a 2+ assignment. In the NuDat2 database 2.8 (2021), the attribution is uncertain, while Endt (1998) lists a nearby possible 3− state that we would not be able to resolve.Download table as: ASCIITypeset image
In the determination of the strengths of the unresolved states at 193.5 and 214.7 keV ((3) and (4)), the upper limits recorded in Table 2 are calculated by attributing the whole THM strength to each of the states. Therefore, we definitively overestimate the upper limit we could set from our data. However, a simplified hypothesis such as attributing half of the THM strength to each state might lead to an underestimate of the constraint. Indeed, from La Cognata et al. (2010) we know that the ruling factor entering the determination of the strength from the THM one is the penetration factor Pl (kr) for the relevant wave l in the entrance channel. For the mentioned states we have s- and p-waves, respectively, so even weights in the THM strengths would result in very asymmetrical on-energy-shell strengths. We will address the calculation of the reaction rate in the corresponding temperature region in the next section.
From the comparison with Table 1, our calculations point to a change in the attribution of the spin-parity of the resonances at 705.08 keV and 855.85 keV. While the most recent tabulations in the NuDat2 database 2.8 (2021) prefer (yet the attribution is tentative) Jπ = 2+ for both, the sensitivity to orbital momentum of formulas used to deduce strengths from THM data leads us to a different choice for the spin-parities, even if uncertainties are quite large, due to the relative weakness of these states. Regarding the state at 705.08 keV (7), the 1− preference is supported by the (3He, d) transfer data in Nann (1982). In the case of the 855.85 keV state, Endt (1998) lists a nearby 3− state we would not be able to separate owing to the present-experiment energy resolution.
The error budget enumerated in Table 2 incorporates all the sources of uncertainty. They include the statistical error, ranging from about 3% to 10%, the angular distribution integration uncertainty discussed in Section 4.3, the error arising from the disentanglement of the peaks in the THM cross section of Figure 11 (up to 80% for the resonance at 855.85 keV (8)) and the normalization error, corresponding to the uncertainties affecting the resonances at 903.54 keV and 1388.8 keV ((9) and (12)) used for normalization. This latest source of uncertainty is generally the largest one (except in the case of the 855.85 keV resonance (8), as mentioned earlier); since the errors on the normalization resonances are the dominant ones and they are independent, we use standard formulas for error propagation on the weighted averaged strengths in the rightmost column of Table 2. Resonances between the ones at 903.54 keV (9) and 1388.8 keV (12) were not used in the normalization procedure since their strengths have a 34% error, larger than the one affecting the peaks used in our normalization (see Table 2), so in the weighted mean such resonances have a minor effect. Further, resonances (10) and (11) are observed as shoulders for which the quality of the fit might be not as good as for the others. The comparison between Tables 1 and 2 shows a very good agreement between the THM resonant strengths and the ones in the literature, except in the case of the resonance at 705.08 keV (7), but for this resonance a different spin-parity assignment might justify the origin of the difference (that is, however, less than 2 standard deviations).
To summarize the present section, the most important achievement of the present work is the observation and accurate assessment of the strength of the 84.3 keV resonance in the 27Al(p,α)24Mg reaction, sitting right at astrophysical energies. Such a resonance has an important impact on the reaction rate that is discussed in the next section. Furthermore, thanks to the application of the THM, the deduced resonance strength is devoid of electron screening effects, as requested for astrophysical applications.
5. The Monte Carlo Reaction Rate
For astrophysical applications, we calculated the reaction rate adopting the detailed Monte Carlo method that makes use of the code RatesMC (Iliadis et al. 2010b, 2015). The main advantage of the code is a statistically sound treatment of the uncertainties, including the use of the Porter–Thomas distribution to properly account for upper limits on the resonance strengths, as well as of a lognormal probability density for measured resonance strengths and for the reaction rate. In particular, in what follows we will express the low rate, median (best) rate, and high rate as the 16th, 50th, and 84th percentiles of the cumulative rate distribution, respectively, as discussed in, e.g., Sallaska et al. (2013).
In the calculation of the reaction rate, while the strengths were taken from Table 2 (columns 8 and 9), since the error on the rate depends exponentially on the uncertainty on the resonance energies we set the values of the latter to those in Iliadis et al. (2010b). Resonances not observed in the present work were taken from this latter source as well. As for the unresolved states around 200 keV (3) and (4), for which we could only set a total upper limit, the very different strengths calculated using the THM approach owing to the different entrance-channel waves make it possible to establish a reliable upper limit for the reaction rate. Indeed, from Table 2 we find that even by attributing the whole THM strength to the 214.7 keV resonance we would not come close to the strength of the 193.5 keV resonance, while a decrease of the THM strength of the latter (to increase that of the 214.7 keV resonance, to keep the sum constant) would cause a sizeable reduction in the rate. Therefore, in the calculation of the THM reaction rate we will neglect the 214.7 keV resonance since, based on our data, the upper limit to the total strength is achieved considering the 193.5 keV resonance only.
Figure 12 shows the comparison of the reaction rate calculated using the present-work strengths to the STARLIB one (Iliadis et al. 2010b; Sallaska et al. 2013). In detail, we demonstrate the ratios of median and low/high rates to the STARLIB recommended rate. Black lines and symbols are used for the rate in the literature, while the median and the low/high THM rates are denoted by green and red lines and symbols, respectively. While the uncertainties are still quite large, especially above about T9 ∼ 0.1, because for some resonances we could set only upper limits (though lower than in Iliadis et al. 2010b), the most important result is a reduction of a factor of about 3 of the reaction rate right at the temperatures of astrophysical interest, below T9 ∼ 0.1 (see the vertical band in Figure 4 of La Cognata et al. 2022). The role of uncertainties is better displayed in Figure 13, where the rate probability density is shown. Figure 14 makes it possible to better understand the main sources of uncertainties, since such a figure displays the fractional contribution of each resonance to the reaction rate. In detail, since we could observe the 84.3 keV resonance in the present work, we can effectively constrain the reaction rate at T9 ∼ 0.07–0.08, which are the temperatures of primary astrophysical interest; at lower and higher temperatures, uncertainties grow larger owing to the fact we could only set upper limits for the strengths of the states at 71.5 keV and 193.5–214.7 keV. For higher temperatures, the result coincides essentially with the STARLIB reaction rate (Iliadis et al. 2010b).

Figure 12. Comparison of THM reaction rate calculated in the present work with the one listed in the STARLIB compilation (Iliadis et al. 2010b; Sallaska et al. 2013). Both median rates and the low/high values are divided by the STARLIB recommended rate. Black lines and circles are used for the latter, while the THM median (low/high) rate is displayed in green (red).
Download figure:
Standard image High-resolution image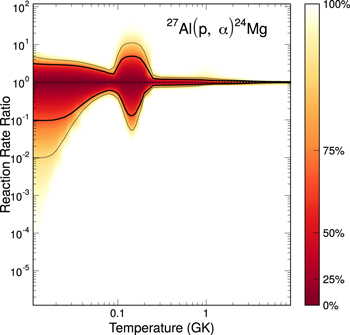
Figure 13. Uncertainty plot of the THM reaction rate, taken to equal one over the whole examined temperature range. The thick lines are used to encompass the 68% confidence interval, while the thin lines are used for the 95% one.
Download figure:
Standard image High-resolution image
Figure 14. Fractional contributions of the most relevant resonances in the 27Al(p,α)24Mg astrophysical factor to the total reaction rate. Present-work strengths are used when available, as listed in Table 2, otherwise the same contributions as in Iliadis et al. (2010b) are considered. Hatched areas highlight the uncertainties, while a dotted line is used for the contribution of higher energy resonances.
Download figure:
Standard image High-resolution imageThe large reduction of the 27Al(p,α)24Mg reaction rate below T9 ∼ 0.1 rate might have important consequences for the understanding of nucleosynthesis involving the MgAl cycles and the relative abundances of Mg and Al isotopes, in particular in the case of 26Al. The analysis of the impact of such results are presented hereafter.
6. The Impact of the New Reaction Rate in the Astrophysical Context
As mentioned in the introduction, the closure of the MgAl cycle is still debated because of the uncertainties of the cross sections of both the 27Al(p,α)24Mg and the 27Al(p,γ)28Si reactions. Figure 15 shows the reaction rate 27Al(p,α)24Mg presented in this work (red curve and dashed area) and the one from Iliadis et al. (2010b; in green) normalized to the 27Al(p,γ)28Si from Iliadis et al. (2010b; in black). As illustrated in panel A, in the temperature range of our investigation the (p,α) channel dominates over the (p,γ) one at T9 ≥ 1, while the two reaction rates are comparable within their uncertainties at 0.015 ≤ T9 ≤ 0.08, this latter range being the temperature range of H-burning nucleosynthesis. In particular, the MgAl cycle seems to be closed in the range 0.015 ≤ T9 ≤ 0.063 according with the recommended value of the 27Al(p,α)24Mg suggested by Iliadis et al. (2010b), but this window is reduced to the smaller interval 0.017–0.027 GK (0.015–0.048 GK considering the uncertainties) when considering the reaction rate presented in this paper (see the zoom-in panel B for details).
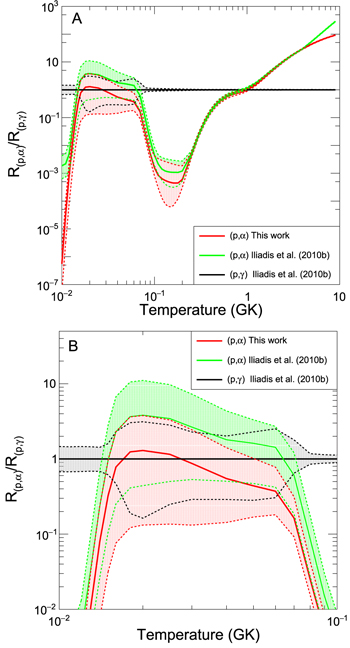
Figure 15. Comparison of the 27Al(p,α)24Mg THM reaction rate calculated in the present work (red line) and the one by Iliadis et al. (2010b; green line) with the 27Al(p,γ)24Mg reaction rate listed by Iliadis et al. (2010b; black line). Dashed areas and dotted lines highlight the uncertainties.
Download figure:
Standard image High-resolution imageAs far as the stellar yields of the stars are concerned, we focus our analysis on the possible impact of our 27Al(p,α)24Mg reaction rates in the nucleosynthesis of 27Al and 24Mg in 4–8 M⊙ stars, that during the AGB lifetime experience hot bottom burning (HBB). We choose these stars as a test bench because HBB consists in the activation of proton-capture nucleosynthesis at the base of the convective envelope, once the temperatures in those regions, Tbce, exceed ∼30 MK, and then the resulting stellar surface abundances can be sensitive to the variation of the reaction rate even at temperatures too small to affect the H-burning shell nucleosynthesis. HBB modifies the surface chemistry of the stars according to the equilibrium abundances of the p-capture nucleosynthesis activated, that, in turn, depends on Tbce. The activation of MgAl cycling, relevant for the present analysis, occurs for Tbce > 70 MK. This threshold temperature is reached by all M > 4 M⊙ stars, as shown in Figure 16, showing the time variation of Tbce in solar metallicity model stars of different masses.
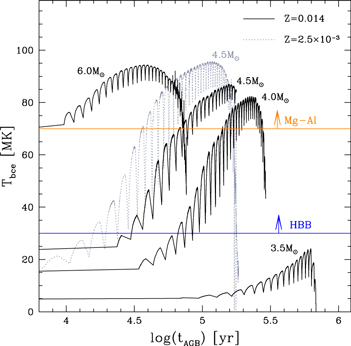
Figure 16. Evolution of the temperature at the base of the convective envelope as function of the time counted from the beginning of the AGB phase. Stars with 3.5, 4.0, 4.5, and 6.0 M⊙ initial masses are shown. Black solid lines refer to Z = 0.014 models, while the gray dotted line represents a 4.5 M⊙ initial mass model at Z = 2.5 × 10⁻³. The blue and orange horizontal lines indicate the minimum temperature for the ignition of the HBB and MgAl cycle, respectively.
Download figure:
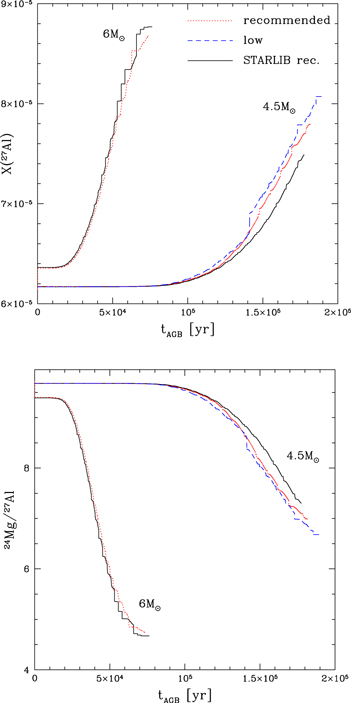
Standard image High-resolution imageWe inspect the AGB evolution of intermediate-mass stars at solar metallicity (Z = 0.014) computed with the stellar evolution code ATON (Ventura et al. 1998). We select the 4.5 M⊙ and 6 M⊙ model stars as example cases of stars experiencing mild and strong HBB nucleosynthesis, respectively. We compare the results obtained by adopting the recommended STARLIB rates for the 27Al(p,α)24Mg reaction (Iliadis et al. 2010b), commonly used in the literature, and the standard nuclear rates presented in this work. The results are shown in Figure 17, reporting the time variation of the surface 27Al (first panel) and of the ratio 24Mg/27Al (second panel) in the two cases. Negligible differences are found in the 6 M⊙ case: the temperatures at the base of the envelope are so hot (above 80 MK; see Figure 16) that the 27Al(p,γ)28Si channel is by far the dominating modality to destroy aluminum (see Figure 15). However, the α channel dominates at lower temperatures. Indeed, in the case of the 4.5 M⊙ star we find a ∼5% increase in the surface 27Al when the new rates for 27Al(p,α)24Mg are adopted, a difference that rises to ∼25% when the lower limits are used. 24Mg abundances and the 24Mg/27Al ratio are scarcely affected by these changes, as the initial 24Mg is much higher than 27Al; thus the percentage variations are significantly smaller (see the bottom panel of Figure 17). Consequently, the effect on the other elements of the MgAl cycle is negligible, with changes that are on the order of the numerical uncertainties. In particular, it is difficult to isolate the variation due to the new rate for the 25Mg and 26Al abundances, which are also sensitive to the effect of the third dredge-up that brings to the surface the results of the 22Ne(α,n)25Mg reaction active in the He-burning shell during the thermal pulse (Karakas & Lattanzio 2003; Karakas et al. 2006). We do not find variations of the 26Al/27Al ratio due to the new rate presented in this work that affect the current interpretation of the presolar grains progenitors.
Figure 17. The time variation of the surface mass fraction of 27Al (upper panel) and 24Mg/27Al ratio (bottom panel) during the AGB phase for stars with initial masses 4.5 and 6 M⊙. The results for different rates are shown: recommended STARLIB (solid black line), median (dotted red line), and low (dashed blue line) rates from the present work.
Download figure:
Standard image High-resolution image
The differences in the 27Al yields of intermediate-mass stars related to the new reaction rates are higher at solar metallicities compared to metal-poor stars. In Figure 16 we compare the evolution of the Tbce for a 4.5M⊙ model at solar metallicity and at Z = 2.5 × 10⁻³ ([Fe/H] = −1). In the latter case, the temperature steeply rises above 80MK, resulting in a stronger HBB (Dell'Agli et al. 2018a). Therefore, in the metal-poor domain the 27Al destruction rate is entirely due to the (p,γ) channel, which renders the results independent of the 27Al(p,α)24Mg rate. The above arguments show that an exhaustive analysis of the uncertainties of the 27Al yields from intermediate-mass stars, to be extended to the metal-poor domain, demands the investigation of the relative variation of the γ-channel. This is crucial, for example, to study the formation of multiple populations in globular clusters, where the winds of AGB stars have been proposed as pollutants of the interstellar medium from which new generations of stars, which among others exhibit clear traces of Al enhancement, formed. Based on these findings, the investigation of the γ-channel has been undertaken and new results are expected in the next few years.
7. Concluding Remarks
In this work, we report on the investigation of the 27Al(p,α)24Mg reaction rate by means of the THM, in its version adapted to narrow resonances (La Cognata et al. 2010), applied to the 2H(27Al,α24Mg)n three-body reaction. In particular, the work focuses on the examination of the astrophysical energy region at about 80 keV, with the aim of measuring the strengths of low-lying resonances. Thanks to our approach, we could perform a high-accuracy measurement of the strength of the 84.3 keV resonance, devoid of typical systematic errors affecting direct measurements (linked to extrapolation or the electron screening effect) and spectroscopic studies (such as the ambiguities in the extraction of the spectroscopic factor due to degeneracies in optical potentials). We could also enforce stricter constraints on the upper limits of the 71.5 keV, 193.5 keV, and 214.7 keV resonances, leading to a reduction of a factor of about 3 in the reaction rate at temperatures where the MgAl cycle is especially important. The present work is based on the results of Palmerini et al. (2021), whose reanalysis led to the improved setup chosen for this second run. Our measurement extended to energies above the ones of astrophysical interest, making it possible perform normalization of the THM results to known resonances, as well as to carry out a validity test of the present work through the reproduction of the strengths of such higher energy resonances.
Concerning the question whether the MgAl cycle is closed or not in the energy range typical of stellar H-burning, the 27Al(p,α)24Mg reaction rate measured by the THM is generally lower than, though comparable within uncertainties to, the 27Al(p,γ)28Si rate reported by Iliadis et al. (2010b) for temperatures between 0.005 and 0.06 GK. Indeed, it has to be noticed that in that range of temperatures the new (p,α) rate is reduced with respect to the one by Iliadis et al. (2010b) by a factor of about 3, and the median value is larger than the (p,γ) one just in the narrow interval between 0.017 and 0.027 GK. Therefore, the THM measurement of the 27Al(p,α)24Mg cross section seems to suggest that the MgAl cycle would not be closed at typical temperatures of its burning (T ≥ 0.055 GK). This statement has to be confirmed by an accurate measurement also of the 27Al(p,γ)28Si reaction rate and it applies just to the median values, which are the ones usually employed in nucleosynthesis calculations.
Once employed in AGB star nucleosynthesis calculations, the new 27Al(p,α)24Mg reaction rate will increase the 27Al yields of the stars experiencing soft HBB by up to ∼25%, with differences with respect to the current predictions. This regards the stars of solar metallicity in the 4–5 M⊙ domain, in which the α-channel competes with the γ one in the destruction of 27Al. In stars of higher mass and, more generally, in the metal-poor domain, the temperatures at the base of the convective zone are so hot that the contribution from the α-channel to the overall aluminum depletion rate is negligible, rendering the result practically independent of the reaction rates investigated here. As a next step, we will proceed with the assessment of the 27Al(p,γ)28Si reaction rates, whose importance is further underscored by the present work, reducing the 27Al(p,α)24Mg reaction rate.
The authors are grateful to the LNS director and to the technical staff who made it possible to carry out a successful experiment under safe conditions, given the ongoing pandemic, right after Spring 2020 lockdown, thus restarting LNS accelerator-driven research activity. P.A. thanks the trustees and staff of the Claude Leon Foundation for support in the form of a postdoctoral fellowship. D.L. acknowledges the financial support by MIUR-Ministero dell'Istruzione, dell'Università e della Ricerca (Italian Ministry of Education, University, and Research), PON R&I 2014-2020—AIM (Attraction and International Mobility), project AIM1848704-3.