


Abstract
The dust cycle is the dominant driver of meteorology and climate on present-day Mars. Despite this, few studies have investigated the impact of dust interacting with incoming stellar radiation on the climate, habitability, and potential spectral signature of Mars-like exo-land planets. Dust availability is positively correlated with increasing soil aridity and therefore dust has significant potential to modify dynamics on dry land planets. In this work, we use an advanced Mars general circulation model to study the coupling between radiatively active dust and land planet climate at different stellar heating rates or planetary orbits. We find that radiatively active dust can significantly modify land planet climate. At Earth orbit, dust with optical properties similar to present-day Mars warms the planetary surface above 273 K and augments both the zonal mean circulation and the thermal tide, and in particular the semidiurnal component. As dust accumulates, peak heating rises off the planetary surface and the most active regions of dust lifting shift from the summer to winter hemisphere. Simulated spectra are nearly featureless across all wavelengths. We find that in order to accurately assess the climate and habitability of land planets it is critical to carefully consider that potential atmospheric dust budget and its radiative impact.
Export citation and abstract BibTeX RIS

Original content from this work may be used under the terms of the Creative Commons Attribution 4.0 licence. Any further distribution of this work must maintain attribution to the author(s) and the title of the work, journal citation and DOI.
1. Introduction
The next generation of space telescopes will open up new avenues to both discover and characterize terrestrial exoplanets within the habitable zones of their host stars. At the advent of this new age, it is critical that we develop tools to understand the driving factors behind different climate states, the habitable potential of diverse climatalogies, and the unique spectral fingerprints of terrestrial planets with highly variable surface states. NASA prerogatives to follow the water and search for Earth's planetary twin have focused the majority of research on the detection and characterization of ocean worlds and Earth-like planets. However, if our own solar system is representative of the expected planetary diversity, then terrestrial planets with variable amounts of surface water will be the rule rather than the exception. Recent studies have suggested that land planets may represent a group of habitable alternatives to water-rich planets and at the inner edge of the habitable zone where the limited water budget makes planets resistant to runaway greenhouse states (Abe et al. 2011) and around M-dwarf stars (Boutle et al. 2020; Ding & Wordsworth 2020). Further, given the favorable relative luminosities between planet and star, a large fraction of our first direct observations of terrestrial planets will likely be in dim M-dwarf stellar systems (Seager & Demming 2010). Planets in the habitable zone of these active stars and subject to extreme solar winds and storms are more likely to lose water easily (Ramirez & Kaltenegger 2014; Luger & Barnes 2015; Tian & Ida 2015). Land planets, or terrestrial worlds with a limited water inventory, are therefore not only interesting as climate end-members, but a thorough investigation and characterization of their unique climatological drivers is a critical step for our analysis and understanding of planetary habitability and future planetary observational spectra.
What will these planets be like and what climate factors will drive their climate evolution and potential habitability? What spectra will these planets offer? Can these spectra provide signatures of the basic climate conditions that reliably discriminate land planets from other planetary climates? The answers to these questions depend in large part on the interaction between the dust and water cycles. For example, land-dominated planets orbiting closer to their Sun might be dustier due to positive feedbacks between the increased solar heating rate and surface wind speeds that inject dust into the atmosphere. In direct contrast, land planets might counterintuitively become increasingly cloudy as dust particles that act as cloud condensation nuclei are mixed more efficiently throughout the atmosphere and warmer temperatures liberate greater amounts of water from frozen reservoirs.
Sorting through and evaluating these potential land planet climate states is further complicated by internal feedbacks within and between the dust and hydrological cycles or the potential for self-modulation. Dust radiative effects can alter local and large-scale conditions that either promote or suppress additional dust lifting. Through modifications to thermal gradients, radiatively active aerosols and clouds act to enhance or suppress buoyant uplift, contribute to the structure and magnitude of large-scale zonal mean flows, and amplify or reduce surface wind speeds that control further dust lifting. One salient example that has been observed on present-day Mars, the land planet in our own solar system backyard, is the growth and acceleration of regional dust storms to global scales that likely rely on positive feedbacks between dust radiative heating, local and large-scale dynamics, and additional dust lifting (Newman et al. 2002a; Rafkin 2009; Madeleine et al. 2011; Toigo et al. 2018). Similarly, radiatively active water ice clouds that nucleate on atmospheric dust particles have been demonstrated to broadly impact the Martian local and large-scale dynamics that drive dust-lifting events, liberate and advect water vapor, and modify the thermal tides (Wilson et al. 2008 Wilson et al. 2014, Madeleine et al. 2012, Jha & Kahre 2018, Hartwick et al. 2019).
Climate models can shed light on these feedbacks. Thus, with this paper we use a state-of-the-art Mars global climate model as a proxy to begin the study of land planets with limited water inventories and to assess the processes that control their unique climate systems. Since the magnitude of dust radiative feedbacks is proportional to both the overall atmospheric dust loading as well as the incoming solar heating rate, we focus first on the impacts of changing Mars' planetary orbit, and therefore its incident insolation (So), on the nature of its dust cycle. We simulate its climatology at So = 589 W m−2 and 1372 W m−2, representative of a move from Mars' present-day orbit to an Earth-like distance from the Sun. This orbital range will also help illuminate the possible climatic regimes of land planets in the habitable zones of stars, where most future observational campaigns will focus. To characterize the influence of internal dust cycle feedbacks and clearly discriminate between effects due to reduced orbit alone, simulations are performed with radiatively active as well as radiatively inert dust. As the surface fraction of water decreases and regolith is increasingly desiccated, the overall availability of mineral dust should increase. While we might safely ignore the radiative impact of dust on aqua planets or water-dominated planets, it is less obvious that the radiative impact of dust on land planets will be negligible. Despite the implied increase in dust on planets with limited water budgets, there has been limited focus on its climatological impact on land exoplanets.
We aim to address fundamental questions:
- 1.How is a land planet's dust cycle affected by its distance from the Sun and therefore the strength of solar heating?
- 2.What role do dust radiative feedbacks play and how do they change with orbital distance?
- 3.What components of the circulation are involved and how do they change surface lifting patterns?
We address these questions with a global circulation model, described in the next section. In Section 3.1, we show results from simulations of a Mars-like exoplanet with radiatively inert dust subject to an Earth-like irradiance (So = 1372 W m−2) and compare with simulations of present-day Mars (So = 589 W m−2). By comparing simulations without feedbacks by the dust cycle, we can isolate the direct influence of higher solar heating rates (i.e., orbital distance) on land planet climate. This is contrasted with simulations in the following Section 3.2 that vary the solar insolation but also calculate heating due to radiatively active atmospheric dust. We discuss the generation of a dust greenhouse in Section 3.3 and, in Section 3.4, the dynamical impacts of dust radiative heating and positive feedback cycles that determine the surface distribution and timing of surface dust lifting or dust activity on land planets at different orbits. We classify regimes of dust activity based on the dominant lifting mechanism and relative influence of dust radiative feedbacks and investigate the timing of transitions between regimes with So (Section 3.6). We also examine the spectral signature of dusty planets with and without radiatively active atmospheric dust (Section 3.7). Finally, in Section 4 we discuss potential habitability of land planets and remaining uncertainties in our simulation setup. We close with a discussion of the complex coupling between the dust and hydrological cycles that has been observed on present-day Mars and which will be the focus of future papers.
2. Model Description and Methodology
For this study we use the new NASA Ames Mars Global Climate Model (GCM), which couples the NOAA/GFDL cubed-sphere finite volume dynamical core and the physics packages from the NASA Ames Legacy Mars GCM described in Haberle et al. (2019). For the purposes of this study, we chose a 4° × 4° resolution grid with a hybrid sigma-pressure vertical coordinate system extending from the surface (∼ 610 Pa) to 0.02 Pa with 28 layers. Orbital properties including the planetary obliquity, eccentricity, and rotation rate match present-day Mars and are held constant across all simulations. The solar incident flux and sols per year are modified to represent a shift from a present-day Mars orbit (So = 589 W m−2) to a present-day Earth orbit (So = 1372 W m−2). The model utilizes topographic, thermal inertia, and albedo maps from the Mars Orbiter Laser Altimeter and Viking and Mars Global Surveyor Thermal Emission Spectrometer observations, respectively. The surface roughness is fixed to 0.01 m. Boundary layer physics employs the Mellor–Yamada level 2 hierarchy scheme adapted for Mars in Haberle et al. (1993, 1999) for turbulence closure as well as the Savijarvi (1995) and Hourdin et al. (1995) stability functions for surface fluxes of heat and momentum. Eddy mixing coefficients are calculated based on Arya (1988). To investigate the role of internal feedbacks on the dust cycle we implement a fully interactive dust cycle with parameterizations for dust devil and wind stress lifting (see Equations (1)–(3)). Physics descriptions can be found in Newman et al. (2002a), Newman et al. (2002b), Basu et al. (2004), and Kahre et al. (2006, 2008). Dust-lifting efficiency factors as well as the threshold wind stress have been chosen (tuned) to yield a seasonal variation of dust opacity similar to that observed on present-day Mars, without episodically varying regional- and global-scale storms. However, we note that these values are empirically rather than physically based and therefore may introduce unrealistic surface dust fluxes at different orbits. In particular, the threshold wind speed at which dust lifting can initiate (τ*) is model and resolution specific and is chosen to best match the spatial distribution of dust lifting across the planetary surface on present-day Mars. It is not obvious that this threshold would be unchanged under different orbital configurations. However, for the sake of easy comparison and without additional empirical constraints to better assess orbitally driven changes to dust lifting, we hold this factor constant. Similarly, we use the same lifting efficiency factors (α, αD ) for wind stress and dust devil schemes at each orbit. Lifting efficiency factors act as a multiplicative factor on the mass injected per lifting event. Equations (1)–(3) describe the mass injection schemes for dust based on wind stress and convective dust devil lifting. Here, τ is the surface wind stress. Fs is the sensible heat flux. ps and pcon are the surface pressure and the pressure at the top of the boundary layer, respectively. χ is the specific gas constant divided by the specific heat capacity. Dust can lift from any surface that exceeds the threshold lifting and that is clear of CO2 frost. Surface dust reservoirs are assumed to be infinite.


The size distribution of lifted dust is similarly constrained based on observations of the size of atmospheric dust particles and the overall dust optical depth on present-day Mars. Lifted dust is partitioned into a nonvarying log-normal distribution with an effective radius of 2.5 μm for wind stress lifting and 2 μm for dust devil lifting. The radii were chosen to produce a globally averaged effective radius of approximately 1.5 μm, which is consistent with observations of present-day Mars (Wolff et al. 2009). Both parameterizations use an effective variance of 0.5. In the atmosphere, dust is transported by simulated winds in a log-normal-based moment scheme described by the dust mass and number mixing ratios per kilogram of air. The transported size distribution evolves based on the weighted gravitational sedimentation rate.
Radiative heating and cooling rates are calculated as in Haberle et al. (2019) using a two-stream correlated-k radiative transfer scheme for gaseous CO2 and H2O (although our simulations are completely dry). In simulations with radiatively active dust, wavelength- and effective-particle-size-dependent aerosol scattering properties, including the extinction coefficient, single scattering albedo, and asymmetry factor are calculated using an offline Mie code based on dust refractive indices described in Wolff et al. (2010). In practice, at each model heating step, the transported moments are used to calculate the effective particle size and corresponding particle size distribution in bin space. The dust scattering properties used as inputs in the two-stream code are then calculated by summing over the total number of bins and weighting by cross-sectional area in each bin. The model runs with seven visible spectral bands (0.4–4.5 μm) and five infrared (IR) spectral bands (4.5–1000 μm).
Secondary interactions of the hydrological cycle with the planetary dust cycle (e.g., nucleation, growth and coagulation of cloud particles, modifications to snow albedo, etc.) are not considered at this time. We discuss the possible impact of parameterization choices including dust radiative properties, reservoir depth, etc., in more detail in Section 4.3.
We perform a total of three base simulations investigating the impact of both a shift in planetary orbit, and therefore solar heating rate, as well as the radiative impact of atmospheric dust. Simulation A models a land planet at present-day Mars orbit. Simulations B and C consider a land planet located at the orbit of present-day Earth. All simulations use the interactive dust-lifting scheme described above. Dust is radiatively inert in simulations A and B and radiatively active in simulation C. We perform an additional five simulations with radiatively active dust, including a simulation at Mars orbit with radiatively active dust (simulation D), as a parameter space investigation between Mars and Earth orbits. We also perform simulations with a diurnally averaged heating rate to isolate the impact of the thermal tide (see Section 3.4.2). Simulations are summarized in Table 1.
Table 1. Simulation List
| Simulation | Solar Constant (W m−2) | Orbital Radius (AU) | Orbital Period (sols) | Radiatively Active Dust? | |
|---|---|---|---|---|---|
| Base simulations | A | 589 | 1.53 (Mars) | 668 | N |
| B | 1372 | 1.0 (Earth) | 360 | N | |
| C | 1372 | 1.0 (Earth) | 360 | Y | |
| Additional parameter sweep | Far 1 | 450 | 1.75 | 830 | Y |
| D | 589 | 1.53 | 668 | Y | |
| Intermediate 1 | 800 | 1.31 | 540 | Y | |
| Intermediate 2 | 1000 | 1.17 | 460 | Y | |
| Intermediate 3 | 1200 | 1.07 | 400 | Y |
Download table as: ASCIITypeset image
3. Results
Orbital changes that increase or decrease the total planetary insolation impact climate both directly and indirectly. Direct effects result from changes to the atmospheric and surface heating rates when So is modified. By contrast, atmospheric aerosols that scatter and absorb incoming solar and outgoing IR radiation represent an indirect or secondary result of changes to the solar heating rate that can modify atmospheric thermal profiles and local and large-scale dynamics. On land planets with potentially large atmospheric dust loads, understanding the relative impact of the direct and indirect forcing is critical. Our goal in this work is both to better understand the role of dust as a driver of land planet climate while also assessing its impact on land planet spectra and the required model complexity to accurately capture land planet climate. If the indirect impact of radiatively active dust is negligible compared with direct influence of So or other orbital characteristics, then dust radiative effects could be safely ignored when we evaluate potential climate and habitability. By contrast, if the indirect influence of atmospheric dust has an outsize or significant impact on climate and spectral signatures, its effects will need to be accounted for in future studies. We first investigate the direct impacts of changes to So by comparing simulations of a Mars-like exoplanet with radiatively inert dust subject to Mars-like and Earth-like irradiances (So = 589 W m−2 and 1372 W m−2, simulations A and B). By comparing simulations without dust radiative feedbacks, we can isolate the direct influence of higher solar heating rates (i.e., orbital distance) on land planet climate. As a result, climatological changes can be attributed to direct solar influences alone. This is contrasted with simulations in the following Section 3.2 that vary the solar insolation but also calculate heating due to radiatively active atmospheric dust.
3.1. Inert Dust Simulations at Mars and Earth Orbit
Changes to the planetary climate due to the direct influence of solar heating are significant but do not generate substantial departures from known climate trends observed on present-day Mars. Figure 1 shows the global, diurnal average values of surface temperature, pressure, and dust mass lifting rates versus aerocentric longitude (Ls), a measure of the time of year based on the planetary orbital position. Mars' low atmospheric density and surface thermal inertia means that So has a large impact on the global average surface temperature. At both orbital configurations, the minimum temperatures occur at aphelion (∼Ls = 70°) and maximum temperatures at perihelion (∼Ls = 250°). On average, surface temperatures at Earth orbit exceed those at Mars orbit by approximately 30–50 K. However, even at Earth orbit, global average temperatures do not exceed the water freezing point, a common early indication for habitability, although temperatures can exceed freezing locally. Despite higher average surface temperatures, winter polar temperatures periodically drop below the CO2 frost point, which initiates CO2 condensation at southern hemisphere (SH) winter (Ls = 90°) and, to a lesser extent, at northern hemisphere (NH) winter (Ls = 270°). As a result, at both Mars and Earth orbits, the global average surface pressure follows a strong seasonal cycle with a deep pressure minimum at mid southern winter when the south polar cap reaches its maximum size. As is expected for planets with a higher global average surface temperature, the magnitude of the simulated pressure cycle is reduced at Earth orbit compared with Mars orbit, in particular at NH winter solstice (Figure 1(b)). The depth of the pressure minimum at Earth orbit is also reduced due to the shorter year and therefore cumulative time permitting for CO2 condensation and the growth of the south polar cap.

Figure 1. Global average (a) surface temperature (K), (b) surface pressure (Pa), and (c) lifting rates (g m−2 sol−1) for inert dust simulations at Mars (blue) and Earth (orange) orbits vs. time of year (Ls). Dotted lines in panel (c) show the contribution of dust devil lifting to the total dust mass, dashed lines show wind-driven lifting.
Download figure:
Standard image High-resolution imageCompared with present-day Mars, the nominal SH summer (Ls = 270°) dusty season at Earth orbit is both dustier and extends longer. Atmospheric dust on Mars is lofted from surface deposits in one of two ways, via convective dust devils or via wind-driven saltation-sandblasting in regions with high local surface wind stress. Figure 1(c) shows the total global average atmospheric dust at both orbits and the contribution of each dust-lifting type. For simulations at Mars orbit, dust devil lifting is the dominant source of atmospheric dust except for a narrow range of Ls near Ls ∼240°, when wind stress lifting peaks (Figure 1(c)). This pattern is expected for simple inert dust simulations with interactive lifting but does not perfectly reproduce the observed seasonality and dust activity on present-day Mars, e.g., the nominal B or C season storms (Kass et al. 2016). More complex parameterizations that include dust and cloud radiative feedbacks generate a closer match to the observed present-day Mars dust cycle. However, for the purpose of this study, which focuses on the broad shifts in dust activity, it is not necessary to capture these finer details.
At Earth orbit, higher surface heating generates stronger winds globally. While wind-driven lifting is almost exclusively restricted to the perihelion summer hemisphere on present-day Mars, surface wind stresses exceed the initiation threshold by a greater amount across a broader fraction of the planetary surface and for a greater proportion of the year when Mars is at Earth's orbital distance. We can see this more clearly by comparing the spatial distribution of surface dust lifting or dust activity at Mars and Earth orbits (Figure 2). At both orbits, the amount of atmospheric dust as well as the magnitude of dust-lifting events is smaller at orbital aphelion compared to orbital perihelion. Regions with high dust activity represent regions with active wind-stress lifting. In inert dust simulations at both Mars and Earth orbits, the background mean surface stress is generally too small to initiate wind-stress lifting. Local augmentation by the thermal tides, slope flows, and transient eddy activity is critical. As on present-day Mars, large diurnal temperature variations, particularly over regions with extreme topographic relief or with spatially varying surface thermal properties, enhance winds and are responsible for the majority of wind-driven dust-lifting events (Richardson & Wilson 2002; Zalucha et al. 2010). For example, NH winter solstitial surface wind stress and dust lifting are highest along the northern rim of Hellas basin, on the eastern rim of Argyre, and at the northern boundary of the receding seasonal polar cap. Importantly, these patterns do not change when the solar forcing is increased. In other words, despite a 2.3-fold increase in the solar heating rate, simulations at Earth orbit remain qualitatively Mars-like when the spatial and temporal patterns of dust lifting are compared. The most significant departure in simulations at Earth orbit is to the overall magnitude of storm systems. Since wind stresses are greater when surface heating is higher, more dust is injected per lifting event and over a larger area of the planet. For example, the maximum mass lifting rate at Earth orbit is 12.24 g m−2 sol−1, centered along the northwestern edge of Hellas basin, compared with 2.89 g m−2 sol−1 at approximately the same location in simulations at Mars orbit. In all simulation years, SH summer dust activity produces the highest annual dust loading.
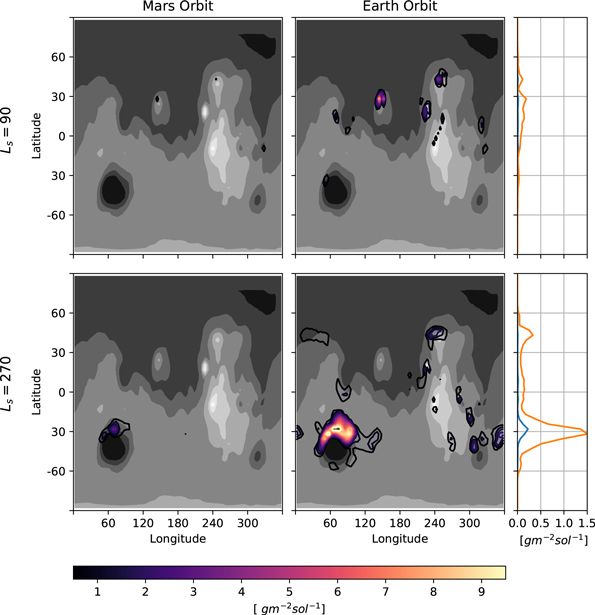
Figure 2. Solstitial dust wind stress lifting rates (g m−2 sol−1) for inert dust simulations at Mars and Earth orbits. Gray contours show the surface topography. Line plots show the zonal average wind stress lifting rates (g m−2 sol−1) for Mars orbit (blue) and Earth orbit (orange).
Download figure:
Standard image High-resolution imageChanges to the magnitude of the simulated dust activity in part reflect changes to the large-scale solstitial dynamics (Figure 3). Compared to simulations at Mars orbit, the westerly zonal wind generated at Earth orbit is stronger in the winter hemisphere as latitudinal temperature gradients are tighter. Tropical easterlies also increase. These changes are most pronounced near NH winter solstice (Ls = 270°). The cross-hemispheric Hadley circulation strengthens, but remains structurally similar, having only slightly expanded both vertically and latitudinally near NH winter solstice. Adiabatic warming in the descending branch of the Hadley cell increases polar middle and upper atmospheric temperatures by ∼40 K. Again, while the overall strength of the circulation increases due to higher solar heating rates, the general pattern observed at Mars orbit is preserved. In general, the impact of insolation therefore appears to be a continuous strengthening of observed circulation patterns rather than a wholesale reorganization or departure.
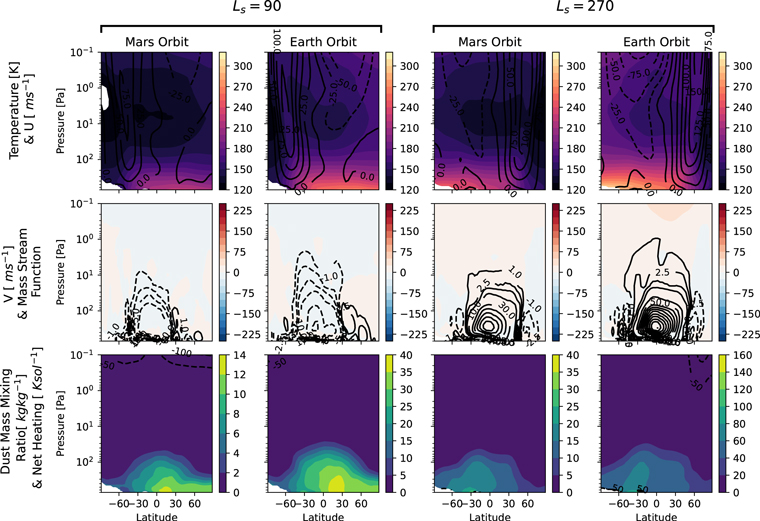
Figure 3. Comparison of the solstitial zonal mean circulation vs. pressure in inert dust simulations at Mars and Earth orbits. Top row: Temperature (K) (filled contours) and zonal wind (m s−1) (contour lines); middle row: meridional wind (m s−1) (filled contours) and mass stream function (kg m−2 s−1 × 10⁸) (contour lines); bottom row: dust mass mixing ratio (kg kg−1 × 10⁶) (filled contours) and the net heating rate (K sol−1) (contour lines). Note the change in contour scale for dust mass mixing ratio in row 3
Download figure:
Standard image High-resolution image3.2. Active and Inert Dust Simulations at Earth Orbit
Although the simulated dust cycle is strengthened by increased solar heating, inert dust simulations are still recognizably Mars-like. By contrast, when dust is radiatively active, the climate diverges considerably from this base state. In fact, the impact of radiatively active dust on the overall climate eclipses changes due to increased solar heating alone. Critically, radiative heating by dust warms the planetary atmosphere and surface, generates positive feedbacks that promote further dust lifting, and, through shifts in the large-scale planetary atmospheric dynamics, fundamentally modifies both the spatial distribution of dust lifting and the timing of storms. Simulations that neglect radiative feedbacks by dust may therefore misrepresent land planet climate with broad implications for habitability.
Figure 4 shows the global average surface temperature, surface pressure, dust optical depth, and dust-lifting rates for simulations with radiatively inert and active dust at Earth orbit. The driving difference between these two simulations is therefore the indirect influence of dust radiative heating as opposed to solar insolation as in Section 3.1. Average surface temperatures increase relative to simulations with inert dust by approximately 10–40 K for the duration of the year (Figure 4(a)). Significantly, the magnitude of this increase is comparable to the simulated surface warming due to the increase in So (30–50 K). Surface temperatures remain above the water freezing point except for a short period of time around aphelion. Higher wintertime temperatures, which can be partially attributed to the dust greenhouse effect (see Section 3.3), limit solstitial CO2 condensation. As a result, the annual pressure cycle stabilizes and the CO2 cycle disappears (Figure 4(b)). The most significant modification, however, is to the simulated dust cycle (Figures 4(c) and (d)). The total atmospheric dust in radiatively active dust simulations increases by almost two orders of magnitude compared with inert dust simulations. The global average visible dust optical depth exceeds ∼15 for the duration of the year and regularly exceeds 30–50, meaning that little sunlight reaches the planetary surface except at the highest elevations (Figure 4(c)). As a result, dust devil lifting halts, and all lifting transitions to wind stress lifting (Figure 4(d)). Notably, the most dramatic increase in dust lifting is at the NH summer solstice (Ls = 90°) where dust devil lifting previously dominated. In simulations with active dust, NH summer solstitial atmospheric dust levels are now within approximately 60% of NH winter solstitial maximum. Rather than a single NH winter solstitial dusty season as on present-day Mars, simulations with radiatively active dust exhibit biannual solstitial dusty seasons. The relative magnitude of the simulated solstitial dust maxima in these simulations results from Mars' eccentric orbit, which causes differences in both the length and total solar heating rate at each solstice, and, importantly, Mars' unique topography. The north to south cross-equatorial slope strongly suppresses the zonal mean circulation at NH summer solstice. This asymmetrical forcing accentuates the difference between the two solstice seasons during low dust conditions (Richardson & Wilson 2002; Zalucha et al. 2010). The inhibiting effect on circulation is reduced as the lower atmosphere is increasingly stabilized with increasing dust loading (Barnes et al. 2017, their Figure 9.11). Seasonal forcing will be modified based on the timescales of dust increase and decay relative to the seasonal cycle, which also depends on the distribution and depth of surface dust reservoirs, the lifted dust size distribution, and dust sink mechanisms (e.g., cloud scavenging).
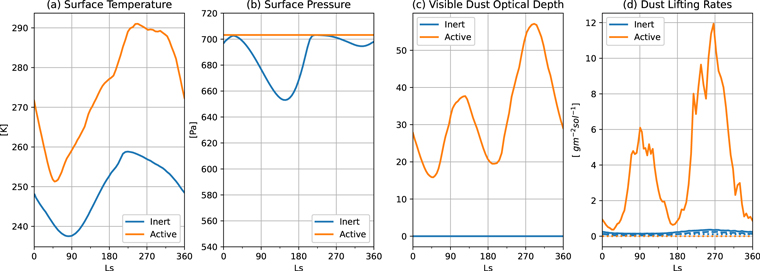
Figure 4. (as in Figure 1) Global average (a) surface temperature (K), (b) surface pressure (Pa), (c) visible dust optical depth, and (d) dust lifting rates (g m−2 sol−1) vs. time of year (Ls) for inert (blue) and active (orange) dust simulations at Earth orbit. Dotted lines in panel (d) show the contribution of dust devil lifting to the total dust mass, dashed lines show wind-driven lifting.
Download figure:
Standard image High-resolution image3.3. The Dust Greenhouse
Despite accumulation of large amounts of atmospheric dust that leads to an increase in the planetary albedo (Figure 5(a)) and hence a reduction in absorbed sunlight, surface temperatures in active dust simulations increase globally (Figure 5(b)). This is because the high dust levels in our simulations provide a very strong greenhouse effect. On present-day Mars and on land planets with limited atmospheric dust loading, the majority of sunlight reaches and is absorbed by the planetary surface. Mars' thin atmosphere traps very little outgoing IR thermal radiation, so the emission to space level is at or very near the planetary surface, and the planetary blackbody temperature is approximately equal to the observed or simulated surface temperature. In rare cases, as during global dust events, dust heating can generate moderate surface warming (Elteto & Toon 2010; Streeter et al. 2019). If land planet dust has optical properties similar to those observed on Mars that absorb and emit strongly in the IR, the net emission-to-space level, the level at which the cumulative IR opacity from that point to the top of the atmosphere reaches unity, lifts off the surface and moves upwards as dust accumulates.

Figure 5. (a) Global average planetary albedo (45S–45N) for a land planet with radiatively active dust vs. time of year (Ls) at Mars orbit compared with Earth orbit, (b) annual average surface temperature difference (K) between active and inert dust simulations at Earth orbit, (c) annual average atmospheric temperatures vs. pressure for the Earth orbit, active dust simulations. The 273K surface temperature contour is indicated in black in panel (b). The equator is warmer than the poles. The IR emission to space level, the level where the top-down cumulative IR optical depth reaches unity, is represented by the solid white line in panel (c).
Download figure:
Standard image High-resolution imageIn radiatively active dust simulations at Earth orbit, the emission to space level rises to approximately 10–30 Pa planetwide, high in the atmosphere where temperatures are much cooler than the surface and average between 210 and 250 K (Figure 5(c)). As the IR opacity increases surface temperatures increase and the radiation to space level must rise to cooler levels in the atmosphere to maintain energy balance. In our simulations, the dust greenhouse raises annual average surface temperatures by ∼10–50 K compared with inert dust simulations (Figure 5(b)). The annual average surface temperature exceeds 273 K at all latitudes equatorward of approximately 40° N and S. Despite significant surface shading, land planets with high atmospheric dust loads and favorable dust optical properties (as determined by the particle size and minerology) therefore can potentially be more habitable than their dust-free counterparts. At the same time, if future observations cannot easily discriminate between the planetary surface and an optically thick high-altitude atmospheric dust layer, it may be easy to erroneously predict prohibitively cold surface temperatures. We discuss the habitability implications of the dust greenhouse in Section 4.2.2 and the greenhouse dependence on particle size and composition in Section 4.3.1.
3.4. Dust Radiative Effects on Selected Components of the General Circulation
The components of terrestrial planet atmospheric circulation include the zonal mean flow, and spatial and temporal perturbations or eddies of various scales. For a rotating planet, important eddies include baroclinic transient eddies, stationary eddies related to the topography and surface thermal properties, and the thermal tide. It is well established that dust affects these components for present-day Mars. In the following sections, we focus on the impact of radiatively active dust on the mean circulation and the thermal tides, the key components that contribute to the dust distribution and surface lifting patterns. While transient eddy activity associated with baroclinic instabilities along the winter polar vortex contributes to the initiation and growth of storm systems on present-day Mars (Wang et al. 2003, Wu et al. 2022), their subsequent influence on the dust cycle is greatly reduced as atmospheric dust accumulates and the atmospheric stability increases (Mulholland et al. 2016; Lee et al. 2018; Hinson & Wilson 2021). Specifically, in response to the intensification of the zonal mean flow, low level transient wave activity decreases and shifts poleward away from the most active dust lifting regions. We conclude that their effect on simulated dust activity is negligible.
3.4.1. The Zonal Mean Circulation
In comparison to inert dust simulations with the same solar heating rate, the zonal mean circulation, characterized by the winter hemisphere westerly jet and Hadley circulation, is greatly strengthened by dust radiative heating. The meridional extent of the solstitial Hadley circulation is sensitive to the latitude of maximum heating. As on present-day Mars, the rising branch of the Hadley cell in inert dust simulations generally follows the seasonal migration of the subsolar latitude. The highest heating rates occur near the surface. As atmospheric dust accumulates, dust radiative heating can exceed warming due to solar heating of the atmosphere and surface, displacing the latitude and altitude of maximum heating poleward and upwards.
In radiatively active dust simulations at Earth orbit, radiative heating by atmospheric dust in the high summer polar latitudes and cooling in the winter hemisphere (Figure 6, bottom row) drives the vertical and meridional expansion of the seasonal Hadley cell. In the middle atmosphere, circulation extends from nearly pole-to-pole, consistent with behavior for a nearly inviscid, angular-momentum-conserving fluid (Held & Hou 1980; Schneider 1983; Lindzen & Hou 1988) forced by dust radiative heating (Haberle et al. 1982; Schneider 1983; Wilson 1997). Zonal winds in the tropics approach the theoretical limit of −240 m s−1 for angular-momentum-conserving air parcels moving from the pole to the equator. The aphelion and perihelion winter westerly jet is vertically bounded and shifted slightly poleward. Wind speeds reach 157.55 and 173.75 m s−1, respectively (Figure 6, row 1).

Figure 6. Comparison of the solstitial zonal mean circulation vs. pressure in inert and active dust simulations. Top row: Temperature (K) (filled contours) and zonal wind (m s−1) (contour lines); middle row: meridional wind (m s−1) (filled contours) and mass stream function (kg m−2 s−1 × 10⁸) (contour lines); bottom row: dust mass mixing ratio (kg kg−1 × 10⁶) (filled contours) and the net heating rate (K sol−1) (contour lines).
Download figure:
Standard image High-resolution imageThe zonal mean circulation is responsible for the transport and mixing of atmospheric dust (Figure 6, bottom row). At both solstices, dust is nearly uniformly mixed from 100 Pa to approximately 10–1 Pa. Dust in the lower atmosphere is concentrated in broad plumes associated with the upwelling branch of the Hadley cell. As we will demonstrate in the following sections, heating by dust amplifies the thermal tide and, in particular, the diurnal and semidiurnal harmonics of the tide.
The strengthened solstitial circulation is also responsible for the simulated seasonality in the planetary bond albedo (Figure 5(a)). As on present-day Mars, atmospheric dust raises the average planetary bond albedo since dust scatters light efficiently at visible wavelengths. However, during solstitial dusty seasons larger particles are lofted into the reflective region of the atmosphere (at pressures <10 Pa) and the average particle effective radius increases from approximately 0.9 to >1.3–1.6 μm. Due to the anticorrelation between dust particle size and single scattering albedo (Wolff et al. 2009, Haberle et al. 2019), the total upwards visible light flux is reduced and the bond albedo decreases. Seasonal or cyclic changes to simple observables such as the planetary albedo could provide useful constraints on the planetary climate, for example, indicating that the planet has an atmosphere and active meteorology.
3.4.2. The Thermal Tide
Thermal tides are the atmospheric response to the diurnal cycle in solar heating. To first order, the amplitude of the thermal tide response is dependent on the strength and spatial distribution of the thermal forcing and is therefore modified by the thermal properties of the surface, the mass and composition of the atmosphere, and the optical properties of atmospheric aerosols (Chapman & Lindzen 1970). On land planets with limited surface reservoirs of water and low surface heat capacity, there is significant diurnal variability and strong forcing by the diurnal tide (Zurek 1976; Wilson & Hamilton 1996; Forbes & Miyahara 2006; Barnes et al. 2017). On present-day Mars, the semidiurnal tide response is roughly proportional to the global dust heating rate and is therefore strengthened as the global atmospheric dust load increases (Zurek 1981; Wilson & Richardson 2000; Forbes & Miyahara 2006; Guzewich et al. 2014). Water ice clouds similarly amplify the semidiurnal tide (Kleinböhl et al. 2013, Wilson & Guzewich 2014, Haberle et al. 2019; Hartwick et al. 2019).
The tidal response is significantly modified in simulations with active dust compared to simulations with inert dust at the same orbit. In Figure 7 we show the amplitude of the diurnal and semidiurnal components of the temperature and zonal wind versus pressure. The diurnal tide is the strongest component of the thermal tide in both active and inert dust simulations, with maximum values of approximately 20 K and 50 m s−1 and as great as 90 K and 560 m s−1 at SH summer solstice, respectively. However, at the same time, the altitude of peak tidal heating shifts from the top and bottom of the atmosphere in inert dust cases (since the amplitude of the tide is inversely proportional to the atmospheric density and NIR solar radiation has relatively stronger forcing in the upper atmosphere) to the atmospheric level at which the cumulative opacity reaches unity, which is determined by the vertical distribution and in situ thermal forcing of dust. Absorption of solar radiation by dust is positive by day and zero at night; hence the presence of multiple harmonics, including diurnal, semidiurnal, and higher harmonics. Despite maximum solar heating in the summer hemisphere, the amplitudes of the semidiurnal tides in the active dust simulation peak over the winter poles and midlatitudes in the middle atmosphere. The surface influence of the semidiurnal tide is greatest in the midlatitudes (see Section 3.5)
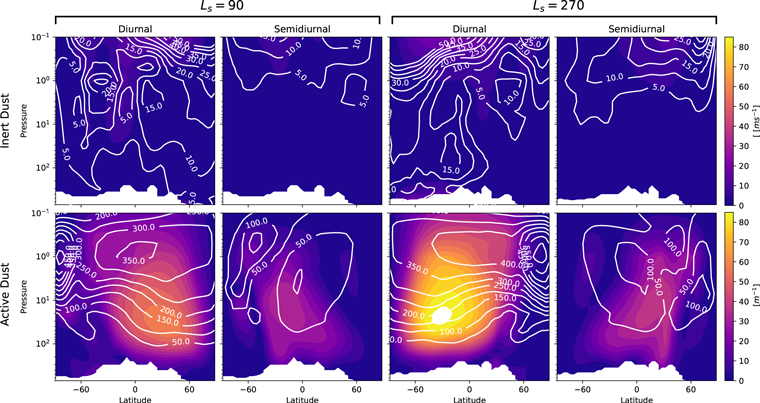
Figure 7. Amplitude of the migrating diurnal and semidiurnal tide modes of the temperature (filled contours) and zonal wind (contour lines) for (top row) inert dust simulations and (bottom row) active dust simulations at both solstices.
Download figure:
Standard image High-resolution imageThe thermal tide also indirectly influences the intensity and structure of the zonal mean circulation. This is most readily illustrated by comparing simulations with and without tides. The latter can be achieved by running the model with diurnally averaged solar insolation. The results are shown in Figures 8 and 9. In the simulation that lacks tides the solstitial atmospheric dust load is reduced, the Hadley cell is weaker, and its meridional and vertical extent is smaller. This indicates that tides strengthen and expand the Hadley circulation. We believe this is accomplished by two separate processes. First, convergence of the tide heat and momentum fluxes broaden the meridional extent of the Hadley circulation (see, for e.g., Zurek & Haberle 1988; Wilson 1997). Second, and perhaps more importantly, tides advect dust directly over the summer pole leading to increased heating in this region (Wilson 1997; Wu et al. 2020). By contrast, the summer polar atmosphere is largely dust free in simulations with no tides. The resulting transport of dust to higher latitudes in the summer hemisphere further strengthens the intensity of the circulation (see Figure 6, bottom row). Thus, a feedback process is initiated between dust lifting and tidal amplitudes that strengthens and broadens the Hadley cell, culminating in a very deep pole-to-pole meridional circulation. Wilson (1997) discusses these mechanisms for solstitial global dust storms on present-day Mars.

Figure 8. Southern hemisphere summer solstice (Ls = 270°) dust mass mixing ratios × 106 (kg kg−1) (filled contours) and the mass stream function (kg m−2 s−1) × 108 for (a) simulations with no tidal heating compared with (b) simulations with tidal heating.
Download figure:
Standard image High-resolution image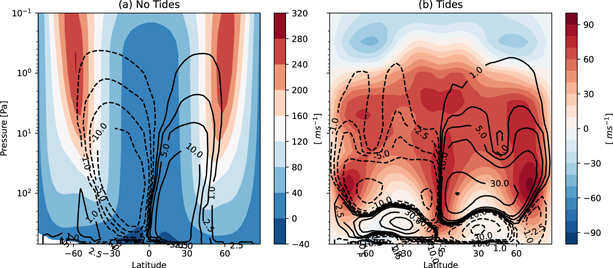
Figure 9. Equinoctial (Ls = 180°) mean meridional circulation (kg m−2 s−1) × 108 and zonal wind (m s−1) fields for simulations at Earth orbit with (a) diurnal average heating compared to (b) our base simulation with radiatively active dust. The mean meridional circulation (MMC) is shown in black contours, the seasonal mean zonal winds are shown by filled contours.
Download figure:
Standard image High-resolution imageTidal heating also drives equinoctial equatorial superrotation. Tropical westerlies exceed 70 m s−1 in a broad maximum between ∼250 and 10 Pa and extend from the near surface to ∼0.3 Pa. Formation of the equatorial prograde jet results from angular-momentum transfer by the Sun-synchronous diurnal tide (Fels & Lindzen 1974; Lewis & Read 2003) and is absent in simulations with diurnal average heating (Figure 9). Tides are also responsible for vertical closure of midlatitude westerlies and modify the MMC from a dipole to quadrupole structure. These phenomena have been simulated in general circulation models for present-day Mars when equinoctial dust storms temporarily increase atmospheric dust levels and tidal heating (Wilson & Hamilton 1996; Lewis & Read 2003; Inamura et al. 2020). The Earth orbit simulation represents an amplification of this same process with much higher dust forcing and therefore a stronger response. We note that some differences between the diurnal and diurnal average heating simulations result from changes to the atmospheric dust level as seen in Figure 8; however, this difference would not impact the major dynamical structures (e.g., the direction of the tropical jet) in diurnal heating simulations that are forced by the tide.
3.5. Dust Radiative Effects on the Surface Wind Speed and Wind-driven Dust Lifting
A surprising result of adding radiatively active dust to simulations of land planets at Earth orbit is the spatial reorganization of the most active dust-lifting regions. At both solstices the maximum zonal mean surface stress for the radiatively active dust case shifts into the winter hemisphere at ∼30° (Figure 10).
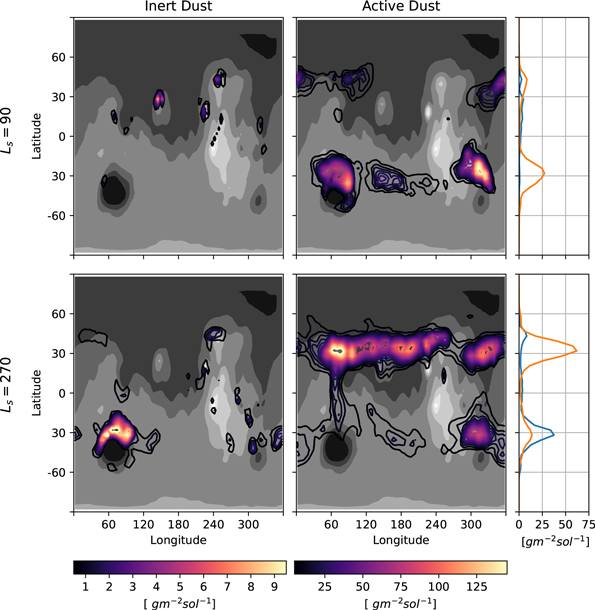
Figure 10. Solstitial wind-driven dust lifting rates (g m−2 sol−1) (contour lines) for active and inert dust simulations. Filled contours show topography. Line plots show the zonal average dust lifting rates for active dust (orange line) and inert dust (blue line) simulations. Inert dust values are multiplied by 25 for visibility.
Download figure:
Standard image High-resolution imageTo illustrate the contribution of individual components of the circulation to this shift we show in Figure 11 the surface wind stress, the zonal mean component of the surface stress, and the diurnal minimum and maximum values. We approximate the zonal mean component of the wind stress using Equation (4) with a constant drag coefficient (CD ), the zonal and time-averaged atmospheric density (ρair), and the zonal and time-averaged wind speed in the lowest atmospheric level (U). The wind speed (U) is calculated using the zonal mean u and v components of the wind speed squared:

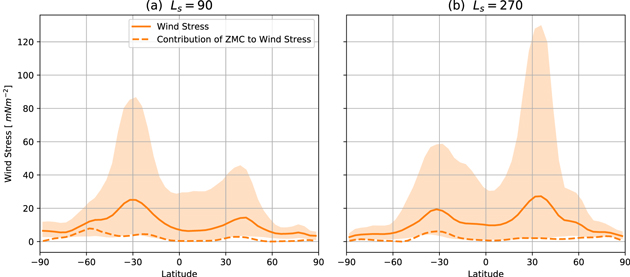
Figure 11. Solstitial zonal mean surface wind stress (mN m−2) and estimated contribution of the zonal mean circulation to the surface wind stress. The envelope shows the zonal mean diurnal minimum and maximum values. Left column is for Ls = 90°, right column is for Ls = 270°.
Download figure:
Standard image High-resolution imageAt both solstices, stronger winds speeds associated with the zonal mean circulation contribute to only a small increase in predicted wind stress in the winter hemisphere. By contrast, there is significant diurnal variability, which suggests that the tide is the controlling dynamic component responsible for the magnitude of surface wind stress. In the winter hemisphere surface wind stress maxima can exceed 100 mN m−2, well above the threshold wind stress of 22.5 mN m−2 required for the initiation of wind-driven dust lifting.
We also show in Figure 12 the amplitude of the diurnal and semidiurnal harmonics of the surface zonal wind component of the thermal tide for the active and inert dust simulations for the solstitial seasons. Since a large fraction of the incoming solar radiation reaches the planetary surface in inert dust simulations with low atmospheric dust levels, the diurnal tide has the most significant surface influence. By contrast, in active dust simulations the semidiurnal tide clearly dominates the near-surface response. Maximum amplitudes at both solstices exceed 20 m s−1 at ∼30° in the winter hemisphere, which are the same latitudes as the largest zonal average wind stresses and lifting rates (see Figures 10 and 11). The longitudinal structure results from constructive and destructive interference between the migrating and nonmigrating tides. The latter are excited by longitudinal variations in dust and surface properties (e.g., topography, albedo, thermal inertia; Wilson & Hamilton 1996).
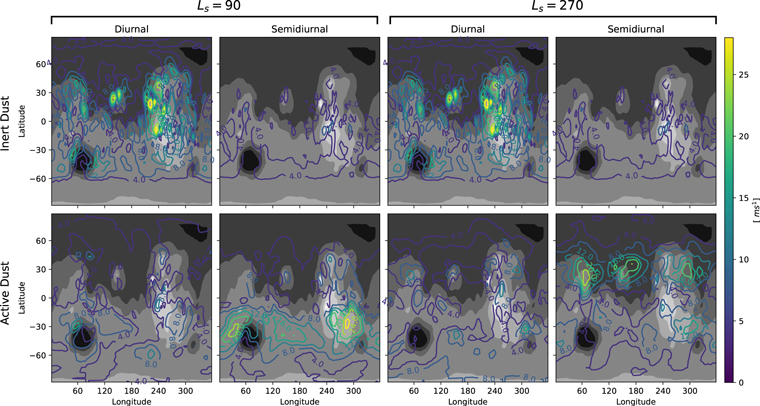
Figure 12. Surface amplitudes of the diurnal and semidiurnal components of the zonal wind for (top row) inert dust simulations and (bottom row) active dust simulations at both solstices.
Download figure:
Standard image High-resolution imageThe dominance of the semidiurnal and higher harmonic tidal components over the diurnal tide in active dust simulations is a result of deeply mixed dust that shifts the peak thermal forcing to higher in the atmosphere (see Figure 6). Thus the semidiurnal tide, which has very long vertical wavelengths, efficiently responds while the diurnal tide, which has shorter vertical wavelengths, and has a more muted response at the surface.
Even small increases in the surface wind stress can contribute to significant increases in the atmospheric dust mass since the mass lifting rate is proportional to the wind stress cubed (see Equation (1)). As the tidal amplitude grows, more dust is lifted. Lifted dust is transported meridionally and vertically by the zonal mean circulation where, in the upper atmosphere, it further augments the tide. This feedback between the level of atmospheric dust, the planetary mean circulation and tides, and the distribution of surface dust activity demonstrates the unique complexity of dust-dominated, land planet climates. Dust activity is controlled by surface winds that are directly modified by the distribution and properties of dust itself. If dust availability is nearly unlimited, this feedback strengthens as the planetary orbit decreases and the solar heating and corresponding dust heating rates increase.
3.6. Land Planet Climate as a Function of Orbit
Future study of land planet climate will necessarily require extrapolation based on limited observational evidence. Where possible, identifying simple diagnostic relationships between concrete, more easily observed planetary features (e.g., the orbital radius, planetary size, and stellar type) and more complex climatological patterns will be the gold standard. In the following section, our goal is to probe the relationship between solar insolation rates or planetary orbital radius and simple land planet climate types. Based on our analysis of Mars-like exoplanets at Mars and Earth orbits we identify three dust-lifting regimes. Dust-lifting regimes are characterized by the dominant mechanisms for injection of surface dust into the atmosphere (e.g., either dust devil or wind stress lifting) and the spatial distribution of the most active dust-lifting regions (for example, in the summer or winter hemisphere). Because dust activity is directly related to the surface energy budget and magnitude and distribution of surface wind speeds that are modified by large-scale circulation patterns, dust activity is a particularly useful metric for overall climate. For example, as we have shown in the analysis of a Mars-like exoplanet at Earth orbit with radiatively active dust, the shift in lifting from the summer to winter hemisphere is driven primarily by the surface influence of the semidiurnal and higher harmonic thermal tides. These modifications to the global dynamics result from dust mixing by the zonal mean circulation and dust radiative heating in the middle atmosphere. This pattern of lifting is uniquely accessible in land planet climates with significant atmospheric dust and positive dust radiational heating. We summarize the three dust-lifting regimes or land planet climate types below.
Regime I. The dominant mechanism for dust lifting in regime I climates is dust devil lifting. Dust devil frequency increases when the atmospheric static stability drops. As a result, most lifting will occur in the summer hemisphere following the subsolar latitude. In general, atmospheric dust levels remain low. Low surface wind speeds limit or entirely suppress wind stress lifting.
Regime II. In regime II, surface wind speeds more regularly exceed the surface wind stress threshold required to initiate saltation. Lifting is concentrated in regions where surface winds can be accelerated above the background mean by the thermal tide, transient and stationary eddies or their interactions. Most lifting is concentrated in the summer hemisphere, however flushing storms that travel from the winter to summer hemisphere may trigger dust activity that grows storm systems from local to regional or even global scales. The radiative impact of dust is small but nonnegligible.
Regime III. Unlike regimes I and II, which represent two physically distinct lifting mechanisms, both regimes II and III loft dust predominantly via wind stress lifting. However, lifting shifts from the summer hemisphere to the winter hemisphere due to the surface influence of the semidiurnal tide. Whereas planetary-scale dust activity must be initiated in regimes I and II, regime III season dust activity is embedded in a perpetual or seasonal global dust storm. A hallmark of regime III is therefore the reduced role of transient waves, which are important for storm expansion and growth, and the concurrent amplification of the semidiurnal and higher harmonic tides, which enhance winter hemisphere midlatitudes surface wind speeds and, via dust advection to the summer polar hemisphere, strengthen the seasonal Hadley circulation. Dust radiative feedbacks are critical and drive the shift between regimes II and III.
Due to Mars' eccentric orbit and the large variation in solar heating rates with season (for example, at present-day Mars orbit, So = 589 W m−2, the maximum heating rate exceeds 717 W m−2 at NH winter solstice while the minimum falls to 493 W m−2 at NH summer solstice), Mars-like planets can potentially experience multiple regimes at the same orbital radius. Dust activity in simulations at Mars orbit follows regime I at NH summer solstice but shifts to regime II at NH winter solstice. By contrast, Earth orbit simulations show regime III dust activity throughout the entire year, suggesting that the So limit for regime III is less than the NH summer solstice forcing (1148 W m−2).
Figure 13 shows the solstitial zonal average dust activity for four new intermediary orbits. At summer hemisphere summer solstice (Ls = 270°), we observe an almost immediate shift from regime II (wind stress, summer hemisphere) to regime III (wind stress, winter hemisphere) between Mars orbit and intermediate orbit 1 (NH winter solstice heating 717 and 973 W m−2, respectively). As the orbit decreases and seasonal heating rates continue to rise, lifting in the winter hemisphere (NH midlatitudes) becomes progressively more dominant. Positive feedbacks between atmospheric dust heating and additional dust lifting leads to a simultaneous increase in the atmospheric dust optical depth from below 1 at Mars orbit to greater than 40–50 at Earth orbit. At NH summer solstice (Ls = 90°), we first identify a transition from regime I lifting (dust devil, summer hemisphere) to regime II (wind stress, summer hemisphere) between Mars orbit and intermediate orbit 1 (aphelion heating 493 and 669 W m−2, respectively). By intermediate orbit 3 (aphelion heating 1004 W m−2) regime III dust activity is initiated all year round. We identify transition states between regimes I and II (similar levels of wind stress and dust devil lifting) at Ls = 90° intermediate orbit 1 (669 W m−2) and between regimes II and III (simultaneous lifting in both the summer and winter hemispheres) at Ls = 270°, intermediate orbit 1 (973 W m−2) and Ls = 90°, intermediate orbit 2 (836 W m−2).

Figure 13. Solstitial zonal average dust devil (dotted) and wind stress (dashed) dust-lifting rates (g m−2 sol−1) and the visible dust optical depth (solid orange) for more distant than present-day Mars (far orbit) to Earth orbit. Regimes are listed in the lower-right corner of each panel. Note the different x-axis scale.
Download figure:
Standard image High-resolution imageOur findings are summarized in Table 2. We identify the dust-lifting regime at both solstices and the associated seasonal solar heating rate in the summer hemisphere. Based on this analysis we identify the following So limits for each regime:
- Regime I: So < 669 W m−2.
- Regime II : 669 W m−2 < So < 1004 W m−2.
- Regime III : So > 1004 W m−2.
Table 2. Climate Regime and Approximate Solar Forcing vs. Orbit
| Simulation | So (W m−2) | Aphelion Forcing (W m−2) | Aphelion Regime | Perihelion Forcing (W m−2) | Perihelion Regime |
|---|---|---|---|---|---|
| Far orbit | 450 | ∼376 | Regime I | ∼547 | Regime I |
| Mars orbit | 589 | ∼493 | Regime I | ∼717 | Regime II |
| Intermediate 1 | 800 | ∼669 | Regime I/II | ∼973 | Regime II/III |
| Intermediate 2 | 1000 | ∼836 | Regime II/III | ∼1217 | Regime III |
| Intermediate 3 | 1200 | ∼1004 | Regime III | ∼1460 | Regime III |
| Earth orbit | 1372 | ∼1148 | Regime III | ∼1669 | Regime III |
Download table as: ASCIITypeset image
While these limits provide a useful first constraint for the expected land planet climate as a function of solar heating rate, we caution the reader that the exact solar flux boundaries for each regime is highly dependent on several factors, including the planetary topography, the mineralogy and radiative properties of lifted dust, the solar spectrum and stellar type, the planetary atmospheric density and composition, and the planetary size, obliquity and eccentricity. For example, simulations with no topography and uniform surface thermal properties generally have much lower wind stress dust injection rates overall since surface winds speeds are not accelerated across topographic and thermal gradients. The nonlinear dependence of dust injection on wind stress (Equation (1)) means that localized enhancement of stress due to topographic slope effects greatly amplify dust injection (see Figure 14). The shift to regime II requires higher solar heating rates at both Ls = 90° and Ls = 270° (occurring at intermediate orbit 2 and intermediate orbit 1, respectively). The shift to regime III at Ls = 270° is similarly delayed from approximately 973 W m−2 with topography to So = 1217 W m−2 without topography. At Ls = 90°, summer hemisphere wind stress lifting is maintained at smaller orbits (e.g intermediate orbit 3). As we noted previously, topography also controls the nonmigrating component of the diurnal and higher harmonic thermal tides. As a result, simulations with topography show more meridional asymmetry in the distribution of active lifting regions in the winter midlatitudes compared with billiard ball simulations. Further, dust composition and grain size can dramatically alter the radiative forcing, e.g., from warming to cooling. This factor should be carefully considered.
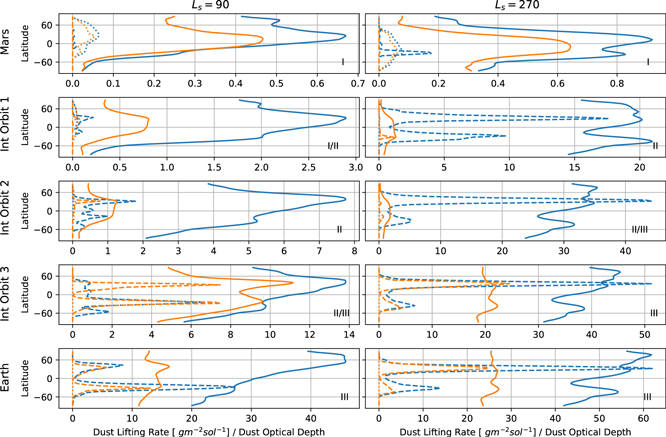
Figure 14. (as in Figure 13) Solstitial zonal average dust devil (dotted) and wind stress (dashed) lifting rates (g m−2 sol−1) for simulations with (blue) and without (orange) topography vs. orbital radius. Solid lines show the zonal average visible dust optical depth. Regimes for the no topography simulations are listed in the lower-right corner of each panel. Note that the range of the x-axis changes in each panel.
Download figure:
Standard image High-resolution imageRather than relying on rigid So benchmarks, we therefore instead encourage thinking in broad climate trends that vary with orbit. In general, land planets will be dustier at closer orbits. Lifting will transition from dust devil to wind stress dominated, and the most active dust-lifting regions will shift from the summer to winter hemisphere. If the land planet in question is orbiting close to its central star and has a flat or nonvarying spectrum with season, we are therefore more likely to predict a dusty regime III-like climate compared with a very distantly orbiting planet also with a nonvarying spectrum (in this case, we are likely observing the surface rather than a high-altitude dust layer, a regime I climate). Future papers will continue to probe the complexities of these regimes, including in relation to the planetary size, atmospheric density and composition, stellar type, and coupling with the hydrological cycle.
3.7. Simulated Spectra
A critical component of exoplanet climatological studies is understanding the potential spectral signatures of different planetary and climate types. Observational data will be extremely limited, and spectra may not provide conclusive evidence of a particular planetary climate. In fact, it is possible that vastly different climates could produce very similar spectral shapes, particularly in the case of flat or nearly featureless spectra. Our primary goal must therefore be to both evaluate planetary climate and potential habitability but also gain a thorough understanding of how these planets and climate types may be easily distinguished between near neighbors and spectral doppelgangers. As a first step, we utilize the PICASO software package (Batalha et al. 2019) to generate theoretical exoplanet reflectance spectra for both the Mars and Earth orbit land planet simulations (Figure 15). We replicate the LUVOIR-A wavelength range since this is the most likely candidate to directly observe terrestrial planets at more distant orbits. PICASO requires inputs for the wavelength-dependent surface albedo, the vertical temperature, pressure, and atmospheric constituents (here, CO2, and water vapor) as well as the vertical distribution and wavelength-dependent layer optical depths for any atmospheric aerosols. We prescribe a constant surface albedo based on the CRISM wavelength-dependent surface albedo generated by Madden & Kaltenegger (2018). We note that at closer orbits simulated here, the surface albedo may be altered. In particular, the distribution and total amount of surface dust may vary as a result of elevated lifting simulated at Earth orbit and, as surface temperature increase, surface water ice may sublimate while surface liquid water could accumulate or modify the moisture of regolith. We do not consider this source of potential variability at this time. However, since the spectral impact of the surface is reduced at greater dust optical depths, we believe the conclusions presented here are robust.

Figure 15. Simulated planetary reflectance spectrum for a land planet with radiatively active dust at Mars orbit (orange) and Earth orbit (blue). Dashed lines show the spectrum without radiatively active dust. The dotted green line shows the surface albedo based on CRISM (Madden & Kaltenegger 2018). Values are normalized to 1 and 1 μm. Major absorption features are labeled. The spectral range was chosen to match LUVOIR-A.
Download figure:
Standard image High-resolution imageFor simplicity, and given the long observational time required to image Mars-like land planets, we utilize the global annual average from simulations. To calculate the wavelength-dependent optical depth due to atmospheric dust, we calculate extinction and scattering coefficients for a constant log-normal distribution of particles with Reff = 1.5 μm, veff = 0.5. Layer optical depth is calculated using Equations (5)–(7):


Here, Rg is the distribution radius necessary to find the total geometric cross section of the particle distribution. Reff and veff are the effective radius and variance of a constant, level-independent log-normal distribution of dust particles, here 1.5 μm and 0.5, respectively. Qext is the distribution weighted extinction coefficient versus wavelength. No is the dust number density in #kg−1. dP g−1 represents the atmospheric layer mass per unit area. Simplifying assumptions regarding the size distribution of particles introduce some inaccuracies into the final optical depth calculation. However, given the expected observational integration time, we expect variations with location and time to introduce minimal errors.
At Mars orbit, the structure and major features of the simulated reflectance spectrum mirror the surface albedo map (Figure 15). This is expected due to the thin Martian atmosphere and the limited atmospheric dust. Dashed lines show the simulated spectrum without aerosols. At Mars orbit, the impact of aerosols is minimal. Major absorption features correspond to surface dust and ice deposits and atmospheric CO2. In the extreme-UV at wavelengths shorter than approximately 0.75 μm, there is a deep absorption band due to charge transfer absorption of Fe3+. Another significant absorption feature appears at approximately 2 μm due to CO2. We also identify absorption features due to surface water ice (between 1.4 and 1.7 μm), olivine and pyroxene (Fe2+, 1 μm), and hydrated minerals at 2.2 μm (Hu et al. 2012). The simulated Mars orbit spectrum matches reasonably well with Earth-based and in situ observational spectra of present-day Mars (Hu et al. 2012). At Earth orbit, high levels of atmospheric dust mute surface spectral features and shift the overall shape of the simulated spectra to look more similar to the spectrum of Martian dust. As at Mars orbit, significant absorption is apparent due to Fe3+ and Fe2+. However, the CO2 absorption band as well as absorption bands due to surface water ice are damped. Significantly, terrestrial land planets with significant levels of atmospheric dust can potentially have relatively flat spectra that could make the unique identification of high-altitude cloud decks versus dust decks more difficult. Similarly, short-wavelength absorption may not be easily discriminable from scattering due to photochemical hazes. We acknowledge that the Earth orbit spectrum is highly dependent on the chosen dust optical properties as well as the dust emission parameterization. For example, our current simulations do not prescribe finite surface dust reservoirs (see Section 4.3.2). If surface dust is depleted on seasonal or shorter timescales, spectral cycling between a dusty flat spectrum and a spectrum with clear surface features could help differentiate between high dust layers and a cold featureless planet. Even in our simple simulations, there is some variation with season that, if resolvable, would hint at an optically thick aerosol layer as opposed to a dust-free planet with a spectrally flat surface. Future work to identify identifying spectral features and dust-driven seasonal variability for these planets will be important.
Doppler shifts of absorption bands in high-resolution transmission spectra have aided in the identification of superrotation on hot Jupiters and brown dwarves where winds can exceed 1 km s −1 (Snellen et al. 2010). Future observations with greater signal-to-noise ratios could potentially look for equinoctial superrotation as a signature of regime III, dusty land planet climates.
4. Discussion
4.1. Similarities to Present-day Venus
As dust accumulates in the land planet atmosphere, the prevailing climate shifts from one that is similar to present-day Mars to one that more closely resembles present-day Venus. This surprising transformation results from the absorption of solar and IR light by atmospheric dust. As on Venus, the peak heating shifts off the surface into the middle atmosphere (Figure 6). Greenhouse warming raises the surface temperature above the theoretical blackbody temperature (Figure 5). A superrotating zonal flow dominates the tropics, extending from approximately 30N to 30S compared to ∼50N to 50S. Wind speeds peak at ∼70 m s−1 compared to 100 m s−1 for our simulated Mars-like land planet and Venus, respectively (Sánchez-Lavega et al. 2017). Winds peak at a similar altitude. While the Venusian forcing is less clear-cut, with contributions from the thermal tide as well as the mean meridional circulation (Yamamoto et al. 2019; Horinouchi et al. 2020; Inamura et al. 2020), the mechanism generating these features on simulated Mars-like land planets is unambiguously the amplification of the thermal tides by atmospheric dust.
4.2. Implications and Limits on Land Planet Habitability
Dusty atmospheres complicate our ability to easily assess land planet habitability. Shading by atmospheric dust may be the key to reducing surface temperatures and generating habitable environments, as is the case for tidally locked land planets orbiting M stars in Boutle et al. (2020). By contrast, as in this work, high levels of atmospheric dust act as a greenhouse warming agent, raising temperatures above the freezing point of water. Dust may also play a critical role for the long-range transport of nutrients (Ridgwell 2002) or, in the case of ferrous dust, in shading the surface from damaging levels of UV irradiation (Pierson et al. 1992). On the other hand, high levels of atmospheric dust limit the surface flux of visible light and therefore limits the most abundant energy source for life (Section 4.3.1). Further, for small planets such as Mars, dust mixed to the high atmosphere may act as a conveyor belt for atmospheric water loss, drawing into question the long-term planetary habitability (Section 4.3.2). Additional complications arise since these effects will be modified by the unique optical properties, minerology, and size distribution of dust on planets with different evolutionary histories.
4.2.1. Limitations Due to Reduced Surface Solar Flux
Classic prescriptions for habitability only require sufficiently high surface temperatures to sustain liquid water over long periods. At Earth orbit, simulated land planet surface temperatures in the extratropics and along the equator remain above freezing for the entire year. Given a large enough planetary budget of water to support life, a Mars-like land planet with radiatively active dust at higher instellations could be conceivably habitable over some fraction of the planetary surface. However, positive feedbacks between atmospheric dust levels and further dust lifting complicate this simple picture of planetary habitability.
As atmospheric dust accumulates the fraction of sunlight reaching the planetary surface, and therefore the surface energy budget for potential photosynthetic life-forms, is decreased. Previous studies have identified very low minimum light limits for photosynthetic light (Littler et al. 1986; Raven et al. 2000; McKay 2014). On average, even our dustiest simulations would therefore permit limited growth (see Figure 16). However, the surface flux of sunlight near NH winter solstice (Figure 16(e)) falls below minimum photon flux rates (0.01 μmol m−2 s−1) for photosynthetic life over a large fraction of the NH. Photosynthetic life-forms would therefore be restricted to the SH or require a seasonal hibernation cycle that coincides with biannual dust storms. Further, in our Earth orbit simulations with radiatively active dust, the greatest surface solar fluxes exist at the highest altitudes where atmospheric pressures are lowest and surface liquid water is most unstable. In land planet studies we must therefore additionally consider dust-driven limitations on photosynthetic habitability. These limits are strongly based on the radiative properties of dust and could be different for planets orbiting different stellar types.
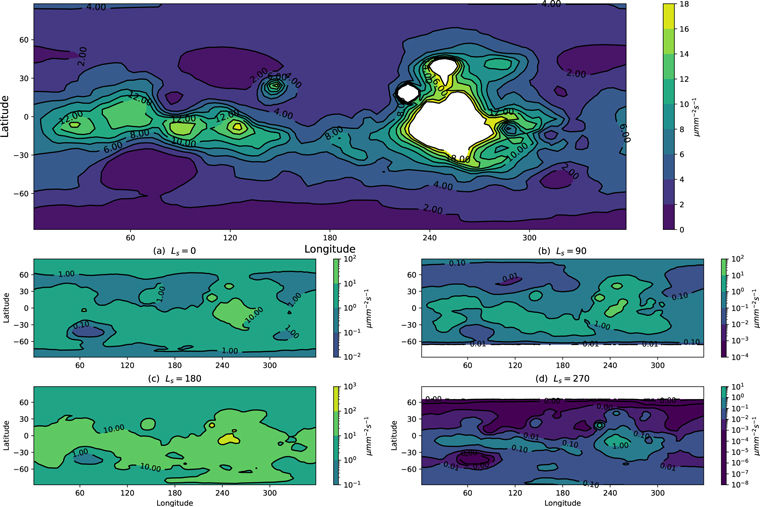
Figure 16. Top: Annual and (a–d) seasonal average surface photon flux (μmol m−2 s−1). Note the change in contour scales. The white regions in the top panel have photon fluxes greater than 18 μmol m−2 s−1.
Download figure:
Standard image High-resolution image4.2.2. Planetary Water Budget
Dust may also critically impact the lifetime of planetary water, particularly in the inner habitable zones where dust is efficiently mixed to low pressures. Recent work based on MAVEN and NOMAD observations suggest that hydrogen loss rates increase during global storms when dust is lofted to high altitudes and transports water with it (Chaffin et al. 2013; Heavens et al. 2018; Aoki et al. 2019; Neary et al. 2019; Stone et al. 2020). Our simulations show significant dust mixing to high altitudes. Mixing increases as the land planet is moved inwards. Given stronger solar winds at closer planetary orbit, long-term retention of the original planetary water budget on a planet with a vigorous dust cycle may be difficult. Hydrogen loss rates are also strongly influenced by planetary size and atmospheric pressure. Given these complications, the long-term stability and retention of water on land planets with a vigorous dust cycle should be carefully considered.
4.3. Remaining Uncertainties
4.3.1. Dust Radiative Properties, Coagulation, and Loss of Thermal Contact
We have demonstrated that the radiative impact of dust on land planet climate is significant. However, the magnitude of dust forcing is extremely sensitive to dust radiative properties, dust particle size and vertical distribution, and atmospheric properties that modify the type or degree of coupling between dust heating and atmospheric response. For example, the oxidation and surface hydrological history of land planets will impact dust mineralogical composition and therefore radiative properties. Surface with little alteration would generate basaltic dust. Highly oxidizing atmospheres (like present-day Mars) generate more ferric dust particles. Similarly, land planets that have evolved from previously more water-rich climates may have dust that is aqueously altered. All types will have different radiative properties that influence its thermal atmospheric impact. For example, a shift in the primary composition of dust particles in simulations of Earth shifts the net radiative forcing from negative (cooling) to positive (warming) (Sokolik & Toon 1999). The size and atmospheric vertical distribution of dust particles is similarly important. Highly degraded soils (as for surfaces eroded by strong winds or with differential aqueous histories) may contain very fine particulate matter that is highly scattering and stays lofted for significant amounts of time. By comparison, larger particles will sediment more rapidly and clear the atmosphere. Larger particles generally permit greater transmission of both visible and IR light, so the greenhouse and surface shading would be less significant. The surface response to the thermal tide will also vary in response to the dust vertical distribution. For example, at some point as dust is mixed to extremely high levels in the atmosphere, even the long vertical wavelength of the semidiurnal tide will not penetrate to the surface. In this case, tidal-driven midlatitude dust activity will decrease in response to more muted wind stresses. Depending on the atmospheric lifetime of dust and its evolving vertical distribution, surface dust activity could then feasibly cycle between quiescent periods and regime II and regime III activity on short or long timescales. Future work focusing on resulting observable modifications to the planetary albedo and the potentially unique timescales of this cyclicality is encouraged.
Our simulations do not include dust coagulation. However, given the very large number densities of dust at the solstices, coagulation may be important. As dust levels increase, collisions should also increase. Larger particles will gravitationally sediment at a higher rate than small particles. Coagulation could rapidly clear the atmosphere or lead to high dust layers of small particles that escape rapid coagulation and sedimentation in the lower atmosphere. For example, we find that for atmospheric conditions similar to the Earth orbit case (272–276 K, dust concentrations between 5 × 10⁸ and 9.8 × 10⁸ m−3, atmospheric density ∼1.7e–2 kg m−3), 1 μm dust particles will double their volume in approximately 2–5 sol, approximately two orders of magnitude faster than the fastest coagulation timescales on present-day Mars (Bertrand et al. 2020). This coagulation timescale could lead to significant atmospheric clearing. This process could therefore have important ramifications, for example, in the summer polar atmosphere where dust radiative heating has been shown to strengthen the seasonal Hadley circulation and magnify dust feedbacks (Section 3.4.1). At both equinoxes, coagulation and the subsequent removal of atmospheric dust could occur on shorter timescales than dust lifting and the transition to dustier solstices, and potentially increase seasonal shifts to the albedo or reflected light spectrum (see Figure 5(a)).
Similarly, in the rarified high atmosphere dust may lose thermal contact and therefore damp radiative forcing. In other words, as atmospheric pressures fall, the collisional transfer of solar energy from dust particles to the atmosphere is greatly reduced and the dust particles will warm with respect to the gas. At Mars orbit, dust particles above ∼40 km start to lose thermal contact with the atmosphere (Goldenson et al. 2008) and dust particle and gas temperatures diverge. In our Earth orbit simulations, the greatest dust heating rates often occur at pressures less than 10 Pa (see Figure 6). If loss of thermal contact occurs at or near this pressure, then we would expect a limit to the radiative influence of dust mixed to high altitudes and as dust optical depths increase.
4.3.2. Dust Availability
The major negative control on regime III is the planetary availability of dust; or, stated differently, given a specific solar insolation, is there sufficient dust to modify the Hadley cell and transition lifting to regime III? The simulations described in this paper prescribe an infinite source of dust distributed evenly across the surface. As the spatial distribution of surface winds change, regions of dust activity shift across the planet. Based on local topography and surface thermal properties, winds may be magnified and lead to more dust lifting, or decreased, lowering the total mass of dust lifted.
A more realistic distribution of finite depth dust reservoirs will respond to changed surface winds in complex nonlinear ways. Notably, if the highest surface wind speeds are not spatially correlated with the largest dust deposits or if surface dust reservoirs can be rapidly depleted over short timescales, then modifications to climate due to dust radiative feedbacks may be transient or short-lived. Depletion of surface dust reservoirs is a known process for present-day Mars, which has perennially active dust-lifting centers but also regions that are periodically activated or appear to be cleared of dust on short timescales (Kahre et al. 2005; Newman & Richardson 2015). Reservoir exhaustion likely contributes to the timing and growth of large-scale and global dust storms. By the same manner, the spatial distribution of surface dust reservoirs with unique clearing and replenishment timescales could generate significant variability in the timing and total mass of dust-lifting events and therefore the specific dust-lifting regime and overall land planet climate.
On average, for simulations at Earth orbit with radiatively active dust, lifting rates in the midlatitudes equate to cumulative erosion rates between 1 and 10 mm per year (Figure 17(b)). Dust is nearly exclusively lofted from midlatitude reservoirs (Figure 17(a), filled contours) and redistributed across a broader fraction of the planetary surface (Figure 17(a), contour lines). Given reasonable assumptions for reservoir depths of tens to thousands of meters and assuming no reservoir replenishment, the dust cycle in our simulations would "turn off" in as little as thousands of years. If winds rapidly deplete reservoirs which cannot be easily replenished a land planet may counterintuitively have progressively clearer skies as it moves closer to its host star. Similarly, depending on the distribution of dust lifting versus dust sedimentation, the planet could cycle between eras of regime I and II lifting and regime III lifting as dust activity shifts to new reservoirs which are then periodically depleted.
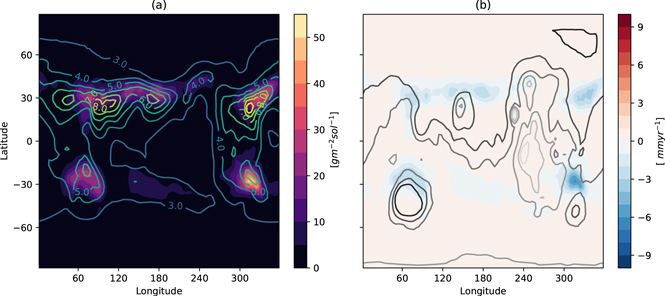
Figure 17. (a) Annual average excavation or lifting (filled contours) and sedimentation (contour lines) rates (g m−2 sol−1), and (b) average annual change to dust surface reservoir depth (mm). Grey contour lines in panel (b) show the surface topography. Sedimentation rate contours range from 0 to 9 in 1 g m−2 sol−1 intervals.
Download figure:
Standard image High-resolution image
4.3.3. The Hydrological Cycle
When considering land planet climates, the potential impacts of the hydrological cycle are typically disregarded or considered negligible. However, studies of present-day Mars' climate, a planet with a very limited overall water budget, demonstrates that even at low levels atmospheric water vapor and, in particular, water ice clouds can generate large-scale modifications to the planetary atmospheric thermal structure and dynamics, including the mean meridional circulation (Wilson et al. 2008; Madeleine et al. 2012; Navarro et al. 2014; Kahre et al. 2015; Haberle et al. 2019), transient and stationary eddies (Mulholland et al. 2016; Pottier et al. 2017; Haberle et al. 2019), and the thermal tide (Hinson & Wilson 2004; Kleinböhl et al. 2013; Wilson & Guzewich 2014). Further, the Martian hydrological cycle is directly coupled to the dust cycle. Water ice clouds nucleate on atmospheric dust particles. Coagulation and snowfall can help clear dusty atmospheres and cement or sequester surface dust reservoirs from further lifting. Radiatively active clouds may strengthen the semidiurnal thermal tide, particularly in the middle atmosphere (Kleinböhl et al. 2013; Haberle et al. 2019; Hartwick et al. 2019; Wilson & Guzewich 2014) and, through modifications to the vertical and horizontal thermal gradient, strengthen or suppress surface winds that determine the total dust mass lifting rates. Clouds will additionally modify the planetary spectrum. Without further study it is difficult to predict the degree to which water cloud coupling will modify the observed impacts of radiatively active dust on land planet climate and if the planetary spectrum will be notably changed or changed in such a way as to make the identification of land planets compared with ocean worlds less trivial. A fundamental question we plan to address in our next paper, therefore, is the nature of the complex coupling to the water cycle and the type of climates it produces.
5. Conclusions
In conclusion, we find that dust radiative feedbacks are critical to understanding and characterizing the climates and spectral signatures of arid land planets. Future studies of this unique planetary family must therefore carefully consider the treatment of dust and assumptions about dust radiative properties, chemical and mineralogical history, surface availability and lifting parameterizations. At close-in orbits dust can rapidly accumulate in the atmosphere, leading to a dusty greenhouse with warmer than freezing surface temperatures even for planets with thin atmospheres. Further, radiative warming in the middle and high atmosphere rapidly expands and strengthens seasonal large-scale dynamical patterns, including the prevailing Hadley circulation, and via magnification of the semidiurnal and higher harmonic thermal tide dramatically reorganize the spatial distribution of dust activity on the planetary surface. Atmospheric dust has potentially profound impacts on the overall planetary habitability. High levels of atmospheric dust limit the surface solar flux and therefore the potential for photosynthetic life-forms. By contrast, dust may represent a critical redistribution agent for important minerals and nutrients. Critically, atmospheric dust is coupled with the planetary hydrological cycle. Based on new observations of the long-term water history of Mars, it is possible that planets with significant vertical mixing of dust may act as a conveyor belt for water to the high atmosphere and subsequent loss to space. At the same time, dust has been shown to be an effective cloud condensation nucleus for water clouds on Earth and Mars. In future studies, we will investigate this complex coupling and the potential impact of radiatively active clouds, scavenging of dust particles, and precipitation on the climate and spectral signature of even very arid Mars-like exoplanets. We believe this represents a fruitful area for continued research including on planets with varied orbital and stellar properties, and atmospheric compositions, densities, etc. We may well find that land planets have varied and complex climatalogies, some of which may represent habitable alternatives to so-called Earth twins or spectral doppelgangers that confound our ability to easily characterize terrestrial planets by spectra alone.
The authors would like to thank Natasha Batalha for her assistance utilizing the PICASO software package. The authors appreciate the thorough reviews and insightful comments by Chester "Sonny" Harman and Natasha Batalha, which greatly improved this paper. V.H. was supported for this research by an appointment to the National Aeronautics and Space Administration (NASA) Postdoctoral Program at the Ames Research Center, administered by the Universities Space Research Association (USRA). Python scripts used to analyze data and generate figures in this paper are available on Github 1 with a copy deposited in Zenodo (doi:10.5281/zenodo.7105556); this research also made use of the Mars Climate Modeling Center (MCMC) Community Analysis Pipeline (Kling et al. 2022).
This research was sponsored by the National Aeronautics and Space Administration (NASA) through a contract with ORAU. The views and conclusions contained in this document are those of the authors and should not be interpreted as representing the official policies, either expressed or implied, of NASA or the U.S. Government. The U.S. Government is authorized to reproduce and distribute reprints for government purposes notwithstanding any copyright notation herein. Additional support for this research has been provided by the NASA HQ/Science Mission Directorate (SMD) and its Planetary Science Division (PSD) Research Program.