


Abstract
One of the possible mechanisms for heating the solar atmosphere is the magnetic reconnection occurring at different spatiotemporal scales. The discovery of fast bursty nanojets due to reconnection in the coronal loops has been linked to nanoflares and is considered as a possible mechanism for coronal heating. The occurrence of these jets mostly in the direction inwards to the loop was observed in the past. In this study, we report 10 reconnection nanojets, four with directions inward and six moving outward to the loop, in observations from the High-resolution Coronal Imager 2.1 and the Atmospheric Imaging Assembly (AIA) on board the Solar Dynamics Observatory. We determined the maximum length, spire width, speed, and lifetimes of these jets and studied their correlations. We found that outward jets with higher speeds are longer in length and duration while the inward jets show opposite behavior. The average duration of the outward jets is ≈42 s and that of inward jets is ≈24 s. We identified jets with subsonic speeds below 100 km s−1 to high speeds over 150 km s−1. These jets can be identified in multiple passbands of AIA extending from the upper transition region to the corona suggesting their multithermal nature.

Original content from this work may be used under the terms of the Creative Commons Attribution 4.0 licence. Any further distribution of this work must maintain attribution to the author(s) and the title of the work, journal citation and DOI.
1. Introduction
The flares have been observed in the solar atmosphere caused by magnetic reconnection at different spatial scales (Guidoni et al. 2016; Benz 2017; Patel et al. 2020). These reconnections occurring at various spatiotemporal scales are also considered as one of the mechanisms responsible for the coronal heating. These reconnections contribute to coronal heating where flare energies follow a power-law distribution, E ∼ W−1.8, where W is the total flare energy (Hudson 1991). The continuous footpoint motion of the magnetic field lines leads to the braiding of magnetic field lines, which cause magnetic reconnection and the formation of small-scale current sheets eventually leading to nanoflares (Parker 1988; van Ballegooijen et al. 2011) or recurrent plasma outflows (Pant et al. 2015). According to the Parker model, the small misalignment in the braided magnetic field lines within a flux tube causes magnetic reconnection. The stored magnetic energy is released and converted to the thermal and kinetic energies, which are responsible for the acceleration of particles.
Magnetic reconnections often lead to the formation of jets observed as inverted Y-shaped structures first observed in solar corona in X-ray wavelengths (e.g., Shimojo et al. 1996; Shimojo & Shibata 2000; Savcheva et al. 2007). Coronal jets are also observed in extreme ultraviolet (EUV) wavelengths (e.g., Nisticò et al. 2010; Chandrashekhar et al. 2014; Liu et al. 2016; Sarkar et al. 2016). These jets tend to show average projected lengths and widths in the range of 10–400 and 5–100 Mm, respectively, with speeds of 10–1000 km s−1 and an average lifetime in the range of a few tens of minutes (Shimojo & Shibata 2000; Mulay et al. 2016). In addition to these, the lower range of these jets, termed as jetlets, are know to have sizes about 3 times smaller than average coronal jets (Raouafi & Stenborg 2014; Panesar et al. 2018). Lower in the atmosphere, the jets are observed in the transition region with relatively smaller spatiotemporal scales (Tian et al. 2014; Narang et al. 2016; Samanta et al. 2017; Chen et al. 2019). The jets observed at chromospheric and transition region heights have projected lengths and widths of 1–11 Mm and 100–400 km, respectively, with speeds in the range of 5–250 km s−1 and 20–500 s lifetimes (De Pontieu et al. 2011; Tian et al. 2014; Samanta et al. 2019). Using the high-resolution Extreme Ultraviolet Imager (EUI; Rochus et al. 2020) on board the recently launched Solar Orbiter, Hou et al. (2021) reported the presence even of small-scale microjets in the quiet region of the solar atmosphere. These microjets were found to have a projected speed, width, maximum length, and average lifetime, of 62 km s−1, 1.0 Mm, 7.7 Mm, and 4.6 minutes, respectively.
A recent observation of jet-like structures called nanojets observed in the reconnecting, curved braided magnetic field lines in the solar atmosphere, provided a signature of nanoflare-based heating (Antolin et al. 2021). These very fast-speed (100–200 km s−1) and short-lived (<15 s) jets are much smaller in size compared to long-lived jet-like events observed earlier (Raouafi et al. 2016; Panesar et al. 2019, and references therein) with origins from photospheric magnetic flux cancellation. The earlier studies based on flux cancellation were mostly based on the observations from the Atmospheric Imaging Assembly (AIA; Lemen et al. 2012), and the Helioseismic and Magnetic Imager (HMI; Scherrer et al. 2012) of the Solar Dynamics Observatory (SDO) and the Interface Region Imaging Spectrograph (IRIS; De Pontieu et al. 2014). Such flux cancellation jets were also observed using the High-resolution Coronal imager (Hi-C 2.1; Rachmeler et al. 2019) by Panesar et al. (2019). The high-resolution imaging from Hi-C 2.1 also enabled the estimation of widths of fine strands of coronal loops (Williams et al. 2020a, 2020b), analysis of small-scale explosive events by flux cancellation (Tiwari et al. 2019), and identification of miniature filament eruption (Sterling et al.2020).
An interesting phenomena observed by Antolin et al. (2021) was the presence of jets directed inwards to the curvature of the coronal loop. To explain the asymmetric nature of nanojets, Pagano et al. (2021) performed analytical and numerical magnetohydrodynamic (MHD) simulations. Their analysis explained that the inward moving jets are more frequent and energetic than those moving outwards (away from the curvature of coronal loops). In a recent study it was found that the Kelvin–Helmholtz and Rayleigh–Taylor instabilities are the drivers for the reconnection in coronal loops leading to nanojets (Sukarmadji et al. 2022). In this paper, we present the observational study of outward and inward nanojets using Hi-C data complemented by the multiwavelength observations from the AIA. This paper is organized as follows: In Section 2 we describe the data sets used for this study. The analysis and results are presented in Section 3 followed by conclusions and a discussion in Section 4.
2. Observations
The second flight of Hi-C launched on 2018 May 29 observed an active region (AR; AR 12712) for ≈5 minutes from 18:56:26 to 19:01:56 UT in the 172 Å emission passband. The high spatial (0 129 pixel−1) and temporal resolution (4.4 s) of Hi-C 2.1 (Rachmeler et al. 2019) provided an unprecedented view of this AR. We identified 10 reconnection nanojets at different locations within the coronal loops in the Hi-C field of view (FOV), having direction inwards as well as outwards.
The same were also identified in a relatively low resolution in AIA 171 and 304 Å channels with signatures in 193 and 131 Å for a few. We have also used 45 s HMI line-of-sight magnetograms of the FOV to negate the presence of any possible photospheric flux cancellations. The coordinated IRIS observations were not available for this part of the FOV.
3. Analysis and Results
3.1. Overview
The top panel of Figure 1 shows the AIA 171 Å image with Hi-C FOV outlined with a red box. The Hi-C image processed with multiscale Gaussian normalization (Morgan & Druckmüller 2014) shown in panel (b) of the same figure. The locations of all the identified nanojets have been marked with white "+" symbol in Figure 1(b). A total of 10 jets were identified on the edges of the coronal loops out of which six were directed outwards while four were directed inwards. To substantiate that these jets do not have origin due to the photospheric magnetic flux cancellation, we used HMI observations. The average magnetic field was estimated at the location near the base of the jets and the time evolution was studied. It was found that unlike the previous studies, these observed jets do not originate from the photospheric flux cancellation. Moreover, the observed magnetic flux remains near to the noise level of the HMI instrument (Pesnell et al. 2012).

Figure 1. (a) Full-disk image of the Sun at 171 Å of AIA. Red box represents the Hi-C FOV that is shown in the (b). The locations of the identified nanojets are marked by "+" symbol in the Hi-C FOV in white.
Download figure:
Standard image High-resolution imageThe properties of these nanojets projected in the plane of the sky are tabulated in Table 1. The spire length and width are measured as described in Panesar et al. (2019). The third and fourth columns correspond to the location of the base of the jets in arcseconds. Nanojets N1 to N6 are the outward moving jets while N7 to N10 are the inward moving jets. The errors quoted in the table are statistical in nature determined by repeated measurements of parameters. We found that the average speed of the outward jets is of an order of a few hundred kilometers per second with few having subsonic speeds. The inward jets on the other hand have an average speed of ≈50 km s−1. We could identify outward jets with lengths ranging from 924 to 4508 km, which is more than twice the length of the inward jets. The average width of both the classes of jets is ≈1100 km. We could identify jets with lifetimes as small as 8–79 s with an average duration of 35 s. Out of the 10 jets, we present the morphological and kinematical evolution of five nanojets:
Table 1. Physical Properties of the Observed Nanojets
| Nanojet ID | Start Time (UT) | x'' | y'' | Speed (km s−1) | Spire Length (km) | Spire Width (km) | Lifetime (s) | Direction |
|---|---|---|---|---|---|---|---|---|
| N1 | 19:00:46 | −209.6 | 161.7 | 152 ± 24 | 4508 ± 231 | 1180 ± 118 | 40 | Outward |
| N2 | 19:01:30 | −209.6 | 161.7 | 234 ± 29 | 4100 ± 179 | 1440 ± 157 | 40 | Outward |
| N3 | 18:57:21 | −86.02 | 144.1 | 203 ± 31 | 3255 ± 201 | 1365 ± 77 | 79 | Outward |
| N4 | 18:58:58 | −235.9 | 207.7 | 35 ± 9 | 2433 ± 352 | 1231 ± 196 | 31 | Outward |
| N5 | 18:59:02 | −190.5 | 340.5 | 63 ± 14 | 2555 ± 155 | 1245 ± 236 | 26 | Outward |
| N6 | 19:00:29 | −140.4 | 307.9 | 56 ± 5 | 924 ± 141 | 766 ± 84 | 40 | Outward |
| N7 | 18:57:18 | −238.2 | 204.5 | 46 ± 14 | 1952 ± 284 | 1207 ± 207 | 31 | Inward |
| N8 | 18:57:18 | −237.2 | 202.5 | 47 ± 12 | 1690 ± 215 | 1011 ± 130 | 13 | Inward |
| N9 | 18:56:52 | −196.05 | 206.5 | 62 ± 5 | 1573 ± 143 | 1175 ± 131 | 9 | Inward |
| N10 | 18:59:33 | −180.8 | 183.2 | 46 ± 6 | 2822 ± 117 | 1114 ± 129 | 40 | Inward |
Download table as: ASCIITypeset image
3.2. Nanojets N1 and N2
Figure 2 shows examples of jets moving outward from the coronal loop. An artificial slice is placed along the direction of propagation of the jet shown as a cyan dashed line in panels (a) and (d). The snapshots corresponding to the two jets occurring from the same spot but differing in time are shown in panels (a)–(c) and (d)–(f), respectively.
Figure 2. Time evolution of two outward moving nanojets, 1 and 2. (a)–(c) show snapshots in Hi-C FOV for nanojet 1 while (d)–(f) show snapshots for nanojet 2. The white arrow points to the location of the jets. The time–distance plot is generated along the dashed cyan line shown in (a) and (d). (g) The time–distance plot for the two nanojets with starting time shown as T0 at the top of the plot. An animation of this figure is available showing the time evolution of nanojets along with the time–distance sequence of panel (g). The animation begins at 2018 May 29 at 18:59:59 and ends the same day at 19:01:52. The real-time duration of the animation is 4 s.
(An animation of this figure is available.)
Download figure:
Video Standard image High-resolution imageThe time–distance map along the slice is shown in the Figure 2(g) where the two ridges mark the presence of two successive jets from the same location. The linear fitting is done on the ridges in the distance–time map for multiple times (as many as 10 times) to cover the width of the ridge and account for the manual fitting. The panel (g) corresponding to Figure 2 (and successive such plots) shows the representative line, which is an average of the multiple measurements. These two jets are one of the longest and fastest of the observed jets in this data set. The duration of jet N2 extends beyond the available Hi-C observation, which covers 26 s. The AIA 171 Å image where it is last identified is used to quantify its complete lifetime.
The multiwavelength observations of the two jets, N1 and N2, are shown in the two respective panels of Figure 3. The images from left to right in the two panels correspond to AIA 304 Å (Figures 3(a), (e)) representing lower transition region temperature (logT ≈ 4.8–5) and upper transition region temperatures (logT ≈ 5.7–5.9) probed by AIA 131 Å (Figures 3(b), (f)) and 171 Å (Figures 3(c), (g)). The coronal temperature (logT ≈ 6.2–6.3) is shown in the panels (d) and (h) of the same Figure with AIA 193 Å observations. In all the images the base of the observed jets is marked with a white arrow. The observation of jets over a range of AIA passbands suggests that these are multithermal in nature reaching the coronal temperatures.

Figure 3. Multiwavelength AIA observations of the two nanojets, N1 and N2, observed in Hi-C FOV. The upper and lower panels correspond to the two nanojets observed in AIA 304, 131, 171 and 193 Å, respectively, from left to right.
Download figure:
Standard image High-resolution image3.3. Nanojets N4, N7, and N8
Figure 4 shows snapshots of a region where three nanojets are observed. An outward moving jet, N4, is shown in panels (a)–(c) while N7 and N8 appear to originate from the same spot but in opposite directions. In these projected plane it appears both are directed inwards one moving upwards (N7) while the other (N8) downwards. The white arrow in all the panels points toward the location of these jets. The cyan dashed line shown in panels (a) and (d) are the slices along which the time–distance plots are made to study their temporal evolution. The time–distance plots corresponding to N4, N7, and N8 are shown in panels (g), (h), and (i) of the same figure. The bright ridge in these plots shows the movement of the jet along the cyan slices shown in panels (a) and (d). All the three jets are found to be having speeds less than 50 km s−1.
Figure 4. (a)–(c) shows time evolution snapshots of an outward nanojet, N4, in Hi-C FOV, while (d)–(f) shows snapshots for nanojets N7 and N8, which move inwards. The white arrow points to the location of the jets. The time–distance plot is generated along the dashed cyan line shown in (a) and (d). (g)–(i) shows the time–distance plots for the jets N4, N7, and N8, respectively, with the starting time shown as T0 at the top of the plots. An animation of this figure is available showing the time evolution of the nanojets and the time–distance sequence of panels (g)–(i). The animation begins at 2018 May 29 at 18:56:26 and ends the same day at 19:01:52. The real-time duration of the animation is 4 s.
(An animation of this figure is available.)
Download figure:
Video Standard image High-resolution imageTwo of these jets, N4 and N7, showed some signatures in multiple passbands of AIA (Figure 5). N4 could be seen as a small brightening in 304 and 171 Å passbands with a very weak signature in the hotter 193 Å channel of AIA (Figures 5(a)–(c)). On the other hand, N7 shows signatures in AIA 304 and 171 Å channels while no signature is visible in 193 Å. Unlike N1 and N2, these two jets do not show any clear indication in the 131 Å passband. The smaller size of these jets compared to N1 and N2 could be one of the reasons behind their feeble signatures in AIA passbands. These two jets also appear multithermal in nature with dominant contribution in the cooler channels of AIA. It should also be noted that N8 could not be distinctly identified in any AIA passband. This could be due to its relatively smaller size and short-lived nature (8 s), such that it could not be seen with the spatiotemporal resolution of AIA.

Figure 5. Multiwavelength AIA observations of two nanojets, N4 and N7, observed in Hi-C FOV. The jet N8, being small, could not be distinguished from the background in AIA resolution. The upper and lower panels correspond to the two jets observed in AIA 304, 171, and 193 Å, respectively, from left to right. (c) The jet N3 is barely visible in 193 Å but no sign for jet N7 could be seen in (f) for the same channel.
Download figure:
Standard image High-resolution imageTime evolution images of other nanojets listed in Table 1 are included in Appendix.
3.4. Correlation between Physical Parameters of Nanojets
We studied the correlation of various estimated physical parameters of the identified nanojets. The left and middle panels of Figure 6 show the relation of the jets' speed with the maximum length attained by them and their lifetimes, respectively. The right panel of the same figure shows the relation between the dimensions (length and width) of the jets. The outward and inward jets are shown in red and blue, respectively. The error bars for the speed, length, and width correspond to the 1σ value mentioned in Table 1, while that for lifetime is the temporal resolution of the Hi-C 2.1 instrument (4 s).

Figure 6. Relation between estimated parameters of reconnection nanojets where the outward jets are shown in red while the blue represents the inward moving ones. The correlation coefficients for the individual classes are shown in their respective colors. For the relation between length and width, negligible correlation is found for the inward directed jets.
Download figure:
Standard image High-resolution image
From the plots in the left and middle panels it can be seen that these parameters are positively correlated for the outward jets, but negatively correlated for inward jets. We found a similar negative correlation of 45% and 49% was found for speed–length and speed–lifetime for the inward jets listed by Sukarmadji et al. (2022). It can be seen in the right panel of the Figure 6 that there is a good correlation of ≈75% between the length and widths of the outward jets. However, for the observed sample of inward jets, a negligible correlation was found between the two parameters. A similar, however unreported, strong correlation of ≈82% was found for such jets listed by Sukarmadji et al. (2022).
4. Conclusions and Discussion
We identify and report reconnection nanojets from the coronal loop associated with AR 12712 observed during the second flight of Hi-C in the 172 Å passband with high spatiotemporal resolution. We identified and studied 10 nanojets, four of which had directions inward while six were directed outwards with respect to the direction of the radius of the curvature of the coronal loop. These jets were observed with locations at different regions in the coronal loops unlike in clusters as reported by Sukarmadji et al. (2022). Adding to the previous studies of Antolin et al. (2021) and Sukarmadji et al. (2022) where only two outward directed nanojets were found, we identified and report a few more of these nanojets in addition to the inward population. The presence of outward jets with asymmetric natures were predicted by the numerical MHD models but with a lower probability compared to the inward moving ones (Pagano et al. 2021).
To confirm that these jets originate from the loop and not from the photosphere, we also used HMI magnetograms and estimated an average magnetic field at the location of the base of the jets. We found that the location appears to be mostly quiet region with average magnetic flux at the noise level below 17 G (Pesnell et al. 2012).
For the observed sample of Hi-C 2.1 nanojets we estimated the maximum length and width of the spire corresponding to these jets, along with the speed and their lifetime, and identified the correlations between various parameters. We found that the length and width varies from ≈900 to ≈4500 km and ≈700 to ≈1500 km, respectively, for outward directed jets, while the inward jets have lengths in the range from ≈1500 to ≈2800 km with widths ≈1100 km. These jets have dimensions more than the ones observed by Antolin et al. (2021) and lie at the tail of the distribution presented in Sukarmadji et al. (2022).
For the outward jets we estimated the speeds from as low as 35 km s−1 to more than 200 km s−1. The speed for the inward jets ranges 40–60 km s−1 implying their subsonic nature. The majority of the nanojets observed in previous studies had speeds in the range of 100–200 km s−1 with few jets listed by Sukarmadji et al. (2022) having a speed below 100 km s−1. It is worth noting that three of the outward moving jets have speeds higher than 150 km s−1, which is comparable to the speed of inward directed jets in the earlier observational studies. This in contrary to the previous results that explained that outward jets are expected to be shorter and slower than the inward jets (Antolin et al. 2021).
The lifetime of the identified jets ranges from the shortest duration of 9 s to the longest of 79 s. The average lifetime of outward jets is ≈42 s and that of inward jets is ≈24 s. The outward jets are long-lived features compared to the ≤15 and ≈25 s lifetime jets reported in Antolin et al. (2021) and Sukarmadji et al. (2022). These jets are of short duration and less than half the length of jets reported in another study based on Hi-C observations by Panesar et al. (2019) where the jets had their origin due to photospheric magnetic flux cancellation. These nanojets are of about less than half the length but are of similar widths when compared with microjets observations by Hou et al. (2021) and jet-like campfires and EUV dots reported by Panesar et al. (2021) and Tiwari et al. (2022), respectively, using the Solar Orbiter EUI data. The lifetime of the observed nanojets is on average smaller than the small-scale jet-like features in aforementioned studies. This shows that a wide spectrum of the jets exists in the solar atmosphere. A few of the nanojets are also observed in multiple passbands of AIA in 304, 171, 131, and 193 Å. This suggests that the jets are multithermal in nature with temperature varying from those of the upper transition region to hotter corona.
We also found that certain parameters associated with these jets are well correlated. Based on a sample of 10 jets presented in this study, it turned out that faster outward jets have longer spire lengths and last longer, whereas the inward faster jets are shorter in length as well as duration. A similar trend was also observed when these parameters of jets from Sukarmadji et al. (2022) were correlated for comparison. The outward jets also showed a good agreement for their physical dimensions, which was not obtained for the inward jets. However, when these quantities from a larger sample of previous study were considered, a similar relation was also seen for the inward jets, which was unreported earlier.
This study suggests even though the preferential direction of jets in the loops may be inwards, the outward moving jets may not be so uncommon in the solar atmosphere. This study could be extended to look for more reconnection nanojets using the data from EUI High Resolution Imager (HRI) of the Solar Orbiter. Investigation of high-spatiotemporal studies from IRIS and future missions like Hi-C may help build a statistics of such reconnection jets allowing us to understand their role in heating the solar atmosphere at small scales. Such studies could be further complemented with the high-resolution imaging and spectroscopy based future missions such as Multi-slit Solar Explorer (De Pontieu et al. 2020; Cheung et al. 2022; De Pontieu et al. 2022) and Solar-C EUV High-Throughput Spectroscopic Telescope (Shimizu et al. 2019) covering a wide range of temperatures from transition region to corona.
We thank the anonymous referee for their valuable comments and suggestions. We acknowledge NASA/SDO team to make AIA and HMI data for open access. SDO is a mission for NASA's Living With a Star (LWS) program. We acknowledge the High-resolution Coronal Imager (Hi-C 2.1) instrument team for making the second re-flight data available under NASA proposal 17-HTIDS17_2-003. MSFC/NASA led the mission with partners including the Smithsonian Astrophysical Observatory, the University of Central Lancashire, and the Lockheed Martin Solar and Astrophysics Laboratory. Hi-C 2.1 was launched out of the White Sands Missile Range on 2018 May 29.
Appendix: Hi-C Images of Other Nanojets Listed in Table 1
The temporal evolution of outward nanojets N3, N5, and, N6 is shown in Figures 7, 8, and 9 respectively, whereas for inward nanojets N9, and N10 it is shown in Figures 10 and 11, respectively.
Figure 7. Time evolution of an outward moving nanojet, N3. The first three panels show snapshots for nanojet 3. The white arrow points to the location of the jet. The time–distance plot shown in the last panel is generated along the dashed cyan line shown in left panel. The starting time shown as T0 at the top of the plot. An animation of this figure is available showing the time evolution of nanojet N3 along with the time–distance sequence of panel (g). The animation begins at 2018 May 29 at 18:56:26 and ends the same day at 18:59:33. The real-time duration of the animation is 2 s.
(An animation of this figure is available.)
Download figure:
Video Standard image High-resolution image
Figure 8. Time evolution of an outward moving nanojet, N5. The first three panels show snapshots for nanojet 5. The white arrow points to the location of the jet. The time–distance plot shown in the last panel is generated along the dashed cyan line shown in left panel. The starting time shown as T0 at the top of the plot. An animation of this figure is available showing the time evolution of nanojet N5 along with the time–distance sequence of panel (g). The animation begins at 2018 May 29 at 18:56:26 and ends the same day at 19:01:52. The real-time duration of the animation is 4 s.
(An animation of this figure is available.)
Download figure:
Video Standard image High-resolution image
Figure 9. Time evolution of an outward moving nanojet, N6. The first three panels show snapshots for nanojet 6. The white arrow points to the location of the jet. The time–distance plot shown in the last panel is generated along the dashed cyan line shown in left panel. The starting time shown as T0 at the top of the plot. An animation of this figure is available showing the time evolution of nanojet N6 along with the time–distance sequence of panel (g). The animation begins at 2018 May 29 at 18:56:26 and ends the same day at 19:01:52. The real-time duration of the animation is 4 s.
(An animation of this figure is available.)
Download figure:
Video Standard image High-resolution image
Figure 10. Time evolution of an inward moving nanojet, N9. The first three panels show snapshots for nanojet 9. The white arrow points to the location of the jet. The time–distance plot shown in the last panel is generated along the dashed cyan line shown in left panel. The starting time shown as T0 at the top of the plot. An animation of this figure is available showing the time evolution of nanojet N9 along with the time–distance sequence of panel (g). The animation begins at 2018 May 29 at 18:56:21 and ends the same day at 18:58:32. The real-time duration of the animation is 2 s.
(An animation of this figure is available.)
Download figure:
Video Standard image High-resolution image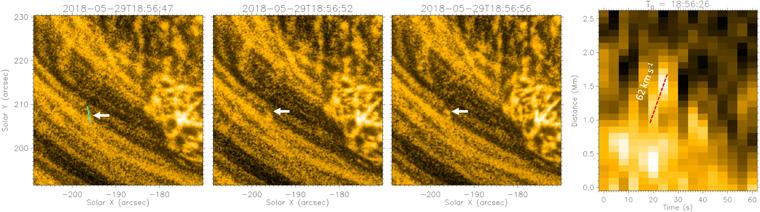
Figure 11. Time evolution of an inward moving nanojet, N10. The first three panels show snapshots for nanojet 10. The white arrow points to the location of the jet. The time–distance plot shown in the last panel is generated along the dashed cyan line shown in left panel. The starting time shown as T0 at the top of the plot. An animation of this figure is available showing the time evolution of nanojet N10 along with the time–distance sequence of panel (g). The animation begins at 2018 May 29 at 18:56:26 and ends the same day at 19:01:52. The real-time duration of the animation is 4 s.
(An animation of this figure is available.)
Download figure:
Video Standard image High-resolution image