


Abstract
The CALorimetric Electron Telescope (CALET) on the International Space Station consists of a high-energy cosmic-ray CALorimeter (CAL) and a lower-energy CALET Gamma-ray Burst Monitor (CGBM). CAL is sensitive to electrons up to 20 TeV, cosmic-ray nuclei from Z = 1 through Z ∼ 40, and gamma rays over the range 1 GeV–10 TeV. CGBM observes gamma rays from 7 keV to 20 MeV. The combined CAL-CGBM instrument has conducted a search for gamma-ray bursts (GRBs) since 2015 October. We report here on the results of a search for X-ray/gamma-ray counterparts to gravitational-wave events reported during the LIGO/Virgo observing run O3. No events have been detected that pass all acceptance criteria. We describe the components, performance, and triggering algorithms of the CGBM—the two Hard X-ray Monitors consisting of LaBr3(Ce) scintillators sensitive to 7 keV–1 MeV gamma rays and a Soft Gamma-ray Monitor BGO scintillator sensitive to 40 keV–20 MeV—and the high-energy CAL consisting of a charge detection module, imaging calorimeter, and the fully active total absorption calorimeter. The analysis procedure is described and upper limits to the time-averaged fluxes are presented.

Original content from this work may be used under the terms of the Creative Commons Attribution 4.0 licence. Any further distribution of this work must maintain attribution to the author(s) and the title of the work, journal citation and DOI.
1. Introduction
The importance of simultaneous or near-simultaneous multimessenger observations has long been recognized (e.g., Mészáros et al. 2019 and Burns et al. 2019 for recent reviews), and was clearly demonstrated over three decades ago by the correlated neutrino and optical observations of SN1987A (Bionta et al. 1987; Hirata et al. 1987; Shelton 1987; Alexeyev et al. 1988). The observations of the gravitational radiation event GW170817 from a binary neutron star merger (Abbott et al. 2017a) together with the short gamma-ray burst (GRB) GRB 170817A (Goldstein et al. 2017; Savchenko et al. 2017) and the optical transient AT2017gfo (Abbott et al. 2017b) have now made it possible to draw physics conclusions about the connection between short GRBs and neutron star mergers, the origin of heavy r-process elements, the speed of gravitational waves, and the nature of kilonovae. Additional observations of short GRBs associated with gravitational-wave events will especially provide information about neutron stars and their mergers, the nature of the GRB jet, and the neutron star equation of state (Burns 2020; Pian 2021). A number of joint gamma-ray/gravitational-wave searches have been carried out since the 2017 event involving LIGO/Virgo and Fermi-GBM (Hamburg et al. 2020; Stachie et al. 2020), Swift (Page et al. 2020; Abbott et al. 2021), INTEGRAL (Mereghetti et al. 2018), AGILE (Verrecchia et al. 2019), and Calorimetric Electron Telescope (CALET; Yamaoka et al. 2017; Adriani et al. 2018). In no case since GRB 170817A/GW170817, however, has there been a confirmed positive GRB signal in association with a LIGO/Virgo gravitational-wave event.
The Japanese–Italian–US CALET cosmic-ray/gamma-ray telescope (Figure 1) was launched to the International Space Station (ISS) on 2015 August 19 and has been in operation on the Exposed Facility of the Japanese Experiment Module (JEM-EF) of the ISS since 2015 October (Asaoka et al. 2018a; Adriani et al. 2019, 2020, 2021). The main detector of the CALET payload is a calorimeter (CAL) to observe high-energy cosmic rays and gamma rays above 1 GeV. In addition, the Gamma-ray Burst Monitor (CGBM) covers the gamma-ray energy range from 7 keV to 20 MeV.
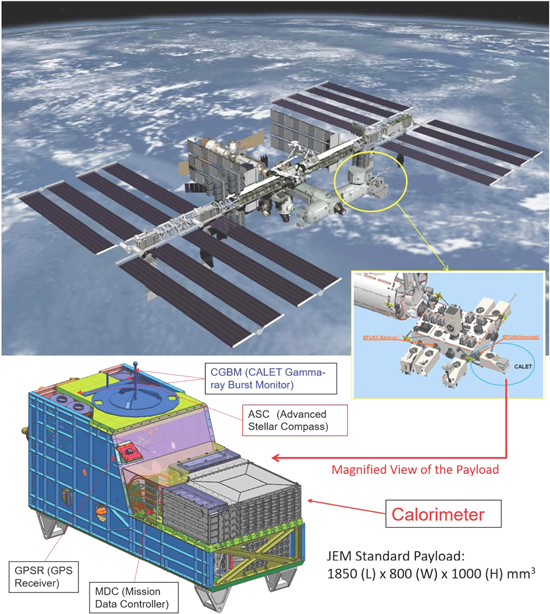
Figure 1. Schematic of CALET on the ISS. CALET is mounted on port 9 of JEM-EF. CALET consists of CAL, CGBM, support sensors including the Advanced Stellar Camera (ASC) and the Global Position Sensor Receiver (GPSR), and the Mission Data Controller (MDC) which controls the CALET detectors and acquires the data from the instruments.
Download figure:
Standard image High-resolution imageThe ongoing CGBM and CAL searches for GRBs are described by Kawakubo et al. (2021). The searches for CGBM and CAL counterparts to Advanced LIGO and Advanced Virgo gravitational-wave events during LIGO/Virgo observing runs O1 and O2 are described in Yamaoka et al. (2017) and Adriani et al. (2018). The present paper describes the search by the CALET gamma-ray detectors for prompt GRBs associated with gravitational-wave events during LIGO/Virgo observing run O3. In Section 2, we describe the low-energy and high-energy CALET gamma-ray telescopes. In Section 3 we discuss the analysis procedures and present the results of the CALET GRB counterpart search during LIGO/Virgo observation run O3. Finally, we discuss the results and conclusions in Section 4.
2. CALET and Gamma-Ray Burst Observations
2.1. CALET Gamma-Ray Burst Monitor (CGBM)
The CAL and CGBM instruments have gamma-ray sensitivity in different energy ranges. CGBM is primarily responsible for observing prompt emission from GRBs (Kawakubo et al. 2019, 2021). CGBM consists of two Hard X-ray Monitors (HXMs) and the Soft Gamma-ray Monitor (SGM). Each HXM module consists of a 6.6 cm diameter × 1.3 cm deep and a 7.9 cm diameter ×1.3 cm deep LaBr3(Ce) scintillator; SGM consists of a 10.2 cm diameter × 7.6 cm deep BGO scintillator. Both are viewed by photomultiplier tubes (PMTs). Outputs of the PMTs are amplified by two amplifiers with a ratio of gains ∼30 and pulse heights are acquired individually as high-gain and low-gain pulse heights in order to provide the required dynamic range. The two subsystems provide sensitivity to X-rays and gamma rays over the energy range 7 keV–1 MeV (HXM) and 40 keV–20 MeV (SGM), as shown in Figure 2. The detectors have fields of view ∼3 sr (HXM) and ∼8 sr (SGM).

Figure 2. CGBM effective areas vs. gamma-ray energy for the individual HXM1 and HXM2 detectors and for SGM at vertical incidence.
Download figure:
Standard image High-resolution imageCGBM normally collects two types of continuous monitor data suitable for temporal analysis and spectral analysis: time history (TH) data with 0.125 s resolution and eight energy channels (four channels in high gain and four channels in low gain) and pulse height (PH) data with 4 s resolution and 512 channels (102 channels with high gain and 410 channels with low gain). Energy ranges for the high-gain and low-gain channels in TH data are listed in Table 1. Monitor data are collected every 0.125 s and transmitted to the ground every second. In addition, an onboard trigger system uses the signal-to-noise ratio (S/N) calculated every 0.25 s to detect increased count rates:
Here Δt is the foreground (signal) integration time; Ntot is the number of counts integrated over Δt in the selected energy range; and NBG is the number of background counts in the selected energy range integrated over the background time interval ΔtBG preceding Δt.
Table 1. Energy Ranges of TH Channels
| TH Channel | HXM | SGM |
|---|---|---|
| High gain ch0 | 7–10 keV | 40–100 keV |
| High gain ch1 | 10–25 keV | 100–230 keV |
| High gain ch2 | 25–50 keV | 230–450 keV |
| High gain ch3 | 50–100 keV | 450–1000 keV |
| Low gain ch0 | 60–100 keV | 550–830 keV |
| Low gain ch1 | 100–170 keV | 830–1500 keV |
| Low gain ch2 | 170–300 keV | 1.5–2.6 MeV |
| Low gain ch3 | 300–3000 keV | 2.6–28 MeV |
Download table as: ASCIITypeset image
S/Ns are calculated on board continuously every 0.25 s for ΔtBG = 16 s and four signal integration times (Δt = 0.25 s, 0.5 s, 1 s, or 4 s) over the energy ranges 25–100 keV for HXM and 50–300 keV for SGM. An onboard trigger threshold is set at S/N = 8.5 for each HXM and 7.0 for SGM. If any calculated S/N exceeds the trigger thresholds, CGBM captures ∼700 s of individual event data starting ∼200 s prior to the trigger and consisting of event arrival times with a time resolution of 62.5 μs and ADC pulse heights corresponding to the individual energy deposits in each detector. Each event consists of two ADC pulse heights measured by high gain and low gain. When a CGBM onboard trigger occurs, (1) the CGBM event-by-event data with fine time resolution are recorded; (2) the energy threshold of the CAL is reduced from its normal 10 GeV threshold to 1 GeV for approximately 10 minutes (low-energy gamma-ray or LEG mode) to increase the CAL sensitivity to GeV photons from GRBs; and (3) two optical images with an exposure of 0.5 s are taken by the Advanced Stellar Compass (ASC) star sensor (Hudeca et al. 2011) to detect optical flashes during the prompt emission phase. The CGBM event data buffer can store event data from four successive triggers on board. When a fourth trigger occurs before the buffer is emptied, the onboard trigger is disabled until event data are downlinked and deleted. The downlinks of the CGBM event data and optical images are performed three times a week.
A trigger alert system running on the ground server at the Tsukuba Space Center of the Japanese Aerospace Exploration Agency (JAXA) analyzes the real-time monitoring data including housekeeping data, status information, and data settings when a CGBM onboard trigger occurs (Asaoka et al. 2018b). When the alert system notices a CGBM onboard trigger, the real-time TH data are analyzed and a GCN notice is delivered. If real-time data are unavailable due to loss of connection between the ISS and ground, hourly data distributed with at most one hour delay can be used for ground analysis.
As an example, the time histories of GRB 200521A observed in the three detectors of CGBM are shown in Figure 3 (Yoshida et al. 2020). GRB 200521A was also detected by ASIM, AGILE, INTEGRAL SPI-ACS, and Konus-Wind (Marisaldi et al. 2020; Svinkin et al. 2020; Verrecchia et al. 2020). A sky map of GRBs detected by CGBM through 2021 November is shown in Figure 4. Since CGBM has no capability to localize the GRBs, GRB positions were based on the reports to the Gamma-ray Coordinates Network (GCN) 42 by other GRB instruments. Out of 271 GRBs detected by CGBM, 195 were localized by other instruments.

Figure 3. Time histories of counts observed in HXM1, HXM2, and SGM for GRB 200521A.
Download figure:
Standard image High-resolution image
Figure 4. Incident angle distribution of GRBs in the SGM field of view. Black points are GRB positions in the SGM coordinate. Gray shaded regions show the ISS fixed structures viewed from CALET.
Download figure:
Standard image High-resolution imageCharged particles trapped by the Earth's geomagnetic field cause the CGBM count rates to increase at high geomagnetic latitudes and through the South Atlantic Anomaly (SAA). Therefore, CGBM high voltages are turned off at high geomagnetic latitudes and during SAA passages in order to avoid false triggers and excessive PMT currents due to increased particle fluxes. As a result, the cumulative CGBM live time over the period 2015 October–2021 November is ∼60%.
The Active Thermal Control System (ATCS) of the JEM-EF maintains temperature variations for CAL to within a few degrees. However, CGBM temperatures are not controlled by the ATCS. CGBM temperature variations depend on both the solar beta angle and solar altitude. Temperature corrections can be made on the ground using prominent background lines at 34 keV, 511 keV, 1.47 MeV, and 2.2 MeV.
2.2. CALET Calorimeter (CAL)
The primary purpose of CAL is to observe high-energy electrons, protons, and nuclei. In addition, CAL is also sensitive to gamma rays at 1 GeV–10 TeV (Cannady et al. 2018). The primary CAL trigger mode for cosmic rays and gamma rays is the High-Energy (HE) mode with a threshold of 10 GeV for the observed energy. CAL typically takes data in HE mode, but when the geomagnetic latitude is below 20° (except around the SAA) or following a CGBM trigger, CAL adds LEG mode with the gamma-ray trigger threshold lowered to 1 GeV (Cannady et al. 2018).
CAL identifies particles based on the ionization energy deposited in three separate detector systems: (1) The Charge Detector (CHD) located at the top of CAL consists of two orthogonal layers made of 14 plastic scintillator paddles with individual element charge resolution for particles from electrons and protons to ultraheavy nuclei with Z ∼ 40. (2) Below the CHD, a finely segmented preshower Imaging Calorimeter (IMC) consists of eight double layers of 1 mm2 cross-sectional scintillating fibers, arranged in belts along orthogonal directions, interspersed with seven layers of tungsten with a total thickness of 3 radiation lengths (r.l.). IMC can observe tracks of incident particles and provides an independent charge determination, fine-grained tracking information, and an image of the initial stage of the shower development. (3) The Total Absorption Calorimeter (TASC) located at the bottom of CAL consists of lead tungstate (PbWO4) bars arranged in 12 layers with a total thickness of 27 r.l., sufficiently deep to absorb electron showers totally up to TeV energies.
Incident high-energy gamma rays produce Compton electrons and e+e− pairs in the IMC, resulting in electromagnetic showers. Gamma-ray events are distinguished by the absence of signals in CHD and the top layers of IMC and by the consistency of the observed shower profile in the IMC and TASC with an electromagnetic rather than a hadronic shower. The three CAL subsystems are shown in Figure 5 together with examples of the CAL response to electrons, protons, nuclei, and gamma rays. Incoming gamma-ray directions are checked to eliminate events that might have crossed ISS structures in the CAL field of view (Cannady et al. 2021). The detector performance is characterized by Monte Carlo simulations compared in detail to a series of accelerator calibrations (Asaoka et al. 2017) and regularly monitored in flight with cosmic-ray data.

Figure 5. Schematic of CAL calorimeter showing CHD, IMC, and TASC subsystems and characteristically identifiable behavior of electrons, protons, nuclei, and gamma rays passing through the detector. Gamma rays are identified by the absence of charge in the CHD and IMC and by the shape and profile of the electromagnetic shower in the TASC. Signal amplitudes are shown according to the right-hand color scale in terms of minimum ionizing particle (MIP) energy deposits.
Download figure:
Standard image High-resolution imagePhoton energies are determined by summing the deposited energies in the TASC. At 10 GeV, the energy resolution is 3%. The CAL field of view for gamma rays is ∼45° from the zenith.
The analysis algorithms (CC Track mode for the LEG trigger and EM Track mode for the HE trigger) are described in Cannady et al. (2018). The effective area is shown for both CC and EM Track mode in Figure 6(a) as a function of gamma-ray energy for four separate zenith angle ranges. The effective area reaches ∼400 cm2 for energies up to ∼50 GeV, where the identification of zero-charge particles in CHD and IMC begins to be affected by the backscatter of higher energy particles.

Figure 6. (a) CAL effective area for gamma rays as a function of energy in four zenith angle ranges for both the LEG (CC Track, solid symbols) and HE (EM Track, open symbols) trigger configurations, from Adriani et al. (2018). (b) CAL angular resolution C68 for the two trigger conditions as a function of gamma-ray energy and the number of IMC layers used for tracking. The smooth curve shows the fitted resolution function described by Cannady et al. (2018).
Download figure:
Standard image High-resolution imageThe angular resolution is shown in Figure 6(b) separately for CC and EM modes as a function of the gamma-ray energy and Np
, the number of IMC layers used in the tracking. The angular resolution in Figure 6(b) is defined as the value C68 such that 68% of simulated events have reconstructed directions deviating from the true direction by an angle α < C68. C68 is 0 5 or better for all energies above 1 GeV for all but the shortest tracks.
A sky map for 5 yr of CAL observations above 1 GeV including steady gamma-ray sources and bright transient events (e.g., CTA102) is shown in Figure 7. Sources are marked by green or blue circles depending on extragalactic or Galactic origin, respectively. Although the CAL energy range is far above the typical energy range of GRB prompt emissions, CAL provides the possibility of detecting high-energy gamma-ray emission from GRBs similar to events observed up to nearly 100 GeV by Fermi-LAT (Ajello et al. 2019b).

Figure 7. Map of the sky above 1 GeV observed by CAL in Galactic coordinates (Cannady et al. 2021). The point-spread function is determined for each photon event and an order 9 Healpix map (∼7' resolution) is filled with the summed smeared signals from each event. Total exposure is accumulated in bins of energy for each pixel of an order 6 Healpix map (∼55' resolution). The resulting counts map is shown in logarithmic scaling.
Download figure:
Standard image High-resolution image3. CALET Search for GW Events during the LIGO/Virgo Third Observing Run
CALET was still in its commissioning phase at the time of the initial LIGO detection of GW150904. Since 2015 October, however, CALET has actively searched for electromagnetic counterparts of gravitational-wave events. The CGBM and CAL searches for Advanced LIGO and Advanced Virgo events during O1 and O2 have been described by Yamaoka et al. (2017) and Adriani et al. (2018) respectively. Here we describe the CALET search since the start of O3 in 2019. The LIGO/Virgo collaboration (LVC) reported 56 gravitational events (not including retracted events) in O3. Also, LVC and Fermi-GBM reported one subthreshold event (Abbott et al. 2019). The 57 events are shown in Table 2. All information in Table 2 is based on GCN circulars and The Gravitational-wave Candidate Event Database (GraceDB) 43 operated by LIGO. Here "possible source" shows the most probable source as listed in GraceDB. CALET has searched for electromagnetic counterparts of gravitational waves in both the CGBM and CAL data and results have been reported in GCN circulars (Table 2). We describe the details of the CGBM and CAL analyses separately in Sections 3.1 and 3.2.
Table 2. Summary of LVC Gravitational-wave Events in O3 and CALET Follow-up Observations
| Event Name | Possible Source | Event Time (T0) | LVC GCN Circular No. | CALET GCN Circular No. |
|---|---|---|---|---|
| S190408an | BBH (>99%) | 2019/04/08 18:18:02.288180 | 24069 | 24088 |
| S190412m | BBH (>99%) | 2019/04/12 05:30:44.165622 | 24098 | ⋯ |
| S190421ar | BBH (97%) | 2019/04/21 21:38:56.250977 | 24141, 24375 | ⋯ |
| S190425z | BNS (>99%) | 2019/04/25 08:18:05.017147 | 24168, 24228 | 24218 |
| S190426c | Terrestrial (58%) | 2019/04/26 15:21:55.336540 | 24237, 24277, 24279, 24411 | 24276 |
| S190503bf | BBH (96%) | 2019/05/03 18:54:04.294490 | 24377 | 24403 |
| S190510g | Terrestrial (58%) | 2019/05/10 02:59:39.291636 | 24442, 24448, 24462, 24489 | 24495 |
| S190512at | BBH (99%) | 2019/05/12 18:07:14.422363 | 24503, 24584 | 24531 |
| S190513bm | BBH (94%) | 2019/05/13 20:54:28.747089 | 24522 | 24548 |
| S190517h | BBH (98%) | 2019/05/17 05:51:01.830582 | 24570 | 24593 |
| S190519bj | BBH (96%) | 2019/05/19 15:35:44.397949 | 24598 | 24617 |
| S190521g | BBH (97%) | 2019/05/21 03:02:29.447266 | 24621, 24640 | 24648 |
| S190521r | BBH (>99%) | 2019/05/21 07:43:59.463379 | 24632 | 24649 |
| S190602aq | BBH (>99%) | 2019/06/02 17:59:27.089355 | 24717 | 24735 |
| S190630ag | BBH (94%) | 2019/06/30 18:52:05.179550 | 24922, 25094 | 24960 |
| S190701ah | BBH (93%) | 2019/07/01 20:33:06.577637 | 24950, 24987 | 24970 |
| S190706ai | BBH (99%) | 2019/07/06 22:26:41.344727 | 24998, 25049 | 25027 |
| S190707q | BBH (>99%) | 2019/07/07 09:33:26.181226 | 25012, 25048 | 25033 |
| S190718y | Terrestrial (98%) | 2019/07/18 14:35:12.067865 | 25087, 25107 | 25099 |
| S190720a | BBH (99%) | 2019/07/20 00:08:36.704102 | 25115, 25138 | 25134 |
| S190727h | BBH (92%) | 2019/07/27 06:03:33.985887 | 25164, 25249 | 25184 |
| S190728q | MassGap (52%) | 2019/07/28 06:45:10.529205 | 25187, 25208 | 25214 |
| S190814bv | NSBH (>99%) | 2019/08/14 21:10:39.012957 | 25324, 25333 | 25390 |
| Fermi GBM-190816 | subthreshold | 2019/08/16 21:22:13.027 | 25406 | ⋯ |
| S190828j | BBH (>99%) | 2019/08/28 06:34:05.756472 | 25497, 25504, 25861 | 25536 |
| S190828l | BBH (>99%) | 2019/08/28 06:55:09.886557 | 25503, 25782 | 25537 |
| S190901ap | BNS (86%) | 2019/09/01 23:31:01.837767 | 25606, 25614 | 25647 |
| S190910d | NSBH (98%) | 2019/09/10 01:26:19.242676 | 25695, 25723 | 25734 |
| S190910h | BNS (61%) | 2019/09/10 08:29:58.544448 | 25707, 25778 | 25735 |
| S190915ak | BBH (>99%) | 2019/09/15 23:57:02.690891 | 25753, 25773 | 25770 |
| S190923y | NSBH (68%) | 2019/09/23 12:55:59.645508 | 25814 | 25830 |
| S190924h | MassGap (>99%) | 2019/09/24 02:18:46.846654 | 25829, 25905, 25909 | 25844 |
| S190930s | MassGap (95%) | 2019/09/30 13:35:41.246810 | 25871, 25968 | 25891 |
| S190930t | NSBH (74%) | 2019/09/30 14:34:07.685342 | 25876 | 25892 |
| S191105e | BBH (95%) | 2019/11/05 14:35:21.933105 | 26182, 26245 | 26195 |
| S191109d | BBH (>99%) | 2019/11/09 01:07:17.220703 | 26202 | 26236 |
| S191129u | BBH (>99%) | 2019/11/29 13:40:29.197372 | 26303, 26383 | 26321 |
| S191204r | BBH (>99%) | 2019/12/04 17:15:26.091822 | 26334 | 26358 |
| S191205ah | NSBH (93%) | 2019/12/05 21:52:08.568738 | 26350 | 26377 |
| S191213g | BNS (77%) | 2019/12/13 04:34:08.142224 | 26402, 26417 | 26419 |
| S191215w | BBH (>99%) | 2019/12/15 22:30:52.333152 | 26441, 26518 | 26465 |
| S191216ap | BBH (>99%) | 2019/12/16 21:33:38.472999 | 26454, 26505, 26570 | 26481 |
| S191222n | BBH (>99%) | 2019/12/22 03:35:37.119478 | 26543, 26572 | 26602 |
| S200105ae | Terrestrial (97%) | 2020/01/05 16:24:26.057208 | 26640, 26688 | 26664 |
| S200112r | BBH (>99%) | 2020/01/12 15:58:38.093931 | 26715 | 26740 |
| S200114f | ⋯ | 2020/01/14 02:08:18.239300 | 26734 | 26761 |
| S200115j | MassGap (>99%) | 2020/01/15 04:23:09.742047 | 26759, 26807 | 26797 |
| S200128d | BBH (97%) | 2020/01/28 02:20:11.903320 | 26906 | 26924 |
| S200129m | BBH (>99%) | 2020/01/29 06:54:58.435104 | 26926 | 26941 |
| S200208q | BBH (>99%) | 2020/02/08 13:01:17.991118 | 27014, 27036 | 27030 |
| S200213t | BNS (63%) | 2020/02/13 04:10:40.327981 | 27042, 27092, 27096 | 27084 |
| S200219ac | BBH (96%) | 2020/02/19 09:44:15.195312 | 27130, 27214 | 27149 |
| S200224ca | BBH (>99%) | 2020/02/24 22:22:34.405762 | 27184, 27262 | 27231 |
| S200225q | BBH (96%) | 2020/02/25 06:04:21.396973 | 27193, 27229 | 27232 |
| S200302c | BBH (89%) | 2020/03/02 01:58:11.519119 | 27278, 27292 | 27299 |
| S200311bg | BBH (>99%) | 2020/03/11 11:58:53.397788 | 27358, 27382 | 27372 |
| S200316bj | MassGap (>99%) | 2020/03/16 21:57:56.157221 | 27388, 27419 | 27405 |
Download table as: ASCIITypeset image
3.1. CGBM Analysis
As of the end of 2021 November, CGBM has detected 271 GRBs, with 12% of the CGBM GRBs classified as short GRBs (Kawakubo et al. 2021). CGBM observations of the O3 events are summarized in Table 3. Here T0 is the time of the gravitational-wave event reported in GraceDB and listed in Table 2. Since the duty cycle of CGBM is ∼60% due mainly to passages through the SAA, CGBM high voltages were sometimes turned off at gravitational-wave trigger times. The high voltage status at the trigger time of each gravitational-wave event was recorded in the housekeeping data and the status of the high voltages is shown in Table 3 under the CGBM trigger. Here "disabled" means the onboard trigger system was disabled at T0 either because the CGBM high voltages were off or the CGBM event buffer was full. "No trigger" means the onboard trigger system was not triggered during the time interval T0 ± 60 s even if the onboard trigger system was enabled. The monitor data were inspected on the ground for each O3 event to confirm that no potential candidate event occurred within T0 ± 60 s. For each event, the summed LIGO/Virgo localization probability above the CGBM horizon was calculated using the LIGO/Virgo sky maps from GraceDB. If the summed LIGO/Virgo localization probability above the horizon was greater than 1%, a targeted signal search was then performed using the TH data. Light curves were constructed from the TH data for each CGBM detector with 0.125 s time binning in twenty energy bands for T0 − 60 s to T0 + 60 s. S/N was recalculated for each light curve with an expanded set of search parameters (Table 4) to search for a significant signal within T0 ± 60 s. In the ground analysis, ΔtBG was taken from both sides of Δt with one exception. In the case of the high voltage turning on or off within ±60 s of the trigger time, ΔtBG was taken only from the period when the high voltage was on. S/N was therefore calculated every 0.125 s for 1440 separate conditions summarized in Table 4.
Table 3. Summary of CGBM Observations for Gravitational-wave Events in O3
| Event Name | CGBM Trigger | Ph | Conditions | Conditions | Tmax | ||
|---|---|---|---|---|---|---|---|
| for | for | ||||||
| S190408an | No trigger | 100% | 4.70 | HXM2, Low, ch0-2 | 5.41 | HXM1, Low, ch2 | −37.61 |
| Δt = 4 s, ΔtBG = 16 s | Δt = 0.25 s, ΔtBG = 8 s | ||||||
| S190412m | Disabled | ⋯ | ⋯ | ⋯ | ⋯ | ⋯ | ⋯ |
| S190421ar | No trigger | 0% | ⋯ | ⋯ | ⋯ | ⋯ | ⋯ |
| S190425z | Disabled | ⋯ | ⋯ | ⋯ | ⋯ | ⋯ | ⋯ |
| S190426c | Disabled | ⋯ | ⋯ | ⋯ | ⋯ | ⋯ | ⋯ |
| S190503bf | Disabled | ⋯ | ⋯ | ⋯ | ⋯ | ⋯ | ⋯ |
| S190510g | No trigger | 16% | 3.95 | SGM, High, ch1-3 | 5.22 | HXM1, High, ch1 | −17.00 |
| Δt = 4 s, ΔtBG = 8 s | Δt = 0.125 s, ΔtBG = 64 s | ||||||
| S190512at | No trigger | 100% | 4.11 | SGM, High, ch0-3 | 5.22 | HXM2, High, ch3 | 28.96 |
| Δt = 4 s, ΔtBG = 8 s | Δt = 0.125 s, ΔtBG = 16 s | ||||||
| S190513bm | No trigger | 100% | 4.41 | HXM2, High, ch2-3 | 5.34 | SGM, Low, ch0-2 | 10.26 |
| Δt = 4 s, ΔtBG = 16 s | Δt = 4 s, ΔtBG = 8 s | ||||||
| S190517h | No trigger | 86% | 3.99 | HXM1, Low, ch0 | 5.47 | SGM, Low, ch2-3 | 4.04 |
| Δt = 1 s, ΔtBG = 8 s | Δt = 4 s, ΔtBG = 64 s | ||||||
| S190519bj | No trigger | 100% | 4.54 | HXM2, High, ch2 | 5.69 | HXM1, Low, ch0 | −7.15 |
| Δt = 4 s, ΔtBG = 8 s | Δt = 0.125 s, ΔtBG = 8 s | ||||||
| S190521g | Disabled | ⋯ | ⋯ | ⋯ | ⋯ | ⋯ | ⋯ |
| S190521r | Disabled | ⋯ | ⋯ | ⋯ | ⋯ | ⋯ | ⋯ |
| S190602aq | No trigger | 99% | 4.56 | HXM2, Low, ch1 | 5.22 | HXM2, High, ch3 | −41.01 |
| Δt = 4 s, ΔtBG = 8 s | Δt = 1 s, ΔtBG = 32 s | ||||||
| S190630ag | Disabled | ⋯ | ⋯ | ⋯ | ⋯ | ⋯ | ⋯ |
| S190701ah | No trigger | 19% | 4.80 | HXM2, Low, ch2 | 5.43 | HXM1, High, ch0 | −19.20 |
| Δt = 4 s, ΔtBG = 8 s | Δt = 0.125 s, ΔtBG = 16 s | ||||||
| S190706ai | Disabled | ⋯ | ⋯ | ⋯ | ⋯ | ⋯ | ⋯ |
| S190707q | No trigger | 76% | 3.87 | SGM, High, ch1-3 | 5.13 | HXM2, Low , ch2 | 10.60 |
| Δt = 4 s, ΔtBG = 32 s | Δt = 0.125 s, ΔtBG = 8 s | ||||||
| S190718y | No trigger | 22% | 3.54 | HXM2, Low, ch0 | 5.13 | HXM2, Low, ch3 | 20.22 |
| Δt = 4 s, ΔtBG = 8 s | Δt = 4 s, ΔtBG = 8 s | ||||||
| S190720a | Disabled | ⋯ | ⋯ | ⋯ | ⋯ | ⋯ | ⋯ |
| S190727h | No trigger | 14% | 4.04 | HXM1, High, ch2 | 5.66 | HXM2, Low, ch1 | −34.82 |
| Δt = 0.25 s, ΔtBG = 16 s | Δt = 0.25 s, ΔtBG = 8 s | ||||||
| S190728q | No trigger | 0% | ⋯ | ⋯ | ⋯ | ⋯ | ⋯ |
| S190814bv | Disabled | ⋯ | ⋯ | ⋯ | ⋯ | ⋯ | ⋯ |
| Fermi GBM-190816 | No trigger | 66% | 3.78 | HXM2, High ch1 | 5.25 | HXM1, Low, ch2 | −18.97 |
| Δt = 2 s, ΔtBG = 8 s | Δt = 1 s, ΔtBG = 8 s | ||||||
| S190828j | No trigger | 28% | 3.33 | HXM2, High, ch0-3 | 5.31 | HXM1, High, ch0-1 | 26.45 |
| Δt = 0.25 s, ΔtBG = 64 s | Δt = 4 s, ΔtBG = 8 s | ||||||
| S190828l | No trigger | 79% | 3.36 | SGM, Low, ch0 | 4.82 | HXM2, High, ch1-2 | −47.17 |
| Δt = 2 s, ΔtBG = 8 s | Δt = 0.25 s, ΔtBG = 8 s | ||||||
| S190901ap | Disabled | 82% | 3.94 | SGM, High, ch0-2 | 5.72 | SGM, Low, ch1 | 24.02 |
| Δt = 4 s, ΔtBG = 8 s | Δt = 4 s, ΔtBG = 8 s | ||||||
| S190910d | No trigger | 77% | 5.59 | HXM1, High, ch0-1 | 6.31 | HXM1, Low, ch1-3 | −42.07 |
| Δt = 4 s, ΔtBG = 8 s | Δt = 4 s, ΔtBG = 8 s | ||||||
| S190910h | No trigger | 78% | 3.84 | SGM, Low, ch1 | 6.57 | HXM1, Low, ch2 | 3.71 |
| Δt = 4 s, ΔtBG = 8 s | Δt = 0.25 s, ΔtBG = 8s | ||||||
| S190915ak | No trigger | 100% | 4.62 | HXM1, High, ch0 | 5.47 | HXM2, High, ch1-2 | 32.54 |
| Δt = 2 s, ΔtBG = 8 s | Δt = 0.125 s, ΔtBG = 64 s | ||||||
| S190923y | No trigger | 68% | 4.19 | HXM1, High, ch2 | 5.06 | HXM1, Low, ch0 | −58.31 |
| Δt = 4 s, ΔtBG = 8 s | Δt = 0.25 s, ΔtBG = 32 s | ||||||
| S190924h | Disabled | ⋯ | ⋯ | ⋯ | ⋯ | ⋯ | ⋯ |
| S190930s | No trigger | 100% | 3.26 | HXM2, High, ch2-3 | 5.37 | HXM2, High, ch0 | 30.15 |
| Δt = 0.5 s, ΔtBG = 16 s | Δt = 4 s, ΔtBG = 8 s | ||||||
| S190930t | No trigger | 74% | 3.86 | SGM, High, ch2-3 | 5.07 | HXM2, Low, ch2 | −37.62 |
| Δt = 4 s, ΔtBG = 8 s | Δt = 0.125 s, ΔtBG = 32 s | ||||||
| S191105e | Disabled | ⋯ | ⋯ | ⋯ | ⋯ | ⋯ | ⋯ |
| S191109d | Disabled | ⋯ | ⋯ | ⋯ | ⋯ | ⋯ | ⋯ |
| S191129u | No trigger | 70% | 3.23 | HXM2, High, ch0-1 | 4.65 | HXM2, Low, ch0 | 32.93 |
| Δt = 4 s, ΔtBG = 8 s | Δt = 0.5 s, ΔtBG = 8 s | ||||||
| S191204r | No trigger | 4% | 4.19 | HXM1, High, ch1 | 5.19 | SGM, Low, ch0 | −5.95 |
| Δt = 4 s, ΔtBG = 8 s | Δt = 0.125 s, ΔtBG = 8 s | ||||||
| S191205ah | Disabled | ⋯ | ⋯ | ⋯ | ⋯ | ⋯ | ⋯ |
| S191213g | No trigger | 71% | 4.36 | HXM2, Low, ch0-3 | 5.53 | SGM, High, ch3 | 57.89 |
| Δt = 4 s, ΔtBG = 8 s | Δt = 2 s, ΔtBG = 8 s | ||||||
| S191215w | No trigger | 83% | 3.85 | HXM1, High, ch1-3 | 6.12 | HXM2, High, ch0 | 59.86 |
| Δt = 4 s, ΔtBG = 8 s | Δt = 0.125 s, ΔtBG = 8 s | ||||||
| S191216ap | No trigger | 40% | 2.68 | HXM1, Low, ch2 | 5.46 | HXM2, Low, ch1 | 19.65 |
| Δt = 4 s, ΔtBG = 8 s | Δt = 0.25 s, ΔtBG = 8 s | ||||||
| S191222n | No trigger | 60% | 3.02 | HXM1, Low, ch2 | 5.59 | HXM1, Low, ch2-3 | −44.56 |
| Δt = 1 s, ΔtBG = 8 s | Δt = 2 s, ΔtBG = 8 s | ||||||
| S200105ae | No trigger | 67% | 3.73 | HXM2, Low, ch0-3 | 5.85 | SGM, High, ch3 | 44.79 |
| Δt = 4 s, ΔtBG = 64 s | Δt = 2 s, ΔtBG = 64 s | ||||||
| S200112r | No trigger | 67% | 4.36 | HXM2, Low, ch1-3 | 7.16 | HXM2, High, ch0 | −1.41 |
| Δt = 4 s, ΔtBG = 8 s | Δt = 0.125 s, ΔtBG = 64 s | ||||||
| S200114f | Disabled | ⋯ | ⋯ | ⋯ | ⋯ | ⋯ | ⋯ |
| S200115j | Disabled | ⋯ | ⋯ | ⋯ | ⋯ | ⋯ | ⋯ |
| S200128d | No trigger | 60% | 3.31 | HXM2, Low, ch1 | 5.59 | HXM2, Low, ch1 | −1.29 |
| Δt = 4 s, ΔtBG = 8 s | Δt = 0.5 s, ΔtBG = 8 s | ||||||
| S200129m | Disabled | ⋯ | ⋯ | ⋯ | ⋯ | ⋯ | ⋯ |
| S200208q | Disabled | ⋯ | ⋯ | ⋯ | ⋯ | ⋯ | ⋯ |
| S200213t | No trigger | 18% | 4.26 | HXM2, High, ch2 | 5.27 | HXM2, High, ch3 | 20.24 |
| Δt = 4 s, ΔtBG = 16 s | Δt = 0.125 s, ΔtBG = 16 s | ||||||
| S200219ac | No trigger | 71% | 4.86 | HXM1, High, ch1-3 | 5.55 | HXM2, High, ch0 | 20.04 |
| Δt = 4 s, ΔtBG = 64 s | Δt = 0.125 s, ΔtBG = 32 s | ||||||
| S200224ca | Disabled | ⋯ | ⋯ | ⋯ | ⋯ | ⋯ | ⋯ |
| S200225q | Disabled | ⋯ | ⋯ | ⋯ | ⋯ | ⋯ | ⋯ |
| S200302c | No trigger | 81% | 3.78 | HXM1, Low, ch0 | 5.36 | HXM2, Low, ch0 | 3.56 |
| Δt = 4 s, ΔtBG = 8 s | Δt = 1 s, ΔtBG = 16 s | ||||||
| S200311bg | Disabled | ⋯ | ⋯ | ⋯ | ⋯ | ⋯ | |
| S200316bj | No trigger | 90% | 3.08 | HXM2, Low, ch0 | 5.34 | HXM1, Low, ch0 | 12.51 |
| Δt = 0.25 s, ΔtBG = 8 s | Δt = 0.125 s, ΔtBG = 8 s |


Table 4. Conditions for S/N Calculation
| Number of Conditions | Conditions | |
|---|---|---|
| Detector | 3 | HXM1, HXM2, SGM |
| Gain | 2 | High, Low |
| Channels | 10 | ch0, ch1, ch2, ch3, ch0-1, ch1-2, ch2-3, ch0-2, ch1-3, ch0-3 |
| Δt | 6 | 1/8 s, 1/4 s, 1/2 s, 1 s, 2 s, 4 s |
| ΔtBG | 4 | 8 s, 16 s, 32 s, 64 s |
Download table as: ASCIITypeset image
in Table 3 shows the highest S/N from the set of S/Ns calculated for all conditions such that the foreground intervals Δt include T0. "Conditions for " shows the conditions resulting in . shows the highest S/N calculated for all conditions in T0 ± 60 s. "Conditions for " shows the conditions corresponding to . Finally, Tmax is the start time of the foreground interval relative to T0 when the S/N was equal to .


Background varies over an orbit mainly due to the variation of the trapped charged particle flux and activity of bright X-ray sources in the field of view. Since the estimation of background counts in the S/N calculation is based on the summation of the observed counts before and after the foreground time interval, estimated background counts during Δt are sometimes underestimated or overestimated depending on the background variation during the orbit, affecting the calculated S/Ns. The distribution of S/Ns is not described by a normal distribution. As an example, Figure 8 shows the distribution of S/Ns calculated using SGM high-gain data for one day. The histogram includes S/Ns calculated every 0.125 s continuously with all conditions and gain settings. Individual bins are therefore not independent of each other. As seen in the figure, the distribution extends up to S/N ∼ 7. On this particular day, a small tail is present at high S/N due to an increased counting rate in two successive orbits at high latitude. Including this contribution of high S/N events due to low-energy charged particles, the fraction of events with S/N > 7 is 1.6 × 10⁻⁷. We set the threshold for the off-line trigger at S/N = 7 and require that candidate events show up in multiple detectors (HXM1, HXM2, and SGM) and multiple energy channels, that the event arrival time falls within T0 ± 60 s, and that CAL CHD and IMC see no simultaneous increase in the low-energy charged particle rate.

Figure 8. Histogram of S/Ns calculated for SGM high-gain data for 2019 October 1. Vertical dashed lines correspond to (from left to right) 68th percentile, 90th percentile, 99th percentile, 7σ, and 8.5σ.
Download figure:
Standard image High-resolution imageAs a check on the reasonableness of these event selection criteria, we have performed a search for events simulating gravitational-wave counterparts by searching for events either one orbit prior to or one orbit after the times of the 57 events listed in Table 2—i.e., at times and positions where the instrument is at approximately the same latitude and in approximately the same pointing direction as at the time of the actual gravitational-wave event. One event was seen with S/N = 7.13, but only in HXM2—i.e., no multichannel events were found that successfully masqueraded as candidate CGBM counterpart events.
In the time windows T0 ± 60 s corresponding to real LIGO/Virgo events, one LIGO/Virgo event (S200112r) was found with a nearby CGBM S/N > 7 (Figure 9). In this case, the time of highest S/N (Tmax) was T0 − 1.41 s. However, the signal can be seen in only the lowest energy channel of HXM2; HXM1 and SGM detected no significant signal. We conclude that this signal is likely a random fluctuation and not likely to be physically associated with S200112r.

Figure 9. Time histories of counts detected by CGBM within ±60 s of LIGO/Virgo event S200112r. Dashed lines show time T0 − 1.41 prior to LIGO/Virgo event S200112r. CGBM signal excess is seen only in the lowest energy channel of HXM2.
Download figure:
Standard image High-resolution imageSince no acceptable GRB candidate associated with any of the LIGO/Virgo GW events was found in the CGBM data, we estimated upper limits for the X-ray/gamma-ray flux. For each GW event, we simulated typical GRB spectra in the TH data using the "fakeit" command of XSPEC version 12.10.1 44 (Bambi & Nampalliwar 2020) assuming typical spectra and durations for short GRBs. We used the CGBM response matrix database which includes CGBM response files calculated for 5° pitch in zenith angle and azimuth. For the assumed input spectrum, we used a Band function and a power law with exponential cutoff and standard values for photon indices and Epeak characteristic of short GRBs: For the Band function, we used α = −0.46, β = −2.98, and Epeak = 413 keV (Poolakkil et al. 2021) and for the cutoff power law we used α = −0.42 and Epeak = 566 keV (Goldstein et al. 2017; Racusin et al. 2017). We assume a burst duration of 1 s. Based on the LIGO/Virgo sky maps, we took the direction of the source to be that direction within the CGBM field of view for which the localization probability was maximum and applied the relevant CGBM response matrices. Tables 5–7 show the resulting time-averaged flux upper limits at the level of 7σ calculated separately for HXM1, HXM2, and SGM in the 10 keV–1 MeV energy range. Here P corresponds to the summed probability in the field of view of each detector (HXM1, HXM2, or SGM), α and δ are the highest probability directions in Equatorial coordinates of the GW sources in the field of view of each detector, and θ and ϕ are the zenith and azimuth angles of incident photons striking the detector from the direction of the GW source. (Since the CGBM angular response is calculated on a 5° grid, θ and ϕ are tabulated with 5° precision).
Table 5. Summary of CGBM/HXM1 Upper Limits for Gravitational-wave Events in O3
| Event Name | PHXM1 | α(deg) | δ(deg) | θ(deg) | ϕ (deg) | 7σ Upper Limit | 7σ Upper Limit |
|---|---|---|---|---|---|---|---|
| (erg cm−2 s−1) | (erg cm−2 s−1) | ||||||
| (Band Function) | (Cutoff Power Law) | ||||||
| S190408an | 99% | 351.0 | 53.9 | 45 | 305 | 9.7 × 10⁻⁷ | 1.2 × 10⁻⁶ |
| S190412m | ⋯ | ⋯ | ⋯ | ⋯ | ⋯ | ⋯ | ⋯ |
| S190421ar | 0% | ⋯ | ⋯ | ⋯ | ⋯ | ⋯ | ⋯ |
| S190425z | ⋯ | ⋯ | ⋯ | ⋯ | ⋯ | ⋯ | ⋯ |
| S190426c | ⋯ | ⋯ | ⋯ | ⋯ | ⋯ | ⋯ | ⋯ |
| S190503bf | ⋯ | ⋯ | ⋯ | ⋯ | ⋯ | ⋯ | ⋯ |
| S190510g | 2% | 250.3 | 15.7 | 50 | 125 | 1.9 × 10⁻⁶ | 2.3 × 10⁻⁶ |
| S190512at | 2% | 227.8 | −4.2 | 45 | 155 | 1.4 × 10⁻⁶ | 1.6 × 10⁻⁶ |
| S190513bm | 55% | 52.5 | 47.9 | 70 | 10 | 1.9 × 10⁻⁶ | 2.3 × 10⁻⁶ |
| S190517h | 0% | ⋯ | ⋯ | ⋯ | ⋯ | ⋯ | ⋯ |
| S190519bj | 3% | 358.2 | 51.4 | 65 | 325 | 1.8 × 10⁻⁶ | 2.1 × 10⁻⁶ |
| S190521g | ⋯ | ⋯ | ⋯ | ⋯ | ⋯ | ⋯ | ⋯ |
| S190521r | ⋯ | ⋯ | ⋯ | ⋯ | ⋯ | ⋯ | ⋯ |
| S190602aq | 5% | 92.8 | 8.9 | 45 | 100 | 1.4 × 10⁻⁶ | 1.7 × 10⁻⁶ |
| S190630ag | ⋯ | ⋯ | ⋯ | ⋯ | ⋯ | ⋯ | ⋯ |
| S190701ah | 0% | ⋯ | ⋯ | ⋯ | ⋯ | ⋯ | ⋯ |
| S190706ai | ⋯ | ⋯ | ⋯ | ⋯ | ⋯ | ⋯ | ⋯ |
| S190707q | 25% | 311.7 | 38.3 | 60 | 260 | 1.8 × 10⁻⁶ | 2.2 × 10⁻⁶ |
| S190718y | 9% | 138.1 | −31.0 | 55 | 255 | 1.6 × 10⁻⁶ | 1.9 × 10⁻⁶ |
| S190720a | ⋯ | ⋯ | ⋯ | ⋯ | ⋯ | ⋯ | ⋯ |
| S190727h | 0% | ⋯ | ⋯ | ⋯ | ⋯ | ⋯ | ⋯ |
| S190728q | 0% | ⋯ | ⋯ | ⋯ | ⋯ | ⋯ | ⋯ |
| S190814bv | ⋯ | ⋯ | ⋯ | ⋯ | ⋯ | ⋯ | ⋯ |
| Fermi GBM-190816 | 32% | 183.9 | 26.6 | 40 | 115 | 1.1 × 10⁻⁶ | 1.3 × 10⁻⁶ |
| S190828j | 4% | 342.3 | 52.9 | 50 | 330 | 9.5 × 10⁻⁷ | 1.2 × 10⁻⁶ |
| S190828l | 1% | 83.8 | 45.7 | 15 | 105 | 1.0 × 10⁻⁶ | 1.3 × 10⁻⁶ |
| S190901ap | 4% | 276.7 | 37.2 | 70 | 0 | 1.8 × 10⁻⁶ | 2.2 × 10⁻⁶ |
| S190910d | 0% | ⋯ | ⋯ | ⋯ | ⋯ | ⋯ | ⋯ |
| S190910h | 15% | 232.0 | −21.4 | 65 | 55 | 1.6 × 10⁻⁶ | 2.0 × 10⁻⁶ |
| S190915ak | 0% | ⋯ | ⋯ | ⋯ | ⋯ | ⋯ | ⋯ |
| S190923y | 14% | 113.6 | 32.3 | 65 | 355 | 1.6 × 10⁻⁶ | 1.9 × 10⁻⁶ |
| S190924h | ⋯ | ⋯ | ⋯ | ⋯ | ⋯ | ⋯ | ⋯ |
| S190930s | 11% | 328.2 | 3.6 | 55 | 130 | 1.6 × 10⁻⁶ | 1.9 × 10⁻⁶ |
| S190930t | 11% | 144.1 | 37.2 | 70 | 15 | 2.0 × 10⁻⁶ | 2.4 × 10⁻⁶ |
| S191105e | ⋯ | ⋯ | ⋯ | ⋯ | ⋯ | ⋯ | ⋯ |
| S191109d | ⋯ | ⋯ | ⋯ | ⋯ | ⋯ | ⋯ | ⋯ |
| S191129u | 0% | ⋯ | ⋯ | ⋯ | ⋯ | ⋯ | ⋯ |
| S191204r | 2% | 218.1 | 66.0 | 45 | 345 | 1.1 × 10⁻⁶ | 1.3 × 10⁻⁶ |
| S191205ah | ⋯ | ⋯ | ⋯ | ⋯ | ⋯ | ⋯ | ⋯ |
| S191213g | 11% | 87.4 | −8.6 | 65 | 310 | 1.7 × 10⁻⁶ | 2.0 × 10⁻⁶ |
| S191215w | 0% | ⋯ | ⋯ | ⋯ | ⋯ | ⋯ | ⋯ |
| S191216ap | 0% | ⋯ | ⋯ | ⋯ | ⋯ | ⋯ | ⋯ |
| S191222n | 5% | 37.3 | 20.6 | 70 | 340 | 1.9 × 10⁻⁶ | 2.3 × 10⁻⁶ |
| S200105ae | 47% | 53.8 | −18.8 | 10 | 295 | 9.1 × 10⁻⁷ | 1.1 × 10⁻⁶ |
| S200112r | 6% | 101.2 | 23.2 | 20 | 185 | 9.7 × 10⁻⁷ | 1.2 × 10⁻⁶ |
| S200114f | ⋯ | ⋯ | ⋯ | ⋯ | ⋯ | ⋯ | ⋯ |
| S200115j | ⋯ | ⋯ | ⋯ | ⋯ | ⋯ | ⋯ | ⋯ |
| S200128d | 22% | 64.7 | 36.2 | 55 | 105 | 1.5 × 10⁻⁶ | 1.8 × 10⁻⁶ |
| S200129m | ⋯ | ⋯ | ⋯ | ⋯ | ⋯ | ⋯ | ⋯ |
| S200208q | ⋯ | ⋯ | ⋯ | ⋯ | ⋯ | ⋯ | ⋯ |
| S200213t | 4% | 180.1 | −37.9 | 60 | 280 | 1.5 × 10⁻⁶ | 1.8 × 10⁻⁶ |
| S200219ac | 18% | 185.1 | 56.5 | 60 | 25 | 1.6 × 10⁻⁶ | 1.9 × 10⁻⁶ |
| S200224ca | ⋯ | ⋯ | ⋯ | ⋯ | ⋯ | ⋯ | ⋯ |
| S200225q | ⋯ | ⋯ | ⋯ | ⋯ | ⋯ | ⋯ | ⋯ |
| S200302c | 22% | 36.7 | 69.1 | 55 | 340 | 1.5 × 10⁻⁶ | 1.8 × 10⁻⁶ |
| S200311bg | ⋯ | ⋯ | ⋯ | ⋯ | ⋯ | ⋯ | ⋯ |
| S200316bj | 13% | 90.0 | 46.5 | 35 | 45 | 1.0 × 10⁻⁶ | 1.3 × 10⁻⁶ |
Download table as: ASCIITypeset image
Table 6. Summary of CGBM/HXM2 Upper Limits for Gravitational-wave Events in O3
| Event Name | PHXM2 | α(deg) | δ(deg) | θ (deg) | ϕ (deg) | 7σ Upper Limit | 7σ Upper Limit |
|---|---|---|---|---|---|---|---|
| (erg cm−2 s−1) | (erg cm−2 s−1) | ||||||
| (Band function) | (Cutoff Power Law) | ||||||
| S190408an | 99% | 351.0 | 53.9 | 45 | 305 | 1.2 × 10⁻⁶ | 1.5 × 10⁻⁶ |
| S190412m | ⋯ | ⋯ | ⋯ | ⋯ | ⋯ | ⋯ | ⋯ |
| S190421ar | 0% | ⋯ | ⋯ | ⋯ | ⋯ | ⋯ | ⋯ |
| S190425z | ⋯ | ⋯ | ⋯ | ⋯ | ⋯ | ⋯ | ⋯ |
| S190426c | ⋯ | ⋯ | ⋯ | ⋯ | ⋯ | ⋯ | ⋯ |
| S190503bf | ⋯ | ⋯ | ⋯ | ⋯ | ⋯ | ⋯ | ⋯ |
| S190510g | 2% | 250.3 | 15.7 | 50 | 125 | 1.7 × 10⁻⁶ | 2.0 × 10⁻⁶ |
| S190512at | 1% | 226.8 | −5.1 | 45 | 155 | 1.6 × 10⁻⁶ | 1.9 × 10⁻⁶ |
| S190513bm | 55% | 52.5 | 47.9 | 70 | 10 | 1.7 × 10⁻⁶ | 2.0 × 10⁻⁶ |
| S190517h | 0% | ⋯ | ⋯ | ⋯ | ⋯ | ⋯ | ⋯ |
| S190519bj | 3% | 359.9 | 53.7 | 65 | 330 | 1.8 × 10⁻⁶ | 2.2 × 10⁻⁶ |
| S190521g | ⋯ | ⋯ | ⋯ | ⋯ | ⋯ | ⋯ | ⋯ |
| S190521r | ⋯ | ⋯ | ⋯ | ⋯ | ⋯ | ⋯ | ⋯ |
| S190602aq | 5% | 92.8 | 8.9 | 45 | 100 | 1.5 × 10⁻⁶ | 1.8 × 10⁻⁶ |
| S190630ag | ⋯ | ⋯ | ⋯ | ⋯ | ⋯ | ⋯ | ⋯ |
| S190701ah | 0% | ⋯ | ⋯ | ⋯ | ⋯ | ⋯ | ⋯ |
| S190706ai | ⋯ | ⋯ | ⋯ | ⋯ | ⋯ | ⋯ | ⋯ |
| S190707q | 26% | 311.7 | 38.3 | 60 | 260 | 2.0 × 10⁻⁶ | 2.4 × 10⁻⁶ |
| S190718y | 9% | 138.1 | −31.0 | 55 | 255 | 1.5 × 10⁻⁶ | 1.8 × 10⁻⁶ |
| S190720a | ⋯ | ⋯ | ⋯ | ⋯ | ⋯ | ⋯ | ⋯ |
| S190727h | 0% | ⋯ | ⋯ | ⋯ | ⋯ | ⋯ | ⋯ |
| S190728q | 0% | ⋯ | ⋯ | ⋯ | ⋯ | ⋯ | ⋯ |
| S190814bv | ⋯ | ⋯ | ⋯ | ⋯ | ⋯ | ⋯ | ⋯ |
| Fermi GBM-190816 | 34% | 183.9 | 26.6 | 40 | 115 | 1.0 × 10⁻⁶ | 1.2 × 10⁻⁶ |
| S190828j | 4% | 339.6 | 51.2 | 50 | 335 | 1.1 × 10⁻⁶ | 1.3 × 10⁻⁶ |
| S190828l | 1% | 83.8 | 45.7 | 15 | 105 | 1.1 × 10⁻⁶ | 1.4 × 10⁻⁶ |
| S190901ap | 5% | 277.4 | 33.5 | 70 | 5 | 1.7 × 10⁻⁶ | 2.0 × 10⁻⁶ |
| S190910d | 0% | ⋯ | ⋯ | ⋯ | ⋯ | ⋯ | ⋯ |
| S190910h | 16% | 232.0 | −24.0 | 65 | 60 | 1.8 × 10⁻⁶ | 2.2 × 10⁻⁶ |
| S190915ak | 0% | ⋯ | ⋯ | ⋯ | ⋯ | ⋯ | ⋯ |
| S190923y | 16% | 111.6 | 31.0 | 65 | 355 | 1.6 × 10⁻⁶ | 1.9 × 10⁻⁶ |
| S190924h | ⋯ | ⋯ | ⋯ | ⋯ | ⋯ | ⋯ | ⋯ |
| S190930s | 12% | 328.2 | 0.6 | 55 | 135 | 1.6 × 10⁻⁶ | 2.0 × 10⁻⁶ |
| S190930t | 12% | 144.8 | 36.4 | 70 | 15 | 1.7 × 10⁻⁶ | 2.0 × 10⁻⁶ |
| S191105e | ⋯ | ⋯ | ⋯ | ⋯ | ⋯ | ⋯ | ⋯ |
| S191109d | ⋯ | ⋯ | ⋯ | ⋯ | ⋯ | ⋯ | ⋯ |
| S191129u | 0% | ⋯ | ⋯ | ⋯ | ⋯ | ⋯ | ⋯ |
| S191204r | 3% | 219.3 | 65.5 | 45 | 345 | 1.1 × 10⁻⁶ | 1.3 × 10⁻⁶ |
| S191205ah | ⋯ | ⋯ | ⋯ | ⋯ | ⋯ | ⋯ | ⋯ |
| S191213g | 11% | 87.4 | −8.6 | 65 | 310 | 1.7 × 10⁻⁶ | 2.0 × 10⁻⁶ |
| S191215w | 0% | ⋯ | ⋯ | ⋯ | ⋯ | ⋯ | ⋯ |
| S191216ap | 0% | ⋯ | ⋯ | ⋯ | ⋯ | ⋯ | ⋯ |
| S191222n | 5% | 37.3 | 20.6 | 70 | 340 | 1.8 × 10⁻⁶ | 2.1 × 10⁻⁶ |
| S200105ae | 52% | 53.8 | −18.8 | 10 | 295 | 1.0 × 10⁻⁶ | 1.2 × 10⁻⁶ |
| S200112r | 8% | 109.7 | 15.6 | 35 | 190 | 1.2 × 10⁻⁶ | 1.4 × 10⁻⁶ |
| S200114f | ⋯ | ⋯ | ⋯ | ⋯ | ⋯ | ⋯ | ⋯ |
| S200115j | ⋯ | ⋯ | ⋯ | ⋯ | ⋯ | ⋯ | ⋯ |
| S200128d | 23% | 62.6 | 34.0 | 55 | 105 | 1.3 × 10⁻⁶ | 1.6 × 10⁻⁷ |
| S200129m | ⋯ | ⋯ | ⋯ | ⋯ | ⋯ | ⋯ | ⋯ |
| S200208q | ⋯ | ⋯ | ⋯ | ⋯ | ⋯ | ⋯ | ⋯ |
| S200213t | 5% | 180.1 | −37.9 | 60 | 280 | 1.5 × 10⁻⁶ | 1.8 × 10⁻⁶ |
| S200219ac | 19% | 185.1 | 56.5 | 60 | 25 | 1.5 × 10⁻⁶ | 1.8 × 10⁻⁶ |
| S200224ca | ⋯ | ⋯ | ⋯ | ⋯ | ⋯ | ⋯ | ⋯ |
| S200225q | ⋯ | ⋯ | ⋯ | ⋯ | ⋯ | ⋯ | ⋯ |
| S200302c | 22% | 36.7 | 69.1 | 55 | 340 | 1.5 × 10⁻⁶ | 1.8 × 10⁻⁶ |
| S200311bg | ⋯ | ⋯ | ⋯ | ⋯ | ⋯ | ⋯ | ⋯ |
| S200316bj | 14% | 85.3 | 49.9 | 40 | 35 | 1.1 × 10⁻⁶ | 1.4 × 10⁻⁶ |
Download table as: ASCIITypeset image
Table 7. Summary of CGBM/SGM Upper Limits for Gravitational-wave Events in O3
| Event Name | PSGM | α (deg) | δ (deg) | θ (deg) | ϕ (deg) | 7σ Upper Limit | 7σ Upper Limit |
|---|---|---|---|---|---|---|---|
| (erg cm−2 s−1) | (erg cm−2 s−1) | ||||||
| (Band Function) | (Cutoff Power Law) | ||||||
| S190408an | 100% | 351.0 | 53.9 | 45 | 305 | 8.2 × 10⁻⁷ | 9.3 × 10⁻⁷ |
| S190412m | ⋯ | ⋯ | ⋯ | ⋯ | ⋯ | ⋯ | ⋯ |
| S190421ar | 0% | ⋯ | ⋯ | ⋯ | ⋯ | ⋯ | ⋯ |
| S190425z | ⋯ | ⋯ | ⋯ | ⋯ | ⋯ | ⋯ | ⋯ |
| S190426c | ⋯ | ⋯ | ⋯ | ⋯ | ⋯ | ⋯ | ⋯ |
| S190503bf | ⋯ | ⋯ | ⋯ | ⋯ | ⋯ | ⋯ | ⋯ |
| S190510g | 4% | 205.3 | 0.6 | 90 | 100 | 1.2 × 10⁻⁶ | 1.3 × 10⁻⁶ |
| S190512at | 3% | 228.2 | −5.1 | 45 | 155 | 8.7 × 10⁻⁷ | 1.0 × 10⁻⁶ |
| S190513bm | 76% | 52.6 | 47.8 | 70 | 5 | 1.0 × 10⁻⁶ | 1.2 × 10⁻⁶ |
| S190517h | 0% | ⋯ | ⋯ | ⋯ | ⋯ | ⋯ | ⋯ |
| S190519bj | 8% | 355.3 | 48.2 | 65 | 320 | 1.1 × 10⁻⁶ | 1.2 × 10⁻⁶ |
| S190521g | ⋯ | ⋯ | ⋯ | ⋯ | ⋯ | ⋯ | ⋯ |
| S190521r | ⋯ | ⋯ | ⋯ | ⋯ | ⋯ | ⋯ | ⋯ |
| S190602aq | 21% | 72.6 | −10.7 | 75 | 95 | 1.1 × 10⁻⁶ | 1.3 × 10⁻⁶ |
| S190630ag | ⋯ | ⋯ | ⋯ | ⋯ | ⋯ | ⋯ | ⋯ |
| S190701ah | 0% | ⋯ | ⋯ | ⋯ | ⋯ | ⋯ | ⋯ |
| S190706ai | ⋯ | ⋯ | ⋯ | ⋯ | ⋯ | ⋯ | ⋯ |
| S190707q | 48% | 175.4 | −48.3 | 90 | 85 | 9.5 × 10⁻⁷ | 1.1 × 10⁻⁶ |
| S190718y | 14% | 137.1 | −29.4 | 55 | 250 | 7.8 × 10⁻⁷ | 8.9 × 10⁻⁷ |
| S190720a | ⋯ | ⋯ | ⋯ | ⋯ | ⋯ | ⋯ | ⋯ |
| S190727h | 8% | 353.7 | 52.3 | 85 | 300 | 1.3 × 10⁻⁶ | 1.5 × 10⁻⁶ |
| S190728q | 0% | ⋯ | ⋯ | ⋯ | ⋯ | ⋯ | ⋯ |
| S190814bv | ⋯ | ⋯ | ⋯ | ⋯ | ⋯ | ⋯ | ⋯ |
| Fermi GBM-190816 | 36% | 183.9 | 26.6 | 40 | 115 | 8.7 × 10⁻⁷ | 9.9 × 10⁻⁷ |
| S190828j | 4% | 344.0 | 54.3 | 50 | 330 | 8.5 × 10⁻⁷ | 9.7 × 10⁻⁷ |
| S190828l | 3% | 348.0 | 32.0 | 80 | 55 | 1.2 × 10⁻⁶ | 1.4 × 10⁻⁶ |
| S190901ap | 20% | 257.7 | 20.1 | 90 | 15 | 1.3 × 10⁻⁶ | 1.5 × 10⁻⁶ |
| S190910d | 1% | 340.7 | 54.9 | 85 | 75 | 9.5 × 10⁻⁷ | 1.1 × 10⁻⁶ |
| S190910h | 26% | 220.1 | −22.0 | 75 | 55 | 9.8 × 10⁻⁷ | 1.1 × 10⁻⁶ |
| S190915ak | 0% | ⋯ | ⋯ | ⋯ | ⋯ | ⋯ | ⋯ |
| S190923y | 26% | 103.9 | 24.6 | 55 | 350 | 8.7 × 10⁻⁷ | 9.9 × 10⁻⁷ |
| S190924h | ⋯ | ⋯ | ⋯ | ⋯ | ⋯ | ⋯ | ⋯ |
| S190930s | 37% | 322.5 | 48.5 | 70 | 85 | 9.5 × 10⁻⁷ | 1.1 × 10⁻⁶ |
| S190930t | 22% | 136.4 | 30.7 | 80 | 15 | 1.5 × 10⁻⁶ | 1.7 × 10⁻⁶ |
| S191105e | ⋯ | ⋯ | ⋯ | ⋯ | ⋯ | ⋯ | ⋯ |
| S191109d | ⋯ | ⋯ | ⋯ | ⋯ | ⋯ | ⋯ | ⋯ |
| S191129u | 4% | 201.8 | 41.7 | 85 | 20 | 1.4 × 10⁻⁶ | 1.6 × 10⁻⁶ |
| S191204r | 2% | 200.7 | 38.3 | 55 | 20 | 9.0 × 10⁻⁷ | 1.0 × 10⁻⁶ |
| S191205ah | ⋯ | ⋯ | ⋯ | ⋯ | ⋯ | ⋯ | ⋯ |
| S191213g | 35% | 106.0 | 0.1 | 85 | 320 | 1.4 × 10⁻⁶ | 1.5 × 10⁻⁶ |
| S191215w | 55% | 325.8 | 20.1 | 85 | 265 | 1.2 × 10⁻⁶ | 1.4 × 10⁻⁶ |
| S191216ap | 4% | 299.0 | 57.1 | 90 | 275 | 3.2 × 10⁻⁶ | 3.3 × 10⁻⁶ |
| S191222n | 14% | 54.3 | 39.1 | 85 | 355 | 1.2 × 10⁻⁶ | 1.4 × 10⁻⁶ |
| S200105ae | 50% | 53.8 | −18.8 | 10 | 295 | 9.3 × 10⁻⁷ | 1.1 × 10⁻⁶ |
| S200112r | 16% | 260.1 | 50.8 | 90 | 315 | 9.6 × 10⁻⁷ | 1.1 × 10⁻⁶ |
| S200114f | ⋯ | ⋯ | ⋯ | ⋯ | ⋯ | ⋯ | ⋯ |
| S200115j | ⋯ | ⋯ | ⋯ | ⋯ | ⋯ | ⋯ | ⋯ |
| S200128d | 25% | 64.3 | 35.9 | 55 | 105 | 8.1 × 10⁻⁷ | 9.2 × 10⁻⁷ |
| S200129m | ⋯ | ⋯ | ⋯ | ⋯ | ⋯ | ⋯ | ⋯ |
| S200208q | ⋯ | ⋯ | ⋯ | ⋯ | ⋯ | ⋯ | ⋯ |
| S200213t | 7% | 180.4 | −37.6 | 60 | 280 | 7.4 × 10⁻⁷ | 8.4 × 10⁻⁷ |
| S200219ac | 20% | 185.1 | 56.5 | 60 | 25 | 1.1 × 10⁻⁶ | 1.2 × 10⁻⁶ |
| S200224ca | ⋯ | ⋯ | ⋯ | ⋯ | ⋯ | ⋯ | ⋯ |
| S200225q | ⋯ | ⋯ | ⋯ | ⋯ | ⋯ | ⋯ | ⋯ |
| S200302c | 35% | 36.7 | 69.1 | 55 | 340 | 9.4 × 10⁻⁷ | 1.1 × 10⁻⁶ |
| S200311bg | ⋯ | ⋯ | ⋯ | ⋯ | ⋯ | ⋯ | ⋯ |
| S200316bj | 14% | 90.0 | 46.5 | 35 | 45 | 8.3 × 10⁻⁷ | 9.5 × 10⁻⁷ |
Download table as: ASCIITypeset image
3.2. CAL Analysis
Results of the CAL observations of the 57 events reported by LIGO/Virgo for O3 are shown in Table 8. Of the 57 events, 20 were in the CAL field of view. Of those, 13 occurred while CAL was in HE mode and seven occurred when CAL was in LEG mode. In no case did CAL detect any events from the allowed region within ±60 s of the LIGO/Virgo T0. The pointing direction of the center of the CAL field of view is given in the columns labeled α and δ. "Coverage" is the fraction of the overlapping region of the LIGO/Virgo localization map covered by the CAL field of view during the interval T0 ± 60 s.
Table 8. Summary of CAL Observations for Gravitational-wave Events in O3
| Event Name | α(deg) | δ (deg) | Coverage | Run Mode | 90% Upper Limit |
|---|---|---|---|---|---|
| (erg cm−2 s−1) | |||||
| S190408an | 352.9 | 8.4 | 95% | LEG | 3.0 × 10⁻⁷ |
| S190412m | ⋯ | ⋯ | ⋯ | ⋯ | ⋯ |
| S190421ar | 326.6 | 42.3 | 0% | ⋯ | ⋯ |
| S190425z | 131.4 | −43.7 | 10% | HE | 8.5 × 10⁻⁵ |
| S190426c | 183.1 | −50.9 | 10% | HE | 9.2 × 10⁻⁶ |
| S190503bf | 169.1 | −45.5 | 25% | HE | 7.1 × 10⁻⁵ |
| S190510g | 295.8 | 50.8 | 0% | ⋯ | ⋯ |
| S190512at | 214.9 | 37.8 | 0% | ⋯ | ⋯ |
| S190513bm | 348.0 | 4.3 | 15% | LEG | 4.5 × 10⁻⁵ |
| S190517h | 125.9 | −31.5 | 0% | ⋯ | ⋯ |
| S190519bj | 243.4 | 51.1 | 0% | ⋯ | ⋯ |
| S190521g | 205.8 | 49.3 | 30% | HE | 7.4 × 10⁻⁷ |
| S190521r | 225.4 | 51.4 | 0% | ⋯ | ⋯ |
| S190602aq | 127.3 | 45.7 | 0% | ⋯ | ⋯ |
| S190630ag | 84.0 | 31.5 | 0% | ⋯ | ⋯ |
| S190701ah | 286.9 | −1.6 | 0% | ⋯ | ⋯ |
| S190706ai | 210.4 | −45.4 | 0% | ⋯ | ⋯ |
| S190707q | 262.4 | 2.2 | 25% | LEG | 3.8 × 10⁻⁶ |
| S190718y | 195.8 | −11.0 | 10% | LEG | 1.2 × 10⁻⁵ |
| S190720a | 62.9 | −40.5 | 0% | ⋯ | ⋯ |
| S190727h | 201.2 | 38.3 | 0% | ⋯ | ⋯ |
| S190728q | 184.9 | 30.3 | 0% | ⋯ | ⋯ |
| S190814bv | 182.7 | 49.2 | 0% | ⋯ | ⋯ |
| Fermi GBM-190816 | 227.4 | 14.7 | 25% | HE | 2.8 × 10⁻⁵ |
| S190828j | 13.9 | 12.7 | 0% | ⋯ | ⋯ |
| S190828l | 107.1 | 51.0 | 0% | ⋯ | ⋯ |
| S190901ap | 353.8 | 16.7 | 5% | LEG | 2.8 × 10⁻⁵ |
| S190910d | 100.9 | 22.9 | 0% | ⋯ | ⋯ |
| S190910h | 294.8 | −5.4 | 10% | LEG | 5.3 × 10⁻⁷ |
| S190915ak | 99.8 | −11.1 | 0% | ⋯ | ⋯ |
| S190923y | 55.3 | −2.6 | 0% | ⋯ | ⋯ |
| S190924h | 273.5 | 40.2 | 0% | ⋯ | ⋯ |
| S190930s | 20.8 | −3.4 | 5% | HE | 4.5 × 10⁻⁵ |
| S190930t | 235.5 | 36.3 | 0% | ⋯ | ⋯ |
| S191105e | 223.0 | −27.4 | 0% | ⋯ | ⋯ |
| S191109d | 349.8 | −16.6 | 0% | ⋯ | ⋯ |
| S191129u | 356.8 | 50.7 | 0% | ⋯ | ⋯ |
| S191204r | 269.2 | 34.3 | 0% | ⋯ | ⋯ |
| S191205ah | 80.2 | −32.8 | 0% | ⋯ | ⋯ |
| S191213g | 20.4 | −9.3 | 5% | LEG | 1.5 × 10⁻⁵ |
| S191215w | 222.3 | 40.3 | 0% | ⋯ | ⋯ |
| S191216ap | 186.8 | 13.9 | 0% | ⋯ | ⋯ |
| S191222n | 330.3 | −2.1 | 0% | ⋯ | ⋯ |
| S200105ae | 50.6 | −30.6 | 45% | HE | 3.1 × 10⁻⁵ |
| S200112r | 84.6 | 40.0 | 5% | HE | 1.1 × 10⁻⁶ |
| S200114f | 111.1 | 50.7 | 85% | HE | 1.2 × 10⁻⁵ |
| S200115j | 84.4 | 45.9 | 15% | HE | 8.5 × 10⁻⁵ |
| S200128d | 126.1 | 23.4 | 5% | HE | 4.5 × 10⁻⁶ |
| S200129m | 288.7 | −34.3 | 5% | HE | 4.8 × 10⁻⁴ |
| S200208q | 224.1 | −41.8 | 0% | ⋯ | ⋯ |
| S200213t | 101.4 | −36.1 | 0% | ⋯ | ⋯ |
| S200219ac | 298.4 | 51.6 | 0% | ⋯ | ⋯ |
| S200224ca | 167.5 | −24.8 | 95% | HE | 9.0 × 10⁻⁷ |
| S200225q | 157.6 | −32.3 | 0% | ⋯ | ⋯ |
| S200302c | 245.6 | 52.0 | 0% | ⋯ | ⋯ |
| S200311bg | 191.3 | 51.5 | 0% | ⋯ | ⋯ |
| S200316bj | 144.7 | 47.5 | 0% | ⋯ | ⋯ |
Download table as: ASCIITypeset image
Based on the LIGO-Virgo sky maps and taking ISS structures in the field of view into account for each event, we calculate an effective area for each direction as a function of energy. CAL observations of the GeV sky reflect a combination of individual galactic and extragalactic sources together with both galactic and extragalactic diffuse emission in good agreement with Fermi-LAT Pass 8 observations (Cannady et al. 2018, 2021). Based on this, an expected number of background events is calculated for each time interval and direction in the CAL search for counterparts; typically, the expected NBG ∼ 0.1 or less. In the case of a null event, we assume a power-law spectrum for a potential gamma-ray burst with a single power-law photon index of −2 (Poolakkil et al. 2021), taking into account the CAL sensitivity as a function of energy, and estimate an upper limit (90% confidence level) on the gamma-ray flux based on 2.44 events above the expected background. Assuming a burst duration Δt = 1 s, upper limits are calculated for the time interval T0 ± 60 s in units of erg cm−2 s−1 for the energy range 10–100 GeV (with the CAL in HE mode) or 1–10 GeV (with the CAL in LEG mode). The maximum time-averaged flux for an individual pixel in the LIGO/Virgo localization area is listed as the upper limit given in the final column of Table 8.
The lowest upper limit in Table 8 is for the CAL observation of the sky at the time of S190408an. No CGBM onboard trigger occurred near the GW event time; no excess count rate was seen in the ground analysis of the HXM and SGM data within 60 s of T0, and no CAL gamma-ray events were detected within 60 s of the GW trigger time. Figure 10 shows the map of 90% confidence level upper limits measured by CAL during the time interval T0 − 60 s to T0 + 60 s. The pointing direction of the CAL during the observation is marked by the cyan contour extending upward from the lower right to the middle of the diagram. The magenta cross marks the zenith direction at T0. The green area near the extreme upper edge of the CAL 90% upper limit region marks the localization contours reported by LIGO/Virgo. The red and blue circles are the HXM and SGM fields of view ignoring the effects of the ISS structures at T0, respectively.

Figure 10. 90% confidence level upper limits observed by CAL in the energy range 1–10 GeV during the interval ±60 s around the time of GW190408an reported by LIGO/Virgo. The intensity scale is given in units of erg cm−2 s−1. Red and blue circles are the HXM and SGM fields of view, respectively.
Download figure:
Standard image High-resolution image
4. Discussion and Conclusions
The neutron star merger event GRB 170817A was detected by Fermi-GBM and INTEGRAL ∼1.7 s after the gravitational-wave event at a 10–1000 keV flux level (based on the Fermi-GBM measurement) of (5.5 ± 1.2) × 10−7 erg cm−2 s−1 (Goldstein et al. 2017). The observed properties of the gamma-ray event were those of an ordinary although subluminous short GRB. Previously, Fermi-GBM also reported a 2.9σ signal from a candidate short GRB counterpart GW150914-GBM seen 0.4 s after the gravitational-wave event. The reported fluence level over 1 s was (2.4–2.8) × 10−7 erg cm−2 depending on whether a power law or Comptonized model was used to fit the data (Connaughton et al. 2016). Given the low significance and lack of confirmation by other instruments, GBM did not claim this event as a real counterpart to GW150914. Since models of neutron star–neutron star and neutron star–black hole mergers do not provide strong constraints on the expected X-ray/gamma-ray fluxes (Rees & Mészáros 1994, 2005; Phinney 2009; Rosswog 2015; Fernandez & Metger 2016), these two Fermi-GBM/INTEGRAL events suggest that a 10–1000 keV sensitivity level on the order of several times 10−7 erg cm−2 s−1 is a desirable target flux for a hard X-ray/γ-ray counterpart search. The 7σ flux limits (averaged over 1 s) listed for CGBM in Tables 5–7 are typically factors a few times higher than this, largely due to the larger collecting power of GBM compared to CGBM. Nevertheless, there are several possible reasons why GBM or other detectors might miss a real event: (1) the intersection of the LIGO/Virgo localization probability map with the γ-ray detector FOV may be too low; (2) the event may be beamed in an unfavorable direction; or (3) the γ-ray detector may be disabled or experiencing high background as it passes through a high-latitude region or the SAA. Having multiple detectors monitoring for counterparts is therefore essential in order to search effectively for rare events like GW170817-GRB 170817A.
Fermi-LAT searches for GeV gamma rays in coincidence with LIGO/Virgo events (Ackermann et al. 2016; Racusin et al. 2017; Ajello et al. 2019a) have typically been at 95% confidence sensitivity levels of (3–5) × 10−10 erg cm−2 s−1 over the energy range 0.1–1 GeV. Soft GRBs observed by LAT are often delayed and have longer durations than the prompt signals (Ajello et al. 2019b), consistent with an afterglow origin (Pasquale et al. 2010; Gehrels & Razzaque 2013; Kouveliotou et al. 2013). LAT counterpart searches have therefore looked for excesses on timescales up to 10 days before and after T0. In two cases, CAL has detected GeV gamma-ray candidates delayed by 105 and 244 s and from within 06 and 13 of a GRB recorded by CGBM (Kawakubo et al. 2021). However, the CAL energy range is 1–10 GeV (for LEG mode) or 10–100 GeV (for HE mode), where fluxes are expected to be lower than in the Fermi-LAT range. In addition, the smaller CAL telescope will not provide as much sensitivity as LAT for delayed emission, and so the present CAL counterpart search is limited to the prompt emission, where a favorable pointing direction may provide sensitivity greater than that of other larger instruments. As discussed above, CAL has detected no candidate events. The resulting upper limits in Table 8 range from 3.0 × 10⁻⁷ to 4.8 × 10⁻⁴ erg cm−2 s−1.
CALET is currently approved to continue operating through 2024. We gratefully acknowledge JAXA's contributions to the development of CALET and to the operations aboard the JEM-EF on the International Space Station. We also wish to express our sincere gratitude to Agenzia Spaziale Italiana (ASI) and NASA for their support of the CALET project. In Japan, this work was supported in part by JSPS KAKENHI grant Nos. 26220708, 19H05608, 17H02901, 21K03592, and 20K22352 and by the MEXT-Supported Program for the Strategic Research Foundation at Private Universities (2011–2015) (No.S1101021) at Waseda University. The CALET effort in Italy is supported by ASI under agreement 2013-018-R.0 and its amendments. The CALET effort in the United States is supported by NASA through Grants 80NSSC20K0397, 80NSSC20K0399, and NNH18ZDA001N-APRA18-000. A part of this research is made possible by use of data obtained from DARTS at ISAS/JAXA.
Footnotes
- 42
- 43
- 44