

Abstract
We report the discovery of a highly circularly polarized, variable, steep-spectrum pulsar in the Australian Square Kilometre Array Pathfinder (ASKAP) Variables and Slow Transients (VAST) survey. The pulsar is located about 1° from the center of the Large Magellanic Cloud, and has a significant fractional circular polarization of ∼20%. We discovered pulsations with a period of 322.5 ms, dispersion measure (DM) of 157.5 pc cm−3, and rotation measure (RM) of +456 rad m−2 using observations from the MeerKAT and the Parkes telescopes. This DM firmly places the source, PSR J0523−7125, in the Large Magellanic Cloud (LMC). This RM is extreme compared to other pulsars in the LMC (more than twice that of the largest previously reported one). The average flux density of ∼1 mJy at 1400 MHz and ∼25 mJy at 400 MHz places it among the most luminous radio pulsars known. It likely evaded previous discovery because of its very steep radio spectrum (spectral index α ≈ −3, where Sν ∝ να) and broad pulse profile (duty cycle ≳35%). We discuss implications for searches for unusual radio sources in continuum images, as well as extragalactic pulsars in the Magellanic Clouds and beyond. Our result highlighted the possibility of identifying pulsars, especially extreme pulsars, from radio continuum images. Future large-scale radio surveys will give us an unprecedented opportunity to discover more pulsars and potentially the most distant pulsars beyond the Magellanic Clouds.
Export citation and abstract BibTeX RIS

Original content from this work may be used under the terms of the Creative Commons Attribution 4.0 licence. Any further distribution of this work must maintain attribution to the author(s) and the title of the work, journal citation and DOI.
1. Introduction
Since the discovery of the first pulsar (Hewish et al. 1968), a lot of effort has been devoted to developing efficient and sensitive search algorithms (e.g., Ransom 2001; Ransom et al. 2003). The traditional radio pulsar search procedures focus on the Fourier domain or time domain to identify periodic signals (see Chapter 6 in Lorimer & Kramer 2012). While this has been fruitful and has discovered more than ∼3000 pulsars (Manchester et al. 2005), abnormal pulsars such as short orbital period binary systems or strongly scattered objects are more difficult to detect. Indeed, some algorithms have been developed (e.g., for acceleration and "jerk" searches; Ransom 2001; Andersen & Ransom 2018) to explore a broader parameter space, but they are computationally expensive for untargeted sky surveys.
Continuum images have long been considered an effective way to select pulsar candidates based on their steep spectral indices (e.g., Backer et al. 1982; Damico et al. 1985; Strom 1987; Frail et al. 2016b; Bhakta et al. 2017; Maan et al. 2018). Since continuum images are sensitive to pulsar emission regardless of period, scattering, or orbital modulation, in principle they can allow us to find extreme pulsars that have not been detected in traditional pulsar surveys. In fact, the first known millisecond pulsar was initially noticed through the unusual, steep spectral properties, and scintillation of the continuum source, and only then was confirmed by a targeted pulsar search (Backer et al. 1982).
Pulsars are known to be compact enough to exhibit variability due to interstellar scintillation, caused by irregularities in the turbulent interstellar medium (Rickett 1990). Dai et al. (2016) proposed a new detection technique based on this, using diffractive interstellar scintillation in variance images. The scintillation behavior, plus potential intrinsic fluctuations (e.g., intermittent behavior; Lyne 2009), will cause strong flux density variations, and therefore pulsars can sometimes be detected in general radio variability surveys (e.g., Bell et al. 2016; Murphy et al. 2021).
Another approach for identifying pulsars in continuum surveys is through circularly polarized emission (Gaensler et al. 1998; Kaplan et al. 2019). Only a few types of sources are known to be more than a few percent circularly polarized, and they are usually pulsars (e.g., Dai et al. 2015; Lenc et al. 2018) or stellar objects (e.g., Pritchard et al. 2021). Thus, highly circularly polarized sources that lack a deep optical/infrared counterpart are strong pulsar candidates. To date, there have only been two large-scale circular polarization surveys. Lenc et al. (2018) conducted the first all-sky circular polarization survey using the Murchison Widefield Array (MWA) at 200 MHz, and detected 14 known pulsars in the untargeted survey. After that, Pritchard et al. (2021) performed a circular polarization survey for radio stars with the Australian Square Kilometre Array Pathfinder (ASKAP; Hotan et al. 2021) at 888 MHz, and identified 33 known pulsars.
We use the data from the ASKAP Phase I Pilot survey for Variables and Slow Transients (VAST-P1; Murphy et al. 2021) processed with the VAST pipeline (Pintaldi et al. 2021) to search for variable and transient sources in the two ASKAP fields covering the Magellanic Clouds. Here we report the discovery of a highly variable, circularly polarized, steep-spectrum source VAST J052348.6−712552 in this continuum survey. After targeted MeerKAT and Parkes follow-up observations, we identified it as a new pulsar, PSR J0523−7125 located in the Large Magellanic Cloud (LMC). The extragalactic distance makes it one of the most luminous pulsars known at both 400 MHz (L400 ≈ 6.3 × 10⁴ mJy kpc2) and 1400 MHz (L1400 ≈ 2.5 × 10³ mJy kpc2). We present our observations and results in Section 2. In Section 3, we discuss the nature of the pulsar and prospects for identifying future pulsars through continuum imaging surveys.
2. Observations and Results
2.1. ASKAP Discovery
We observed two 30 deg2 fields (field names VAST 0530−68A and VAST 0127−73A) centered on the Magellanic Clouds, six times between 2019 August and 2020 January. Each observation had an integration time of 12 minutes, achieving a typical rms sensitivity of 0.25 mJy beam−1 and angular resolution of 12'' at a central frequency of 888 MHz with a bandwidth of 288 MHz. VAST-P1 incorporated data from the Rapid ASKAP Continuum Survey (RACS; McConnell et al. 2020) as the first epoch, which has the same observing frequency, but a longer integration time of 15 minutes, resulting in an rms sensitivity of 0.20 mJy beam−1 for regions near the Magellanic Clouds. Details of data reduction for these surveys are given in McConnell et al. (2020) and Murphy et al. (2021).
We conducted a search for highly variable sources in the two fields using the VAST transient detection pipeline (Pintaldi et al. 2021; Murphy et al. 2021). We selected candidates with a variability index  (equivalent to the fractional variability used by other surveys) and reduced chi-square η > 2.0ση
(equating to values of
(equivalent to the fractional variability used by other surveys) and reduced chi-square η > 2.0ση
(equating to values of  and η > 6.479), where σ is the standard deviation measured by fitting a Gaussian function to the distributions of both metrics in logarithmic space (following the calculations in Rowlinson et al. 2019). We identified ∼27 candidates as highly variable, compact sources. Two of them were detected with strong circular polarization, and VAST J052348.6−712552 was the only one lacking a clear multiwavelength association/identification (the other one is associated with a stellar object). The fractional circular polarization of VAST J052348.6−712552 (fp = ∣SV
∣/SI
) is about 15%–30% (see the cutout in Figure 1). No linear polarization was detected for this source in VAST-P1, placing a 3σ upper limit of ∼0.9 mJy beam−1 (≲10% fractional polarization) on the total linear polarization (
and η > 6.479), where σ is the standard deviation measured by fitting a Gaussian function to the distributions of both metrics in logarithmic space (following the calculations in Rowlinson et al. 2019). We identified ∼27 candidates as highly variable, compact sources. Two of them were detected with strong circular polarization, and VAST J052348.6−712552 was the only one lacking a clear multiwavelength association/identification (the other one is associated with a stellar object). The fractional circular polarization of VAST J052348.6−712552 (fp = ∣SV
∣/SI
) is about 15%–30% (see the cutout in Figure 1). No linear polarization was detected for this source in VAST-P1, placing a 3σ upper limit of ∼0.9 mJy beam−1 (≲10% fractional polarization) on the total linear polarization ( ). The radio observations are summarized in Table 1 and shown in Figure 2. Other variable sources and the general survey results will be published in a subsequent paper.
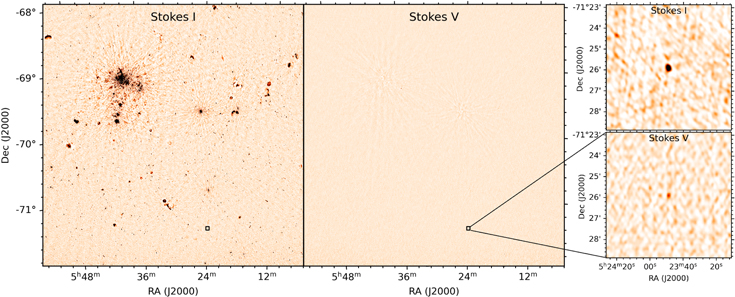
Figure 1. The ASKAP 888 MHz image of the LMC field. We show the total intensity (Stokes I) image on the left, and the circular polarization (Stokes V) image in the center. On the right we show the zoomed images in total intensity (top) and circular polarization (bottom) centered at the position of VAST J052348.6−712552.
Download figure:
Standard image High-resolution image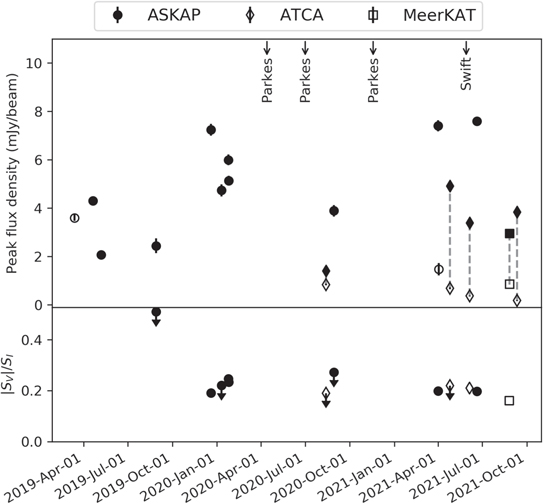
Figure 2. The radio lightcurve of VAST J052348.6−712552, including total intensity (Stokes I) and fractional circular polarization (∣SV ∣/SI ) measured at every available epoch. The closed markers represent the flux density at 888 MHz, and the open markers represent the flux measurement at different frequencies: 1284 MHz for MeerKAT (open squares), 1420 MHz, and 1367.5 MHz for ASKAP midband on 2019 March 13 and 2021 April 2, respectively (open circles), and 2100 MHz for ATCA (open diamonds). We connect the original flux density (open marker; measured at higher frequency with ATCA and MeerKAT) and scaled flux density (closed marker; scaled to 888 MHz based on the fitted spectral index at that epoch) by a gray dashed line. The upper limits for ∣SV ∣/SI are from Stokes V measurements at the 5σ rms level. The black arrows on the top indicate the date of multiwavelength observations.
Download figure:
Standard image High-resolution imageTable 1. Summary of Available Observations for VAST J052348.6−712552
| Obs. Date | Telescope | Duration | Band | Flux Density | ∣SV∣ | ∣SV∣/SI | Survey/Project ID | Ref. |
|---|---|---|---|---|---|---|---|---|
| (UTC) | (MHz) | (mJy beam−1) | (mJy beam−1) | |||||
| 1997 Dec 22 | MOST | 11.5 hr | 843 | 8.6 ± 0.9 | ⋯ | ⋯ | SUMSS | 1 |
| 2013 Nov 15 | MWA | ∼8 minutes | 72–231 | ≲40 (3σ) | ⋯ | ⋯ | GLEAM | 2 |
| 2019 Mar 13 | ASKAP | 12 hr 40 minutes | 1420 | 3.6 ± 0.1 | ⋯ | ⋯ | SB8178 | |
| 2019 Apr 20 | ASKAP | 12 hr 40 minutes | 888 | 4.3 ± 0.1 | ⋯ | ⋯ | EMU/SB8532 | 3 |
| 2019 May 7 | ASKAP | 15 minutes | 888 | 2.07 ± 0.15 | <1.00 | <48% | RACS | 4 |
| 2019 Aug 28 | ASKAP | 12 minutes | 888 | 2.44 ± 0.31 | <1.24 | <51% | VAST-P1 | |
| 2019 Dec 19 | ASKAP | 12 minutes | 888 | 7.24 ± 0.25 | 1.38 ± 0.22 | 19% | VAST-P1 | |
| 2020 Jan 10 | ASKAP | 12 minutes | 888 | 4.73 ± 0.25 | <1.04 | <22% | VAST-P1 | |
| 2020 Jan 24 | ASKAP | 12 minutes | 888 | 5.99 ± 0.22 | 1.48 ± 0.21 | 25% | VAST-P1 | |
| 2020 Jan 25 | ASKAP | 12 minutes | 888 | 5.13 ± 0.21 | 1.20 ± 0.20 | 23% | VAST-P1 | |
| 2020 Apr 13 | Parkes | 30 minutes | 704–4032 | ⋯ | ⋯ | ⋯ | P1069 | |
| 2020 Jul 1 | Parkes | 60 minutes | 704–4032 | ⋯ | ⋯ | ⋯ | P1069 | |
| 2020 Aug 12 | ATCA | 2 hr | 2100 | 0.836 ± 0.036 | <0.159 | <19% | C3363, NAPA | |
| 2020 Aug 12 | ATCA | 2 hr | 5500 | <0.122 | ⋯ | ⋯ | C3363, NAPA | |
| 2020 Aug 12 | ATCA | 2 hr | 9000 | ⋯ | ⋯ | ⋯ | C3363, NAPA | |
| 2020 Aug 29 | ASKAP | 12 minutes | 888 | 3.89 ± 0.24 | <1.06 | <27% | VAST-P1 | |
| 2020 Nov 18 | Parkes | 135 minutes | 704–4032 | ⋯ | ⋯ | ⋯ | P1069 | |
| 2021 Apr 1 | ASKAP | 12 minutes | 888 | 7.40 ± 0.23 | 1.47 ± 0.19 | 20% | VAST-P2-low | |
| 2021 Apr 2 | ASKAP | 12 minutes | 1367.5 | 1.47 ± 0.26 | <1.31 | <89% | VAST-P2-mid | |
| 2021 Apr 25 | ATCA | 80 minutes | 2100 | 0.687 ± 0.038 | <0.148 | <22% | C3431 | |
| 2021 Apr 25 | ATCA | 60 minutes | 5500 | <0.128 | ⋯ | ⋯ | C3431 | |
| 2021 Apr 25 | ATCA | 60 minutes | 9000 | <0.083 | ⋯ | ⋯ | C3431 | |
| 2021 Jun 4 | ATCA | 4 hr | 2100 | 0.364 ± 0.020 | 0.076 ± 0.013 | 21% | C3431 | |
| 2021 Jun 20 | ASKAP | 13 minutes | 888 | 7.6 ± 0.17 | 1.5 ± 0.18 | 20% | VAST-P2-low | |
| 2021 Aug 25 | MeerKAT | 2.5 hr | 1284 | 0.860 ± 0.007 | 0.137 ± 0.005 | 16% | DDT-20210818-TM-01 | |
| 2021 Sep 10 | ATCA | 5 hr | 2100 | 0.176 ± 0.018 | ⋯ | ⋯ | C3431 | |
| 1995–1999 | LCST/GCC | ⋯ | U | >20.7m | MCPS | 5 | ||
| ⋯ | B | >22.6m | ||||||
| ⋯ | V | >22.5m | ||||||
| ⋯ | I | >21.2m | ||||||
| 2009–2012 | VISTA | 7 200 s | Y | >21.1m | VMC | 6 | ||
| 7 200 s | J | >20.9m | ||||||
| 27 000 s | Ks | >20.4m | ||||||
| 2021 May 29 | Swift/XRT | 2 250 s | 0.2–10 keV | <1.31 × 10⁻¹³ | Target ID: 14338 | |||
| (erg s−1 cm−2) | ||||||||
Note. Archival surveys giving best constraints are selected for optical/infrared. In the column of flux density, radio continuum observation refers to the total intensity (Stokes I) with units of mJy beam−1, optical/infrared observation refers to the magnitude (Vega system), and X-ray observation refers to the unabsorbed flux (0.2–10 keV). Flux densities are not available for Parkes pulsar observations. No Stokes V images/catalogs are available for SUMSS, ASKAP SB8178, or ASKAP SB8532. The nondetection upper limits of radio flux measurements are at 5σ confidence level. For the three Stokes V nondetections in the VAST-P1, we combined these three epochs and measured a 3σ peak at the position of VAST J052348.6−712552 from the combined mean image, which yields a ∣SV ∣/SI ≈ 15%, consistent with other detections. The upper limits of other multiwavelength observations are listed at the 3σ confidence level. Due to bad image quality for the ATCA observation at 9000 MHz on 2020 August 12 (compact array configuration) and for the ATCA stokes V image on 2021 September 10 (strong artifacts); those images are discarded and not reported here.
References. (1) Mauch et al. (2003); (2) Hurley-Walker et al. (2017); (3) Pennock et al. (2021); (4) McConnell et al. (2020); (5) Zaritsky et al. (2004); (6) Cioni et al. (2011).
Download table as: ASCIITypeset image
2.2. MeerKAT and Parkes Observations
We observed VAST J052348.6−712552 with the MeerKAT radio telescope (pulsar search mode and continuum imaging mode simultaneously) for 2.5 hr at a central frequency of 1284 MHz (bandwidth of 856 MHz) on 2021 August 25. We searched the MeerKAT (pulsar mode) data for pulsar candidates using the standard Fourier domain search procedure. This was done using pulsar_miner 23 (see Ridolfi et al. 2021 for more details), an automated pipeline based on the presto 24 pulsar searching package (Ransom 2011). After cleaning the observing band by removing the frequency channels affected by strong radio frequency interference (RFI), we generated de-dispersed time series, correcting for the interstellar dispersion with dispersion measure (DM) trial values in the range 2.0–300 pc cm−3, with steps of 0.05 pc cm−3. Each time series was Fourier transformed and the resulting power spectrum searched for prominent periodicities using presto's accelsearch routine. The latter is sensitive to both isolated and binary pulsars, by accounting for possible Doppler shifts of the pulsar spin frequency in the Fourier domain due to orbital motion (see Ransom et al. 2002 for a detailed discussion of the acceleration search technique). For our search, we allowed a maximum drift of up to 200 Fourier bins, using the -zmax 200 option of accelsearch. We identified a strong pulsar candidate, PSR J0523−7125, with a period of 322.5 ms at a DM of 157.5 pc cm−3. No significant acceleration was detected within the 2.5 hr of the observation, indicating that the candidate pulsar is likely isolated, although further timing is ongoing. Figure 3 shows the initial discovery plot of the pulsar. It has a very steep spectrum, consistent with the measurement in continuum imaging (see described below) and a wide pulse profile with duty cycle ∼35% (using the pulse width at 50% maximum, W50). Note the duty cycle may be underestimated as it is difficult to identify the off-pulse baseline for a (wide-pulsed) pulsar like this. We also measured a RM = +456 ± 6 rad m−2 using the rmfit tool in psrchive (Hotan et al. 2004) and found a significant linear polarization (≳50%) after RM correction (see pulse profiles in Figure 4). Further flux calibration is necessary to measure precise polarization properties. This pulsar has not been recorded in any known pulsar catalog (Manchester et al. 2005) or in the Pulsar Survey Scraper, 25 which records newly discovered pulsars prior to publication.
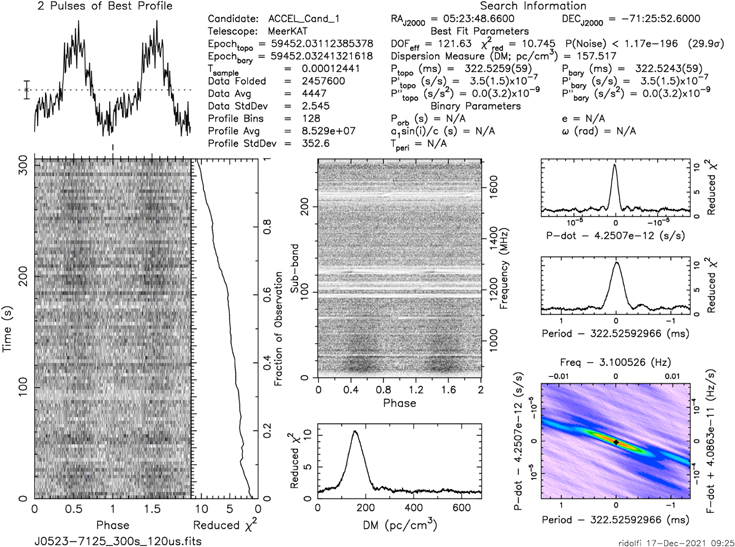
Figure 3. The initial discovery of PSR J0523−7125 from MeerKAT. Note this is from the first 300 s of the full 2.5 hr MeerKAT observation. The plot was generated using presto.
Download figure:
Standard image High-resolution image
Figure 4. Folded pulse profiles of PSR J0523−7125, from the MeerKAT observation (left) and the Parkes observation (right). We show the pulse intensity as a function of frequency over the full bandpass for MeerKAT (lower left) and only the lower UWL bandpass (lower right). The integrated pulse profiles (top) are summed over frequencies ≤1100 MHz, where the signal-to-noise ratio is best. We also show the polarized intensity profiles for both MeerKAT and Parkes observation (with RM correction). Note the linear polarization (P) is (unphysically) higher than total intensity (I) at some pulse phases, possibly due to a combination of RFI issues and "off-pulse baseline" subtraction uncertainty.
Download figure:
Standard image High-resolution imageWe also processed the MeerKAT (simultaneous) continuum data using oxkat (Heywood 2020), which uses: casa for basic flagging, cross calibration, and splitting out measurement sets; tricolour
26
for further flagging; cubical (Kenyon et al. 2018) for self-calibration; and wsclean (Offringa et al. 2014) for continuum imaging. We used PMN J0408−6545 for bandpass and flux calibration, and PMN J0420−6223 for phase calibration. We detected VAST J052348.6−712552 with a total flux density (Stokes I) of 860 ± 7 μJy beam−1 (at ≳100σ confidence level), and circularly polarized flux density (Stokes ∣V∣) of 137 ± 5 μJy beam−1. The source is unsolved in the image, which has an angular resolution of 7 5. In contrast to the pulsar mode result, no linear polarization was detected above 3σ threshold, and a rotation measure (RM) synthesis found no significant polarized intensity in ∣RM∣ < 1200 rad m−2. We will discuss this inconsistency in Section 3.1. We obtained the (Stokes I) spectrum from 8 sub-band images and noticed an unusual upturn at higher frequency (see Figure 5). We fit a smoothly broken power law
27
to the spectrum, and found an upturn at 1.36 ± 0.02 GHz with a spectral index α = −4.40 ± 0.11 in the lower frequency range and α =+2.34 ± 0.51 in the upper frequency range. We also obtained lightcurves (with 10 minutes, 2 minutes, and 8 s resolution, respectively) within the 2.5 hr observation, and found no significant variability on those timescales.
5. In contrast to the pulsar mode result, no linear polarization was detected above 3σ threshold, and a rotation measure (RM) synthesis found no significant polarized intensity in ∣RM∣ < 1200 rad m−2. We will discuss this inconsistency in Section 3.1. We obtained the (Stokes I) spectrum from 8 sub-band images and noticed an unusual upturn at higher frequency (see Figure 5). We fit a smoothly broken power law
27
to the spectrum, and found an upturn at 1.36 ± 0.02 GHz with a spectral index α = −4.40 ± 0.11 in the lower frequency range and α =+2.34 ± 0.51 in the upper frequency range. We also obtained lightcurves (with 10 minutes, 2 minutes, and 8 s resolution, respectively) within the 2.5 hr observation, and found no significant variability on those timescales.

Figure 5. Left: the spectrum measured at the MeerKAT follow-up, with Stokes I (total intensity) in the upper panel and fractional circular polarization (∣SV ∣/SI ) in the lower panel. The error bars are smaller than the marker size. We split the 856 MHz bandwidth into 8 sub-bands, and fitted with a smoothly broken power law. Right: the spectra measured at different ATCA follow-up epochs, with error bars smaller than the marker size. We equally split the 2 GHz bandwidth into 4 sub-bands (centered at 1332 MHz, 1844 MHz, 2356 MHz, and 2868 MHz respectively). The open markers represent 5σ upper limits. We fit the spectra with a single power law in each case, and the fitted spectral indices are shown in the legend. See Sections 2.3 and 2.2 for details.
Download figure:
Standard image High-resolution imageWe observed VAST J052348.6−712552 with the 64 m Parkes telescope on 2020 April 13, 2020 July 1, and 2020 November 18 using the pulsar searching mode with the Ultra-Wideband Low (UWL) receiver (which provides simultaneous frequency coverage from 704 to 4032 MHz; Hobbs et al. 2020). We used presto (Ransom 2001) to perform a standard pulsar search of DMs spanning 0−300 pc cm−3, plus an acceleration search up to ∼200 m s−2. Our initial search of the Parkes observations found some candidate pulsars, but none were convincing. After detecting the pulsar with MeerKAT we reinspected our data and found a pulsar candidate with a similar period and DM. It had not been identified as a convincing candidate in our initial search since the signal is very weak (near our searching threshold SNR of ∼8), possibly due to the wide pulse profile and the steep spectrum (so it is only bright at low frequencies). We then reanalyzed the Parkes observations using the low-frequency data only, and successfully detected this pulsar at frequencies ≲2 GHz. Our Parkes data also measured a similar RM = +457.6 ± 0.1 rad m−2 using rmfit.
We note that this sky region was searched as part of the survey conducted by Ridley et al. (2013) using the Parkes telescope, who claimed a flux density limit of 0.05 mJy at 1400 MHz, well below the flux density of PSR J0523−7125. However, we were able to identify a weak candidate in their data as well, with parameters consistent with PSR J0523−7125. Note that the Ridley et al. (2013) limit assumed a 5% pulse width (compared to 35% for PSR J0523−7125) and assumed that sources were at the centers of the beams of the Parkes Multi-Beam Receiver. Accounting for our pulse width increases the limit by ∼3 while accounting for the position (as the pulsar is close to the half-power point of one of the beams) increases it by a further factor of ∼2. This gives a limiting flux density of about 0.3 mJy, still less than what we observe, but the remaining differences may be due to a combination of scintillation, lost bandwidth due to radio frequency interference, and similar effects.
2.3. ATCA and Archival Radio Observations
Prior to having identified the pulsations in PSR J0523−7125, we carried out follow-up observations of VAST J052348.6−712552 with the Australia Telescope Compact Array (ATCA) on 2020 August 12,
28
2021 April 25, 2021 June 4, and 2021 September 10 respectively, with a 2 GHz bandwidth centered at 2.1 GHz, 5.5 GHz, and 9.0 GHz (project code C3363, PI: Murphy; and project code C3431, PI: Pritchard). We reduced the data using miriad (Sault et al. 1995) with PKS B1934−638 and B0530−727 as the flux and phase calibrators, respectively, and imaged the data using casa (McMullin et al. 2007). We detected the source with a flux density of 0.3−0.9 mJy at 2.1 GHz, but did not detect it at 5.5 GHz or 9.0 GHz in any epoch. We measured a circular polarization flux density of 0.076 ± 0.013 mJy beam−1 at 2.1 GHz for the observation on 2021 June 4, implying a polarization fraction of ∼20%. The source is unresolved in all detected ATCA images, with an angular resolution of 3–6''. We measured the spectral index by splitting the L-band (2.1 GHz) into four sub-bands, and found it to be very steep, varying between α ∼ −4 to ∼−2. The spectra can be fitted using a single power law, and their distributions are shown in Figure 5. The ATCA observations allowed us to measure a more accurate position compared to ASKAP (α = 05h23m48 66, δ = −71°25'5258 in J2000 coordinates), with positional uncertainties of ∼0.15 arcsec in each coordinate.
We also detected VAST J052348.6−712552 in archival radio observations including the Sydney University Molonglo Sky Survey (SUMSS; Mauch et al. 2003) and an ASKAP commissioning observation (SB8532; Pennock et al. 2021). We obtained a higher-time resolution lightcurve from the latter (by imaging 9 × 7 minutes scans separated by 1.2 hr) and found no significant variability within the 12 hr 40 minutes observation. This area is also observed by the GaLactic and Extragalactic All-sky Murchison Widefield Array (GLEAM) survey (Hurley-Walker et al. 2017), and the nondetection yields a 3σ upper limit of ∼40 mJy at 72–231 MHz. All of these observations are listed in Table 1.
2.4. Multiwavelength Imaging Observations
Prior to initiating our pulsar searches we searched archival multiwavelength data including Gaia (Gaia Collaboration et al. 2018), the Wide-field Infrared Survey Explorer (WISE; Wright et al. 2010), the ROSAT All-Sky Survey (Boller et al. 2016), and the Fermi Large Area Telescope source catalog (Acero et al. 2015). No multiwavelength counterparts were found within a 5'' radius in Gaia or WISE, or within a 2' radius in ROSAT or Fermi.
The most sensitive infrared data available for this region is the VISTA Magellanic survey catalog (VMC; Cioni et al. 2011). We found no sources within a 5σ position uncertainty, leading to 3σ limiting magnitudes Y > 21.1 mag, J > 20.9 mag, and Ks > 20.4 mag in this region. The position is also covered by the Magellanic Clouds Photometric Survey (MCPS; Zaritsky et al. 2004), and its nondetections of the source indicate U > 20.7 mag, B > 22.6 mag, V > 22.5 mag, and I > 21.2 mag.
We conducted a Neil Gehrels Swift Observatory Target of Opportunity (ToO) observation (target ID: 14338) on 2021 May 29 using the X-ray Telescope (XRT) in the photon counting mode (exposure time of 2250 s). There is one count within a 15 arcsec radius of VAST J052348.6−712552, implying a count rate upper limit of ∼0.0013 s−1 (0.2–10 keV). We therefore estimated a tentative upper limit to the unabsorbed flux of ∼1.3 × 10⁻¹³ erg s−1 cm−2 (0.2–10 keV) based on an HI column density NH = 0.6 × 1022 cm−2 (similar to the LMC magnetar SGR 0526−66; Park et al. 2012) and a power-law photon index of Γ = 2 using the HEASARC web-based PIMMS. Details of these multiwavelength observations are summarized in Table 1.
3. Discussion
VAST J052348.6−712552 was initially selected in the VAST continuum survey for follow-up due to its high variability and strong circular polarization (fp ∼ 20%), suggesting it is likely a pulsar or stellar object. The absence of any deep infrared/optical counterpart (3σ limit J > 20.9 mag) strongly suggested it was a pulsar. Pulsar searches with MeerKAT and Parkes confirmed the pulsar nature of VAST J052348.6−712552. This pulsar, PSR J0523−7125, has a period of 322.5 ms, DM of 157.5 pc cm−3, and a wide pulse profile. Our ATCA observations show very steep spectral indices ranging from α ∼ −4 to ∼−2. The MeerKAT spectrum shows an unusual upturn at 1.36 GHz from α = −4.4 to α = 2.34. We will discuss the properties of this pulsar in detail in Section 3.1.
3.1. Pulsar Properties
As shown in Figure 1, we know the source is located in the direction of the LMC. The maximum DM contribution from the Milky Way along this line of sight is ∼50–60 pc cm−3 (NE2001 and YMW16; Cordes & Lazio 2002; Yao et al. 2017), and there is no known Galactic H ii region along this line of sight. With a DM of 157.5 pc cm−3, PSR J0523−7125 almost certainly resides in the LMC. We also note this DM is consistent with the DMs of other pulsars found in the LMC (∼50–270 pc cm−3; e.g., McConnell et al. 1991; Manchester et al. 2006; Ridley et al. 2013; Johnston et al. 2022).
We can calculate the monochromatic radio luminosity density of PSR J0523−7125 at 400 MHz and 1400 MHz respectively (Lν = Sν d2, where Sν is the flux density and d is the pulsar distance). Our ATCA, MeerKAT, and ASKAP midband observations covered 1400 MHz, and the measured average flux density is S1400 ≈ 1 mJy. The flux density at 400 MHz is therefore S400 ≈ 25 mJy assuming a median spectral index α ∼ −2.6 (Figure 5). The flux density at 400 MHz would be ten times higher for the steepest spectral index that we measure (α ∼ −4.4). The pulsar distance d is assumed to be the LMC distance of 50 kpc (Pietrzyński et al. 2013), which is reasonable since the uncertainty in luminosity should be dominated by the uncertainty in the flux density. We can then estimate L400 ≈ 6.3 × 10⁴ mJy kpc2 and L1400 ≈ 2.5 × 10³ mJy kpc2, which is one of the most luminous pulsars to date (see Figure 6). Only one known pulsar with a well-constrained distance, B1641−45 (Komesaroff et al. 1973; Frail et al. 1991), has a comparable luminosity to PSR J0523−7125 (∼7.6 × 10³ mJy kpc2 at 400 MHz and ∼6.1 × 10³ mJy kpc2 at 1400 MHz). We exclude other high-luminosity pulsars, like PSR J0134−2937, from consideration due to their significant distance uncertainties.
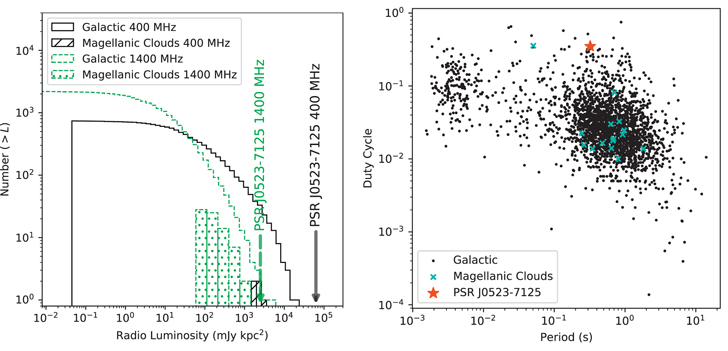
Figure 6. The left panel is the cumulative luminosity density function for known pulsars in the Galaxy (unfilled) and the Magellanic Clouds (filled). The black color represents luminosity at 400 MHz (L400), and the green color represents luminosity at 1400 MHz (L1400). The histogram filled with black stripes represents the luminosity distribution of Magellanic Clouds pulsars at 400 MHz, and the histogram filled with green dots represents the luminosity distribution of Magellanic Clouds pulsars at 1400 MHz. The right panel is the period vs. duty cycle distribution of known pulsars, with Galactic pulsars marked as black and Magellanic Clouds pulsars marked as cyan. The red star represents our pulsar, PSR J0523−7125, which shows an offset from the majority of the pulsar population (as a slow pulsar with a large duty cycle). Data is from the ATNF pulsar catalog (Manchester et al. 2005, catalog version 1.66).
Download figure:
Standard image High-resolution imageRidley et al. (2013) calculated the luminosity function of the LMC pulsars and noticed a discrepancy between the Galactic and LMC luminosity distributions. They attributed the discrepancy to a bias due to the small sample size of the LMC pulsars and concluded that the luminosity function for the LMC pulsars is consistent with its counterpart in the Galactic disk. They also suggested that the maximum 1400 MHz radio luminosity for LMC pulsars is approximately 1000 mJy kpc2 based on their sample. Our pulsar is about a factor of ∼2 more luminous than this limit. With the discovery of PSR J0523−7125, we can revisit the luminosity function of the LMC pulsars by fitting the high-luminosity tail of the distribution as a power law, i.e.,  , where F is the slope of the distribution (Lorimer et al. 2006). Based on the ATNF pulsar catalog (Manchester et al. 2005), we estimate F ≈ −1.30 ± 0.03 for Galactic pulsars with luminosities above 30 mJy kpc2 (consistent with other work, e.g., Lorimer 2004; Ridley et al. 2013), and F ≈ −1.6 ± 0.2 for LMC pulsars with luminosities above 125 mJy kpc2. Although the calculation is still limited by small number statistics for the LMC pulsars and the distance uncertainties for Galactic pulsars, our result shows that the LMC pulsars are consistent with the luminosity function of their Galactic counterparts (as suggested by Manchester et al. 2006; Ridley et al. 2013).
PSR J0523−7125 has a wide pulse profile with W50 ≈ 100 ms at ∼1 GHz. Figure 6 shows the duty cycle distribution of known pulsars, and PSR J0523−7125 generally has a larger duty cycle than others (either Galactic or extragalactic pulsars). The observed pulse width W can be decomposed as  , where τint is the intrinsic pulse width, τsc is the pulse broadening due to multipath scattering, and τDM is the pulse broadening due to dispersion (Lorimer & Kramer 2012). Both τsc and τDM are related to free electrons in the interstellar medium (i.e., the DM; Bhat et al. 2004). Following the YMW16 model (which includes the distribution of free electrons in the Galaxy and the Magellanic Clouds), the predicted scattering delay for Magellanic Clouds pulsars along this line of sight is τsc ≪ 1 ms at 1100 MHz. This suggests that the wide pulse profile is largely intrinsic. As noted in Section 2.2, the pulse width may be further underestimated due to the difficulty of identifying the off-pulse baseline. If this is the case, PSR J0523−7125 could potentially have a nearly 100% duty cycle, i.e., a possible nearly aligned rotator (the magnetic and rotation axis of the star are aligned; e.g., Young et al. 2010). This assumption could also explain why the pulsar is so bright in continuum images, but hard to detect in a pulsar search. The pulsar calibration is ongoing and we will discuss it further in a later paper.
Our MeerKAT pulsar data measured a RM = +456 rad m−2, and the Parkes data confirmed this result. However, we cannot find any significant linear polarization in MeerKAT continuum data in an RM range from −1200 to 1200 rad m−2. This discrepancy can be attributed to the potential swing of the polarization position angle in the pulse phase (e.g., following the characteristic S-shaped curve of the rotating vector model; Radhakrishnan & Cooke 1969), making the effective linear polarization fraction very diluted when integrated into the continuum image. Further precise polarimetry can confirm this. We noticed this ∣RM∣ is about twice the most extreme ∣RM∣ of known LMC pulsars, PSR J0540−6919 with RM = −246 rad m−2 (Johnston et al. 2022), which is located in a supernova remnant. We checked the UM/CTIO Magellanic Cloud emission-line survey (MCELS; Smith & MCELS Team 1998) and found there is some faint, diffuse emission around our pulsar in the Hα map (with an angular scale ∼13 arcmin). We got a Hα intensity IHα
≈ 1.3 × 10⁻¹⁶ erg cm−2 s−1 arcsec−2 from the MCELS map after extinction correction (following the method in Gaensler et al. 2005), and thus the emission measure (EM) is ∼70 pc cm−6. The foreground contribution to the DM in this line of sight is about 60 pc cm−3 (Yao et al. 2017), and to the RM is about +31 rad m−2 (Mao et al. 2012). After subtracting the Galactic foreground contribution, the estimated parallel magnetic field B∥ = 1.23 RMLMC/DMLMC ≈ 5 μG, and the estimated electron column density ne
= EM/DMLMC ≈ 0.7 cm−3. The occupation length, fL, of ionized gas is  pc, where L is the projected length and f is the filling factor (the fraction of the line of sight for free electron density). For reasonable values of f, L/d is of the order of the angular scale of the Hα emission (where d = 50 kpc for the LMC). If we assume the angular size is 13 arcmin (as we observed from the MCELS image), the inferred filling factor f ≈ 0.8 and the length L ≈ 180 pc. Those values are reasonable for an evolved HII region. If the pulsar turns out to be young in future timing analysis, it is likely embedded in this diffuse gas region.
In our continuum observations, VAST J052348.6−712552 shows strong variability with a modulation index ∼43% at 888 MHz over timescales of ∼days (see the lightcurve in Figure 2). There is no significant continuum variability within the 2.5 hr MeerKAT observation or the 12 hr ASKAP EMU observation. A structure–function analysis shows that the variability timescale is ∼17 d, though this is poorly constrained due to the absence of samples between 1 d and 14 d. This strong variability could be intrinsic (e.g., pulsar nulling; Backer 1970) or related to propagation effects (e.g., diffractive scintillation; Rickett 1990). The diffractive scintillation bandwidth follows ΔfDISS ∼ C1/2π
τsc MHz (Cordes & Lazio 2002), where C1 = 1.16 assuming a Kolmogorov spectrum and τsc is the scattering time. The predicted scattering delay for the LMC pulsars in this line of sight is τsc ∼ 10−2 ms based on the YMW16 model, and thus ΔfDISS ∼ 10−2 MHz. The scintillation strength,  where f is the observing frequency, is therefore u ≫ 1, implying a strong scattering regime (i.e., diffractive scintillation and/or refractive scintillation). Diffractive scintillation in this case is an unlikely explanation, as the calculated ΔfDISS is about 10−2 MHz, far lower than the observing frequency channel width ∼1 MHz. For refractive scintillation, the calculated modulation index
  , and the timescale ∼102 days. Walker (1998) estimated the effects of interstellar scintillation (arising from the Milky Way) on extragalactic sources using the TC93 model (Taylor & Cordes 1993), and we find a different modulation index of m ∼ 42% and timescale of ∼2 day based on this model. These estimations are not too far from our observed results, and we therefore think the variability can be explained by propagation effects. However, we cannot rule out the possibility of contribution from intrinsic variation. As we mentioned before, the large duty cycle of the pulsar suggests that the pulsar could be an aligned rotator, which is known to show larger levels of nulling (Cordes & Shannon 2008). Aligned rotating pulsars also show mode-changing behavior (e.g., PSR J1107-5907, Hobbs et al. 2016).
The source shows very steep spectral indices (varying from α ∼ −4 to α ∼ −2) even compared to the pulsar population (average α of −1.4; Bates et al. 2013, and α < −2.5 for the fastest rotating millisecond pulsar; e.g., Frail et al. 2016a). The high-quality MeerKAT continuum data show an unusual radio spectral shape, with an upturn at 1.36 GHz from α = −4.4 to α = 2.34. The upturn at ∼1 GHz is hard to explain as most pulsars can be described using a simple power-law spectrum. Some pulsar spectra are known to show a turnover at low frequencies due to synchrotron self-absorption or thermal free–free absorption; however, this is the opposite of what we see (i.e., transitioning from a flat to a steeper spectrum; see examples in Jankowski et al. 2018). We also note that some pulsars can have an upturn spectrum at a higher frequency, but this usually occurs at millimeter wavelengths (≳10 GHz; Kramer et al. 1996). Therefore, we instead consider external effects. Tuntsov et al. (2017) found that scintillation can cause kinks, bumps, and wiggles in the broadband radio spectrum of a quasar. If PSR J0523−7125 is scintillating (as we suggested above), we might be able to see unusual spectra structures like these.
Further observations should be able to conclusively determine a timing solution, providing an age and spin-down luminosity of the source. We will discuss these properties in a later paper.
3.2. Identifying Pulsars in Continuum Surveys
The Magellanic Clouds have been targeted several times with pulsar surveys using the Parkes telescope (e.g., McCulloch et al. 1983; McConnell et al. 1991; Crawford et al. 2001; Manchester et al. 2006; Ridley et al. 2013), identifying 31 extragalactic pulsars. PSR J0523−7125 is brighter than all of these but was not identified in these surveys. Its wide pulse profile and steep spectrum could be responsible for its nondetection since they would reduce the signal-to-noise ratio. This is especially true in surveys with the Parkes Multibeam receiver at 1400 MHz, where many recent searches have been conducted. As described in Section 2.2, we cannot easily detect the pulsar using traditional methods from targeted Parkes data. However, we can clearly identify it in Parkes using only low-frequency data from the UWL receiver, consistent with the spectral properties determined from continuum images.
There are many continuum-based pulsar searches using a steep spectral index as the selection metric (e.g., Damico et al. 1985; Camilo et al. 2000; Maan et al. 2018; Hyman et al. 2019), but only a limited number of new pulsars have been found (e.g., Bhakta et al. 2017; Frail et al. 2018). The steep-spectrum selection normally requires two observations at different frequencies to measure the spectral index. Moreover, there are also other types of sources that can have very steep spectra, such as high-redshift radio galaxies (O'Dea 1998). Circularly polarized sources without deep infrared/optical counterparts are highly likely to be pulsars. We also note that such sources may belong to an as yet unknown class or classes. For instance, the Galactic Center Radio Transient (GCRT; Hyman et al. 2002, 2005), two steep-spectrum, polarized sources near the Galactic bulge (C1748−2827 and C1709−3918; Hyman et al. 2021), and a polarized transient recently discovered in the VAST survey near the Galactic Centre (ASKAP J173608.2−321635; Wang et al. 2021) are circularly polarized sources without deep infrared/optical counterparts, whose natures are still unknown.
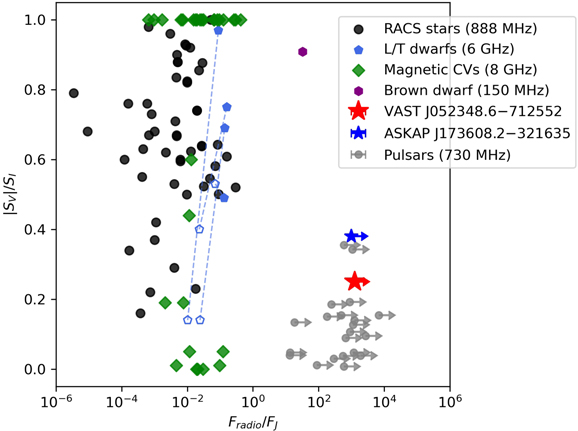
There are an increasing number of large-scale radio continuum surveys, ranging from low-frequency surveys such as the Low-Frequency Array (LOFAR) Two-meter Sky Survey (LoTSS; Shimwell et al. 2017), the Giant Metrewave Radio Telescope (GMRT) 150 MHz All-Sky Survey (TGSS; Intema et al. 2017), and the GaLactic and Extragalactic All-sky Murchison Widefield Array survey (GLEAM; Hurley-Walker et al. 2017), to gigahertz-frequency surveys such as the ASKAP Rapid Commissioning Survey (RACS; McConnell et al. 2020), the Evolutionary Map of the Universe survey with ASKAP (EMU; Norris et al. 2021), the Polarization Sky Survey of the Universe's Magnetism (POSSUM; using the same sky coverage as EMU with full polarization; Gaensler et al. 2010), and the Karl G. Jansky Very Large Array (VLA) Sky Survey (VLASS; Lacy et al. 2020). With improved instruments in the Square Kilometre Array era, instantaneous large fields of view and great sensitivity will be even more common, leading to the detection of large numbers of radio sources across the sky. Some or most of the surveys include circular polarization measurements. Apart from radio wavelengths, there are significant improvements in multiwavelengths surveys (with better sensitivity and large sky coverage), e.g., the VISTA Variables in the Via Lactea (VVV; Minniti et al. 2010), the VISTA Hemisphere Survey (VHS; McMahon et al. 2013), the Dark Energy Survey (DES; Abbott et al. 2018), and the Gaia mission (Gaia Collaboration et al. 2016). These deep multiwavelength surveys can greatly help with the classification of a circularly polarized object (e.g., to check if there is any stellar counterpart). As shown in Figure 7, which listed known circular polarized objects including various stellar objects, the radio to near-infrared flux ratio (plus the fractional circular polarization) can be used as a good diagnostic tool to select strong pulsar candidates.
Figure 7. Fractional circular polarization vs. radio to near-infrared flux ratio for stellar objects and pulsars. The black circles represent radio stars measured in RACS at 888 MHz (Pritchard et al. 2021), the blue pentagons represent quiescence (open symbols) and peak (filled symbols) auroral emissions from L/T dwarfs at 6 GHz (Kao et al. 2016), the green diamonds represent magnetic cataclysmic variables at 8 GHz (Barrett et al. 2020), the purple hexagon represents the recently discovered brown dwarf BDR J1750+3809 at 150 MHz (Vedantham et al. 2020), the gray circles represent a group of pulsars measured at 730 MHz (Dai et al. 2015), the blue star represents another polarized transient ASKAP J173608.2−321635 detected in VAST-P1 (Wang et al. 2021), and the red star represents VAST J052348.6−712552. The near-infrared data were taken from various surveys with the Visible and Infrared Survey Telescope for Astronomy (VISTA; Dalton et al. 2006; Emerson et al. 2006) and the Two Micron All-Sky Survey (2MASS; Skrutskie et al. 2006). We note that VAST J052348.6−712552 is consistent with the pulsar region.
Download figure:
Standard image High-resolution image
One limitation of circular polarization selection is that not all pulsars have a high level of circular polarization (the median fraction ∼10%; Han et al. 1998; Johnston & Kerr 2018). As estimated by Kaplan et al. (2019), even deep ASKAP continuum searches (e.g., EMU, with sensitivity ∼50 μJy) for circularly polarized sources are unlikely to find large numbers of new pulsars. However, it may be critical to identify extreme pulsars that are missed in traditional pulsar surveys. For example, the high electron density in the Galactic Centre direction (which has much higher stellar densities) causes strong scattering and makes pulsars relatively difficult to discover through traditional periodicity searches.
Extragalactic pulsar searches in continuum images are also possible. To date, the Magellanic Clouds are still the only place where extragalactic pulsars have been detected, even after several attempts at searching for pulsars in other galaxies including M31, M33, and nearby dwarf galaxies (e.g., McLaughlin & Cordes 2003; Bhat et al. 2011; Rubio-Herrera et al. 2013; Mikhailov & van Leeuwen 2016; van Leeuwen et al. 2020). We can estimate the number of detectable pulsars in M31 (our neighbor galaxy) through continuum surveys, by putting all known Galactic pulsars at the distance of M31 (785 ± 25 kpc; McConnachie et al. 2005). We assume that the number of pulsars in M31 and our Galaxy is similar, though some work suggests there may be a smaller radio pulsar population in M31 (van Leeuwen et al. 2020). We consider using the Next Generation Very Large Array (ngVLA; Murphy et al. 2018), which is about 10 times more sensitive than the VLA and can achieve a resolution at ∼mas level. The ngVLA is located in the Northern hemisphere and therefore also ideal for observing M31 (and M33). The rms sensitivity of the ngVLA is expected to be ∼0.1 μJy beam−1 for a 10 hr observation at ∼1–3 GHz. Assuming this sensitivity, more than ∼50 simulated M31 pulsars could be detected at the >5σ level in a survey of M31, and ∼5 could be detected in circular polarization. Although the estimated number is still very low, it is a promising possibility to detect the most luminous pulsars in M31 (e.g., those similar to PSR J0523−7125). With such an observation, we would also be able to measure their flux densities and spectral properties, providing valuable information for follow-up targeted periodicity searches.
4. Conclusion
We discovered a highly variable, circularly polarized object, VAST J052348.6−712552, in a variability analysis of two fields containing the Magellanic Clouds observed as part of the VAST-P1 survey. With ∼20% fractional circular polarization and no optical/infrared counterpart, VAST J052348.6−712552 was considered to be a strong pulsar candidate. Subsequent MeerKAT observations discovered a pulsar, PSR J0523−7125, associated with the continuum source, which was further confirmed with observations using the Parkes telescope. The pulsar has a period of 322.5 ms and a DM of 157.5 pc cm−3, consistent with an LMC origin. The extragalactic distance makes PSR J0523−7125 among the most luminous known pulsars for steady-state emission; in particular, it is brighter than all known pulsars in the Magellanic Clouds at both 400 MHz and 1400 MHz. Despite its high luminosity, PSR J0523−7125 remained undetected in several LMC pulsar surveys, which we suspect is largely due to its wide pulse profile and/or steep spectral shape. The wide pulse profile also suggests that PSR J0523−7125 could be an aligned rotator. The strong variability is likely due to scintillation effects, though we cannot rule out the possibility of any intrinsic variation. We measured a large RM = +456 rad m−2 for this pulsar, which is about twice the most extreme ∣RM∣ of LMC pulsars. A preliminary analysis shows that PSR J0523−7125 is likely embedded in an evolved HII region, which would be further strengthened if it turns out to be a young pulsar in ongoing timing analysis.
Our discovery highlights the possibility of identifying pulsars (especially nonstandard pulsars) from continuum images, particularly when circular polarization is combined with (largely archival) multiwavelength data. Improved next-generation radio telescopes and an increasing number of large-scale multiwavelength surveys will bring large amounts of data with great sensitivity and resolution, giving us an unprecedented opportunity to identify more pulsars (even for extragalactic pulsars farther than the Magellanic Clouds) via continuum images.
We thank the anonymous reviewer for their useful comments. We thank Elaine Sadler, Ron Ekers, Elizabeth Mahony, Shami Chatterjee, Mark Walker, Keith Bannister, Natasha Hurley-Walker, and Aris Karastergiou for useful discussions. We thank the MeerKAT and Swift directors for approving our DDT observations, and S. Buchner for assistance in scheduling and conducting MeerKAT observations. Y.W. is supported by the China Scholarship Council. T.M. acknowledges the support of the Australian Research Council (ARC) through grant DP190100561. DK and AO are supported by NSF grant AST-1816492. V.G., N.R., and M.R. acknowledge support from the H2020 ERC Consolidator Grant "MAGNESIA" under grant agreement Nr. 817661 (PI: Rea), and grants SGR2017-1383 and PGC2018-095512-B-I00. R.M.S. acknowledges support through ARC Future Fellowship FT 190100155. A.R. gratefully acknowledges financial support by the research grant "iPeska" (PI: Andrea Possenti) funded under the INAF national call Prin-SKA/CTA approved with the Presidential Decree 70/2016 and continuing valuable support from the Max-Planck Society. AR also acknowledges support from the Ministero degli Affari Esteri e della Cooperazione Internazionale—Direzione Generale per la Promozione del Sistema Paese—Progetto di Grande Rilevanza ZA18GR02. G.R.S. is supported by NSERC Discovery Grants RGPIN-2016-06569 and RGPIN-2021-0400. This research was supported by the Sydney Informatics Hub (SIH), a core research facility at the University of Sydney. Parts of this research were conducted by the Australian Research Council Centre of Excellence for Gravitational Wave Discovery (OzGrav), project number CE170100004. This research has made use of the VizieR catalog access tool, CDS, Strasbourg, France (Ochsenbein et al. 2000). The Australia Telescope Compact Array and the Parkes radio telescope are part of the Australia Telescope National Facility (grid.421683.a) which is funded by the Australian Government for operation as a National Facility managed by CSIRO. The Australian SKA Pathfinder is part of the Australia Telescope National Facility which is managed by CSIRO. The operation of ASKAP is funded by the Australian Government with support from the National Collaborative Research Infrastructure Strategy. ASKAP uses the resources of the Pawsey Supercomputing Centre. The establishment of ASKAP, the Murchison Radio-astronomy Observatory, and the Pawsey Supercomputing Centre are initiatives of the Australian Government, with support from the Government of Western Australia and the Science and Industry Endowment Fund. We acknowledge the Wajarri Yamatji people as the traditional owners of the Observatory site. The MeerKAT telescope is operated by the South African Radio Astronomy Observatory, which is a facility of the National Research Foundation, an agency of the Department of Science and Innovation.
Facility: ASKAP, ATCA, MeerKAT, Parkes, Swift.
Software: APLpy (Robitaille & Bressert 2012), Astropy (Astropy Collaboration et al. 2013, 2018), CASA (McMullin et al. 2007), CubiCal (Kenyon et al. 2018), matplotlib (Hunter 2007), MIRIAD (Sault et al. 1995), NumPy (Harris et al. 2020), oxkat (Heywood 2020), PRESTO (Ransom 2011), PSRCHIVE (Hotan et al. 2004), pulsar_miner, 29 PyPulse (Lam 2017), RM-Tools (Purcell et al. 2020), tricolour, 30 wscleanv (Offringa et al. 2014).
Footnotes
- 23
- 24
- 25
- 26
- 27
- 28
The array was in a compact configuration EW352 on 2020 August 12, and only baselines including antenna 6 were included, corresponding to a baseline range of 4087–4439 km.
- 29
- 30