


Abstract
Due to the lack of a global magnetic field, the charge exchange process between the solar wind protons and Martian hydrogen corona is of critical importance to Mars' atmosphere. The energetic neutral atoms and pickup H+ produced during this process can further excite proton aurorae and proton cyclotron waves (PCWs) in the near-Mars space, for which the observational evidence however remains very limited. Here we report a particular event to show that the PCWs and proton aurorae were simultaneously recorded by the Mars Atmosphere and Volatile EvolutioN spacecraft during 10 consecutive orbits. As the byproducts of the charge exchange process, these two phenomena are found to be highly correlated in both space and time, with the correlation coefficient >0.7 between the auroral emissions and PCW amplitudes. Moreover, the wave and ultraviolet measurements show clearly that both the PCWs and proton aurora events tend to occur more frequently and intensively within the stream interaction region, as being strongly modulated by the solar wind activity. Our results indicate that the solar wind can directly transport energy and particles into the near-Mars environment, leading to the simultaneous enhancements of plasma wave activity and proton precipitation, which therefore helps comprehend the significant role of the solar wind activity and charge exchange process in driving the energy budget to the Martian upper atmosphere.
Export citation and abstract BibTeX RIS

Original content from this work may be used under the terms of the Creative Commons Attribution 4.0 licence. Any further distribution of this work must maintain attribution to the author(s) and the title of the work, journal citation and DOI.
1. Introduction
Distinctively different from the Earth, Mars is a planet that lacks a strong global magnetic field and contains a hydrogen exosphere that expands beyond the bow shock due to its relatively low gravity (e.g., Anderson 1974; Chaufray et al. 2008). Thanks to both features, the atomic hydrogen (H) in the Martian exosphere can interact directly with solar wind protons, thereby giving rise to energetic neutral atoms (ENAs) and pickup ions via a process called charge exchange (H+ + H → H + H+; Barabash et al. 1995). These newly created H ENAs retain the velocity of solar wind protons, traverse freely through the Martian upper space (magnetosheath, magnetic pileup region, and the ionosphere), and ultimately deposit their energies at thermospheric altitudes (∼100–200 km) through repetitive collisional processes such as excitation, dissociation, and ionization reactions (e.g., Barabash et al. 1995; Kallio et al. 1997). As for the pickup ions, they are mostly captured by the solar wind convection electric field and mixed with the solar wind protons upstream of Mars. As an important nonthermal component, these ions provide free energies to generate/sustain various plasma instabilities (Wu & Davidson 1972; Wu & Hartle 1974), and represent a major source term to wave fluctuations. In this paper, we mainly focus on the two byproducts originating from ENAs and pickup ions: proton aurorae and proton cyclotron waves (PCWs), respectively.
Based on the production mechanism, the aurora phenomena on Mars can be classified into three types: discrete aurorae (Bertaux et al. 2005), diffuse aurorae (Schneider et al. 2015), and proton aurorae (Deighan et al. 2018), with the first two types of aurora occurring on the Martian nightside and the third on the dayside. Both discrete and diffuse aurorae are produced by the precipitation of energetic electrons; a discrete aurora is associated with the cusp-like region formed by the crustal magnetic field (Bertaux et al. 2005), whereas a diffuse aurora is associated with the open magnetic field lines of Mars (Schneider et al. 2015). In contrast, a proton aurora is related to the abovementioned charge exchange process (Kallio & Barabash 2001), and specifically caused by the spontaneous decay of ENAs from the neutral excited state (2p) to the ground state (1s), wherein Lyα photons with a wavelength of 121.6 nm are emitted.
Even long before the first spacecraft observation (Deighan et al. 2018), a proton aurora had been predicted by Kallio & Barabash (2001), and has been the main focus of several Mars exploration missions: Mars Express (Bertaux et al. 2006) and the Mars Atmosphere and Volatile EvolutioN (MAVEN) spacecraft (Jakosky et al. 2015). Deighan et al. (2018) first reported enhancements of hydrogen Lyα emissions, i.e., proton aurorae that were closely associated with solar wind activity using MAVEN measurements. Detailed studies (Ritter et al. 2018) using the proton aurora data collected by Mars Express between 2004 and 2011 have revealed that the Lyα signature typically peaks at altitudes of 110–150 km with a brightness on the order of a few kilorayleighs (kR). Moreover, Ritter et al. (2018) connected proton aurorae to solar events, and all detections in their work are related to the arrival of a coronal mass ejection (CME) or a corotating interaction region at Mars. Using the Lyα limb profiles observed by MAVEN over two Martian years, Hughes et al. (2019) have pointed out that the proton aurora is the most commonly occurring type of aurora on Mars, and exhibits great dependence on the season, as well as the solar zenith angle (SZA). Besides auroral emissions, a certain fraction of ENAs can be reconverted into protons via charge exchanging with the atmospheric constituents, therein producing fluxes of penetrating protons with the characteristic energy of solar wind (Bougher et al. 2015; Halekas et al. 2015a; Girazian & Halekas 2021). Several important studies have been conducted to analyze the proton precipitation into the Martian atmosphere. Diéval et al. (2012a) found that the flux of precipitating protons has a strong altitude dependence and its distribution is highly asymmetric. Subsequent case and statistical studies further showed that the precipitation is a transient phenomenon related to the heated protons, and the precipitating flux is higher on the dayside than on the nightside (e.g., Diéval et al. 2012b, 2013). These penetrating protons have been suggested to have significant implications for understanding the solar energy input into the Martian atmosphere (Halekas et al. 2015a).
PCWs commonly occur upstream of Mars and are associated with solar-wind-produced pickup H+ (e.g., Liu et al. 2020; Romeo et al. 2021). Generally, pickup protons were observed at Mars going back to the Phobos time (Barabash et al. 1991). These pickup ions can be produced by charge exchange, photoionization, and electron collisions (Zhang et al. 1993), among which charge exchange overtakes the other processes (Rahmati et al. 2018). Most PCWs are in the right-handed (RH) whistler-magnetosonic branch, typically showing the right-handed elliptical polarization in the plasma frame, but they can be Doppler-shifted to the left-handed elliptical polarization in the Mars frame in order to satisfy the resonance condition with newly born H+ ions. PCWs peak around the local proton cyclotron frequency in the power density spectrum, and propagate quasiparallelly to the background magnetic field (Brain et al. 2002; Mazelle et al. 2004). Moreover, PCWs are widely distributed in the near-Mars space and can be observed at distances as far as 15 Martian radii (Wei & Russell 2006).
The stream interaction region (SIR) is the region in which the high-speed solar wind from a coronal hole interacts with the slow-speed solar wind from the coronal stream due to solar rotation (Jian et al. 2006). The high-speed solar wind compresses the slower yet denser solar wind, resulting in an increased plasma density, temperature, and magnetic field intensity in the SIR, which ultimately facilitates the charge exchange process with the Martian hydrogen exosphere. By investigating a total of 149 SIR events recorded by MAVEN between 2014 and 2018, Huang et al. (2019) have found that the average occurrence rate of SIRs on Mars is slightly higher than that on Earth. The influence of a single SIR event on the Martian atmosphere may be smaller compared to other solar activities, for example, CME, but SIRs occur more frequently and the cumulative effects become pronounced.
Although various studies have been devoted to the investigation of PCWs and the proton aurora phenomenon on Mars, observation of both events has not been reported, to the best of our knowledge, to date. The purpose of this paper is twofold. First, we report a particular event in which a proton aurora and PCWs were simultaneously recorded by the MAVEN mission during 10 consecutive orbits. Second, we investigate in detail the correlation in space and time between the proton aurora, PCWs, and the SIR, to quantitatively estimate the relationship among these important phenomena in the Martian space environment.
2. MAVEN Data and Methods
MAVEN was specifically designed to study the structure, composition, and variation of Mars' atmosphere and ionosphere through in situ and remote sensing techniques (Jakosky et al. 2015). In this study, we use the data recorded by the Solar Wind Ion Analyzer (SWIA; Halekas et al. 2015b), the Solar Wind Electron Analyzer (SWEA; Mitchell et al. 2016), the Magnetometer (MAG; Connerney et al. 2015), and the Imaging Ultraviolet Spectrograph (IUVS; McClintock et al. 2015) mounted on MAVEN. SWIA is an electrostatic analyzer, and can detect ions over an energy range of 5–25 keV with a maximum angular range of 360° × 90° (field of view) with resolutions of 22 5 × 225. We use the "Moment" data products at a 4 s cadence to get the velocity, density, and temperature of protons, and the "Coarse-3D" data products with an 8 s time resolution to acquire the 3D distribution function. SWEA is also an electrostatic analyzer, but designed to measure electrons in the Mars space environment with an energy range of 3–4600 eV at a 2 s cadence. The MAG instrument is a fluxgate magnetometer that measures the three magnetic field components with a wide range of 65,536 nT per axis and 32 Hz resolution. We use the vector magnetic field in Mars-centered solar orbital (MSO) coordinates provided by the "ss" data products. IUVS remotely senses the ultraviolet (UV) emissions in two wavelength ranges: far-UV (110–190 nm) and middle-UV (180–340 nm). IUVS has four working modes and it will telemeter a wide range of the Martian thermosphere near periapsis. We use "L1C limb scan" data products to obtain the brightness profiles of Lyα at 121.6 nm. Furthermore, the latest version of the data is adopted in this study.
The MAG data are processed specifically in two steps. First, we convert the three components of the magnetic field from MSO coordinates to the magnetic field-aligned (MFA) coordinates. The MSO coordinates are defined as follows: x-axis is parallel to the line connecting the Sun and Mars, z-axis is perpendicular to the orbital plane of Mars and points to the ecliptic north, and y-axis completes the right-handed system. The MFA coordinates are defined as follows: z-axis is parallel to the mean magnetic field, y-axis is perpendicular to the plane determined by the mean field and the line from Mars to the spacecraft, and x-axis completes the right-handed set. Second, we identify PCW events from the power spectrum obtained through fast Fourier transform using the following criteria: (1) The power spectral density of the transverse component is greater than 3 times that of the compressional component. The transverse power is calculated by summing the powers of the Bx component and the By component, and the compressional power is equal to the power of the Bz component. (2) The frequency of the PCW is between 0.5fcp and 1.5fcp; fcp is the local proton cyclotron frequency, which is calculated by magnetic field data. (3) The ellipticity of the PCW is less than −0.5. (4) The wave normal angle (WNA) of the PCW is less than 30°. (5) The wave duration is greater than 0.5 hr. Note that these criteria are used in order to ensure unbiased selection of PCWs over other waves related to ion–ion instabilities and similar criteria have been used by Romanelli et al. (2016) and Liu et al. (2020).
3. Analysis Results
3.1. The Plasma Environment
Figure 1 shows the plasma environment and magnetic field amplitude near Mars, as recorded by MAVEN from 14:00 UT on December 25 to 24:00 UT on 2016 December 27. During this time interval, MAVEN orbited Mars about 12 times and cyclically crossed the region of the solar wind, magnetosheath, magnetic pileup region, and geometrical shadow, which are marked using different colors in Figure 1(a). The empirical model of Trotignon et al. (2006) is employed here to determine the boundaries of different Martian regions. Figures 1(b) and (c) show the flux of the SWIA-measured ions and SWEA-measured electrons, respectively. The parameters of the solar wind protons that we are interested in, i.e., velocity, density, and temperature can be seen in Figures 1(d)–(f). Finally, Figure 1(g) shows the intensity of the interplanetary magnetic field (IMF).

Figure 1. The plasma environment of Mars observed by MAVEN from 14:00 UT on December 25 to 24:00 UT on 2016 December 27. (a) The altitude of MAVEN and its position relative to Mars, where black, green, yellow, and blue represent solar wind, magnetosheath, magnetic pileup region, and geometrical shadow, respectively. (b) Proton energy spectra from SWIA. (c) Election energy spectra from SWEA. (d)–(f) Proton velocity, density, and temperature in the solar wind from SWIA, respectively. (g) Interplanetary magnetic field (IMF) intensity from MAG. The area with enhanced density between the two black vertical dotted lines indicates a stream interaction region (SIR).
Download figure:
Standard image High-resolution imageOf special interest is the interval marked between the two black dotted lines. The proton and electron fluxes, and the IMF, as well as the velocity, density, and temperature of solar wind protons, are noticeably enhanced over the background, indicative of a typical SIR event (Huang et al. 2019). This SIR event lasted for approximately 30.3 hr, from 12:39 UT on 2016 December 26 to 18:57 UT on 2016 December 27. Moreover, Huang et al. (2019) listed the start and the end times of all SIR events from 2014 to 2018, and our choice of time is the same. Of note, this event was observed near the solar longitude (LS) of 287°–288°, and Mars was in the southern summer and global dust storm season, a season the hydrogen corona can expand into further distances. In this regard, it is conceivable that the large fluxes of solar wind protons measured during this SIR event would lead to more efficient charge exchange processes near Mars.
3.2. The Proton Aurora and Penetrating Protons
Near the perigee, IUVS scans the limb at altitudes between ∼100 and ∼250 km, and 10 individual scans of the Lyα 121.6 nm emission are made during each orbit. The limb-scan data from orbits 4350 to 4362 are shown as subpanels in Figure 2, with the color progressing in time from dark to light blue in each panel. Note that the Lyα data of orbits 4360 and 4361 are not provided in the MAVEN data archive. These intensity–altitude profiles are explicitly calculated by integrating the Lyα intensity at wavelengths between 121.2 and 122.4 nm for each limb scan.

Figure 2. IUVS-observed intensity–altitude profiles of Lyα emissions from MAVEN orbits 4350 to 4362. Each panel contains profiles from 10 limb scans, and the color from dark to light blue indicates the time sequence of the scan. Note that the data of orbits 4360 and 4361 are not provided by the MAVEN data archive.
Download figure:
Standard image High-resolution imageThe Lyα limb profile of orbit 4350 (Figure 2(a)) is typical of UV scans over quiet Martian atmospheric conditions: the Lyα brightness is, in general, flat at altitudes of 50–250 km, as it is produced by the resonant scattering of solar Lyα photons by the Martian hydrogen atoms (Lallement et al. 1985). Starting from orbit 4352 (Figure 2(c)), the profile of Lyα gradually peaks around the altitude of ∼140 km, and reaches a maximum radiance of ∼17 kR during orbit 4356. Both the altitude of Lyα enhancement and the peak intensity are consistent with previously reported proton aurora events (Deighan et al. 2018; Ritter et al. 2018). Though the IUVS data from orbits 4360 and 4361 are not provided, it is clear that the Lyα intensity returns to the normal level during orbit 4362.
The remote sensing measurements of IUVS on each orbit are taken from the relatively high to low SZA during this event (not shown in the figure), and the lower SZA case corresponds to the greater aurora intensity, which is consistent with the fact that the proton aurora occurs on the dayside (Deighan et al. 2018; Ritter et al. 2018; Hughes et al. 2019). The peak brightness of Lyα was approximately 17 kR near the periapsis of orbit 4356 in the SIR (Figures 2(f)–(j)).
Figure 3 shows the simultaneous observation of the proton aurora (upper panel) and penetrating protons (bottom panel) produced by ENAs measured by IUVS and SWIA at each periapsis. Figure 3(a) shows the Lyα enhancements during each orbit. In this calculation, the average Lyα intensity at altitudes above 150 km is considered as the background brightness. The net enhancements are calculated by subtracting the background brightness from the average value of Lyα intensity at altitudes of 120–150 km. The altitudes above 150 km are used for the background calculation since the proton aurora mostly occurs below 150 km altitude (Ritter et al. 2018). Lyα enhancements varied significantly over this time, with peaks ranging from 0.1 to 4.5 kR per orbit. The maxima of Lyα enhancements are obtained at the SZA value of 40°, which is the minimum SZA that the IUVS can perform through a limb scan during this interval. Here it should also be mentioned that the detected intensity of the Lyα line is also affected by CO2 absorption, which can contribute to its apparent variability (Gérard et al. 2019).

Figure 3. IUVS-measured Lyα enhancements and SWIA-measured forward (penetrating) protons. (a) The mean intensity of Lyα at altitudes of 120–150 km after subtracting the background intensity (average intensity above 150 km altitude). There are 10 observations, each of six to eight measurements, corresponding to 10 limb scans per orbit, with a color coded SZA of the tangent point at the peak. (b) The forward proton integral fluxes of each periapsis, which are obtained by integrating over the energy range of 500–1500 eV.
Download figure:
Standard image High-resolution imageFigure 3(b) shows the integral flux of penetrating protons at energies of 500–1500 eV, which is measured at the perigee of MAVEN and corresponds to the Lyα enhancements. It is worth noting that each black dot in Figure 3(b) is a single value, not the result of temporal integration. The method of Girazian & Halekas (2021), which is the improvement of the method used in Halekas et al. (2015a), is utilized to distinguish forward (penetrating) protons from those backscattered ones. The reason for choosing the integration energy range over 500–1500 eV is that the energies of ENAs are concentrated around 1 keV (Deighan et al. 2018). Clearly, the enhancements of Lyα are well in line with the increases of the penetrating proton fluxes, which can be attributed to the penetrating ENAs.
3.3. Observations of PCWs
Figure 4 shows the PCWs observed by MAG from orbits 4350 to 4362. Figure 4(b) shows the power spectral density of the magnetic field in the MFA coordinates (shown in Figure 4(a)); it can often be seen that there are distinctive fluctuations near the local proton gyrofrequency as marked using the solid magenta line. Using the criteria described in Section 2, we select and calculate PCW amplitude as shown in Figure 4(f). The wave amplitude of PCWs is mainly between 0.1 and 3 nT, with a maximum of 10 nT in orbit 4358. Compared with the time period before the SIR, the PCWs in the SIR region have stronger wave amplitude, and are in general greater than 1 nT per orbit. Moreover, no obvious PCWs were observed after the end of the SIR, indicating that solar wind activity plays an important role in generating PCWs. Figures 4(g)–(p) present the three-dimensional distribution of PCWs in MSO coordinates from orbits 4351 to 4360. The dayside of Mars, i.e., the hemisphere with X > 0, is shown in light gray, while the nightside of Mars is shown in dark gray. PCWs occurred during these 10 consecutive orbits and were mainly distributed on the dayside of Mars. It can also be seen that the intensity of PCWs in SIR orbits is significantly greater than that of non-SIR orbits. It is worth noting that MAVEN flies clockwise from the magenta asterisk perigee and Lyα enhancements are also observed in these orbits, suggesting a good temporal and spatial correlation between Lyα enhancements and PCWs.
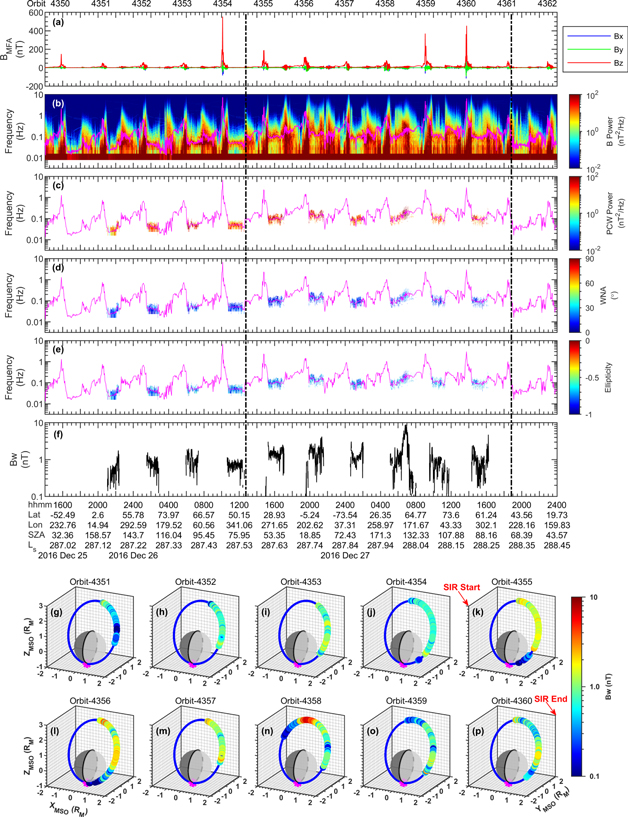
Figure 4. Proton cyclotron waves (PCWs) observed by MAG. (a) Bx , By , and Bz in the magnetic field-aligned (MFA) coordinates, where z-axis is parallel to the mean field, y-axis is perpendicular to the plane determined by the mean field and the line from Mars to the spacecraft, and x-axis completes the right-handed set. (b) Power spectral density of the magnetic field in the MFA coordinates. (c) The power spectral density, (d) wave normal angle (WNA), and (e) ellipticity of PCWs. The magenta lines in panels (b)–(e) represent the local proton gyrofrequency. (f) The wave amplitude of PCWs. The area between the two black vertical dotted lines indicates an SIR. (g)–(p) The amplitude of PCWs in the MSO coordinates in each orbit, with the periapsis marked by a magenta asterisk and the orbit of MAVEN marked by a blue curve. Light gray represents the dayside of Mars and dark gray represents the nightside of Mars.
Download figure:
Standard image High-resolution image3.4. Correlation Analysis
In this section we examine the relationship between the strength of Lyα enhancements and the forward proton fluxes, and the PCW intensity, respectively. The correlation coefficients between the maximum value of Lyα enhancements at altitudes of 120–150 km and forward proton fluxes between 500 and 1500 eV, as well as the average intensity of dayside PCWs at altitudes above 2000 km are shown in Figure 5. The correlation coefficient between Lyα enhancements and forward proton fluxes reaches 0.76, despite that the IUVS and SWIA data may be biased due to different detection modes. The good correlation between these two byproducts of ENAs indicates that ENAs may have an important impact on the dayside Martian thermosphere environment. Moreover, the correlation coefficient between Lyα enhancements and PCW intensity is close to 0.70, suggesting that pickup H+ generated by charge exchange can contribute significantly to the source of PCWs. To sum up, as two products of charge exchange, ENAs penetrate into the Martian atmosphere and release energies through a proton aurora and inverse charge exchange, while the pickup H+ mix with solar wind protons and excite the PCWs through plasma instability in the mean time.

Figure 5. The correlation coefficients (CCs) (a) between the Lyα enhancements and the forward proton fluxes (from orbits 4350 to 4359) and (b) between the Lyα enhancements and the PCW intensity (from orbits 4351 to 4359), which is the mean intensity of PCWs in the region of the SZA > 90° and altitude above 2000 km. Error bars indicate the standard deviation of the wave intensity on each orbit.
Download figure:
Standard image High-resolution image
4. Conclusions
In this paper, we have reported an interesting event in which PCWs and a proton aurora were simultaneously recorded by the MAVEN mission with their intensities evidently affected by the solar wind activity. During the course of this event, MAVEN observed PCWs in 10 consecutive orbital periods (from orbits 4351 to 4360) that were mainly distributed upstream of the bow shock with the amplitudes varying between 0.1 and 3 nT. Meanwhile, the proton aurora and the enhancements of penetrating proton fluxes were detected near the periapsis in eight orbital periods (from orbits 4352 to 4359). There is a good correspondence between the occurrence of PCWs and the proton aurora. Both the amplitude of PCWs and the brightness of the proton aurora increased considerably during the SIR event, demonstrating that an SIR has an important impact on the Martian space environment.
By applying the correlation analysis to the peak Lyα enhancements, we have found that its correlation coefficient is 0.76 with the forward proton fluxes, and is ∼0.7 with the PCW intensities. The close relationship between these phenomena, which are byproducts of the charge exchange processes, can play an important role upstream of Martian space. The energy input from the Sun to Mars via charge exchange results in various phenomena in the Martian dayside space over a wide altitude range of ∼100–6500 km, including auroras, proton deposition, and plasma waves. Although the physical mechanism to connect the excitation of PCWs and the proton precipitation at Mars remains limitedly understood, comprehensive investigation of these phenomena and the modulation effect of the solar wind activity can help approach improved understanding of the Sun–Mars system and the dynamic environments of other planets that lack an intrinsic magnetic field and have an extended H corona.
This work was supported by the B-type Strategic Priority Program of the Chinese Academy of Sciences (grant No. XDB41000000), the pre-research projects on Civil Aero-space Technologies (grant Nos. D020303, D020308, and D020104) funded by the China National Space Administration, the National Natural Science Foundation of China (grant Nos. 42188101, 42025404, 41974186, 42174188, 41904144, and 41904143), and the Fundamental Research Funds for the Central Universities (grant No. 2042021kf0016). The authors thank the MAVEN Science Team for providing the data.
Data Availability Statement
The multi-instrument measurements used for this study are publicly available at the NASA Planetary Data System (Halekas 2022 for SWIA level 2 (https://doi.org/10.17189/1414182), Mitchell 2022 for SWEA level 2 (https://doi.org/10.17189/1414181), Connerney 2022 for MAG level 2 (https://doi.org/10.17189/1414178), and Schneider 2022 for IUVS level 1c (https://doi.org/10.17189/1518964)).