


Abstract
We use a semiempirical model to investigate the radial acceleration relation (RAR) in a cold dark matter (CDM) framework. Specifically, we build 80 model galaxies covering the same parameter space as the observed galaxies in the SPARC database, assigning them to dark matter (DM) halos using abundance-matching and halo mass–concentration relations. We consider several abundance-matching relations, finding some to be a better match to the kinematic data than others. We compute the unavoidable gravitational interactions between baryons and their DM halos, leading to an overall compression of the original Navarro–Frenk–White (NFW) halos. Before halo compression, high-mass galaxies lie approximately on the observed RAR, whereas low-mass galaxies display up-bending "hooks" at small radii due to DM cusps, making them deviate systematically from the observed relation. After halo compression, the initial NFW halos become more concentrated at small radii, making larger contributions to rotation curves. This increases the total accelerations, moving all model galaxies away from the observed relation. These systematic deviations suggest that the CDM model with abundance matching alone cannot explain the observed RAR. Further effects (e.g., feedback) would need to counteract the compression with precisely the right amount of halo expansion, even in high-mass galaxies with deep potential wells where such effects are generally predicted to be negligible.
Export citation and abstract BibTeX RIS

Original content from this work may be used under the terms of the Creative Commons Attribution 4.0 licence. Any further distribution of this work must maintain attribution to the author(s) and the title of the work, journal citation and DOI.
1. Introduction
Recent observations have revealed tight correlations between visible baryons and the observed dynamics of galaxies, even in regions that are supposedly dominated by the dark matter (DM) halo (e.g., McGaugh et al. 2020). In the outermost galaxy regions, the circular speed along the flat part of the rotation curve correlates with galaxy luminosity, i.e., the Tully–Fisher relation (Tully & Fisher 1977). The correlation becomes even tighter once galaxy luminosity is replaced by baryonic mass (stars plus gas), leading to the baryonic Tully–Fisher relation (BTFR; e.g., McGaugh et al. 2000; Lelli et al. 2016a). In the innermost galaxy regions, the dynamical surface density given by the inner rise of the rotation curve correlates with the baryonic surface density, leading to a central density relation (Lelli et al. 2016c). Moreover, at each galactic radius, the observed acceleration along the radial direction (gobs) correlates with the gravitational field from the distribution of baryons (gbar), leading to the radial acceleration relation (RAR; e.g., McGaugh et al. 2016; Lelli et al. 2017b). In particular, the RAR shows a characteristic acceleration scale g†, below which the DM effect kicks in (gobs > gbar).
These findings question the DM paradigm, as they suggest that baryonic matter "knows" exactly the whole kinematic behavior of disk galaxies. It raises a conspiracy problem in the DM context: DM halos and baryonic disks have to closely collaborate (conspire) to make those correlations appear. On the other hand, these empirical relations were predicted a priori in the context of Milgromian Dynamics (MOND; Milgrom 1983), in which the classical laws of Newtonian dynamics are modified at low accelerations instead of adding DM.
Several groups have tried to reproduce the observed RAR in a cold dark matter (CDM) cosmology using hydrodynamic simulations of galaxy formation (Keller & Wadsley 2017; Ludlow et al. 2017; Garaldi et al. 2018; Tenneti et al. 2018; Dutton et al. 2019). All of these studies find a correlation between gtot = gbar + gDM and gbar, which is mathematically expected because the two quantities are not independent in simulated galaxies (contrary to the observational situation). The resulting correlation, however, is not necessarily comparable to the observed RAR. For example, Tenneti et al. (2018) found that the gtot–gbar relation is linear with no sign of a characteristic acceleration scale, while Ludlow et al. (2017) reported a value of g† = 2.6 × 10⁻¹⁰ m s−2. This is significantly higher than the observed one (Lelli et al. 2017a), with a formal discrepancy of 70σ (random) and 5.8σ (systematic). Ludlow et al. (2017) addressed this issue by doubling their stellar mass and hence gbar, which translates their relation into approximate agreement with the data. However, we will show that there is not really freedom to do this because gDM is also impacted; it is not a simple translation along one axis. Furthermore, it is not trivial to compare the intrinsic scatter of the observed RAR with that from simulated galaxies (Keller & Wadsley 2017; Garaldi et al. 2018; Dutton et al. 2019) because one needs to model observational errors, rotation curve sampling, and the covariance between gtot and gbar.
A different approach to study the RAR is using semiempirical analytic models in which baryonic disks are assigned to DM halos using abundance-matching prescriptions (Di Cintio & Lelli 2016; Desmond 2017; Navarro et al. 2017; Grudić et al. 2020; Paranjape & Sheth 2021). To achieve a fair comparison, model galaxies are supposed to match the properties of observed ones, such as baryonic mass and size. In addition, the model rotation curves have to be cut at both large and small radii to match the ranges that the observed rotation curves cover. For example, Navarro et al. (2017) removed the inner parts at R < 0.747Rd (Rd is the disk scale length), which, however, are present in many observed rotation curves from the SPARC database (Lelli et al. 2016b). In fact, the inner parts of the rotation curves are of great interest because the classical cusp-versus-core problem appears at small radii (e.g., see de Blok et al. 2008; Adams et al. 2014; Oh et al. 2015; Katz et al. 2017), so it is unclear how the models of Navarro et al. (2017) compare to observations.
When setting up baryonic disks and DM halos separately, one neglects the mutual gravitational interaction between these two components. The models of Navarro et al. (2017) completely neglect baryonic effects, assuming that DM halos preserve the "original" Navarro–Frenk–White (NFW) profile from DM-only cosmological simulations (Navarro et al. 1996). In contrast, Di Cintio & Lelli (2016) found a reasonable match to the RAR using a halo profile from hydrodynamic simulations (Di Cintio et al. 2014) that takes core formation from stellar feedback into account. Core formation is most efficient at stellar masses of ∼107–8 M⊙, leaving cusps in the halos of more massive galaxies with stellar masses of ∼1010–11 M⊙ (Katz et al. 2017, their Figure B1). Desmond (2017) took the approach of using a free parameter to account for a global halo contraction or expansion, finding it difficult to explain the detailed shape and small scatter of the RAR.
We wish to rigorously compute the gravitational interaction between baryons and DM halos as galaxies form; one should not simply drop a fully formed galaxy into a static DM halo. This is a necessary step to insure dynamical stability. Sellwood & McGaugh (2005) examined this problem by investigating the response of DM halos to the growth of baryonic disks. They numerically computed the profiles of the stabilized DM halos, finding that the initial NFW halos experienced adiabatic contraction due to baryonic compression (see also Abadi et al. 2010). This adiabatic compression leads to larger DM contributions to the final rotation curves and can alter the shape of the RAR (see Paranjape & Sheth 2021). Dutton et al. (2007) found that adiabatically contracted models cannot simultaneously reproduce the observed Tully–Fisher relation, size–luminosity relation, and luminosity function.
In this paper, we investigate the RAR in a CDM cosmology using the semiempirical approach, including a proper treatment of the compression of DM halos. We pose a simple and intentionally limited question: what happens if we compute the expected compression for models matched to the data? We do not attempt to model further effects (e.g., feedback) or claim to explain the RAR. Rather, we attempt to establish the prior expectation for a natural model prior to the complicating effects of baryonic physics (e.g., Chan et al. 2015) in the hope of elucidating the specific outcomes that these need to accomplish.
The paper is organized as follows. Section 2 describes our approach to building model galaxies, Section 3 presents their rotation curves and the corresponding RAR in the absence of adiabatic compression, and Section 4 describes the algorithm for implementing baryonic compression and illustrates how this affects the model rotation curves and the resultant RAR. We discuss our results in Section 5 and provide a brief summary in Section 6.
2. Model Setup
2.1. Stellar Disks
Late-type galaxies typically present a thin stellar disk whose surface mass density can be approximated with an exponential function,

where Σ0 is the central surface density, and Rd is the disk scale length. The total stellar mass is therefore

The gravitational contribution to the rotation curve is given by Freeman (1970),

where In and Kn are the modified Bessel functions of the first and second kind, respectively, and y = R/(2Rd). The surface mass density profiles and rotation curves are fully determined by two parameters: total stellar mass Md and disk scale length Rd.
The left panel of Figure 1 shows the M⋆–Rd parameter space covered by the SPARC sample, assuming a stellar mass-to-light ratio of 0.5 at 3.6 μm. To make our sample comparable to the SPARC data, we model galaxies covering the same parameter space and build a sample that includes 80 galaxies equally spaced in both  and
and  . For galaxies with a bulge, their disk masses are calculated by subtracting the bulge masses from the total stellar masses.
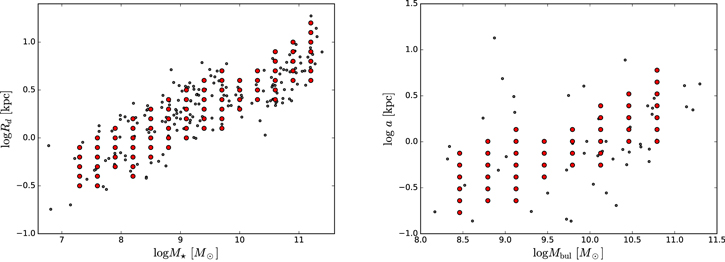
Figure 1. Parameter space of model galaxies (red points) compared with real galaxies (black points) from the SPARC database. In the left panel, the total stellar mass M⋆ and disk scale length Rd of model galaxies are chosen to match those of real galaxies (assuming a stellar mass-to-light ratio of 0.5 at 3.6 μm). In the right panel, the bulge mass Mbul and bulge scale length a of model galaxies with M⋆ ≥ 109 M⊙ are derived using empirical mass–mass and size–size relations (see text for details).
Download figure:
Standard image High-resolution image2.2. Central Bulges
Bulges are a common feature of early-type spiral galaxies that are often neglected in models based on exponential disks. Bulges are important because they dominate the high-acceleration (>10−9 m s−2) regime of the RAR, where gtot ≃ gbar. A model lacking bulges cannot explain this regime.
For models of massive galaxies (M⋆ ≥ 109 M⊙), we build two samples, one with a central bulge and one without. The central bulge is built using the Hernquist profile (Hernquist 1990),

where Mbul is the total bulge mass and a is the characteristic radius within which the enclosed bulge mass equals Mbul/4. We determine the bulge mass using the empirical correlation between bulge and total stellar masses from SPARC galaxies:

To determine the size parameter a, we use the disk size–bulge size relation,

which is derived from fitting the disk and bulge sizes of the SPARC galaxies. This is not a strong correlation, but it provides a realistic range of a values (Figure 1).
Bulges populate the high-acceleration end of the RAR; they are star-dominated with no clear need for DM. As such, a different choice of bulge model (Equation (4)), variations on Equations (5) and (6), or the scatter in size at a given mass only occur where gtot ≃ gbar for plausible models. Consequently, our results do not strongly depend on the precise form of these relations.
The cumulative mass distribution of the Hernquist profile is given by
and its contribution to rotation velocities is

This suffices to calculate the compression of a model, since we assume that the bulge component is spherical. However, for consistency with the treatment of real data for which only the projected light distribution is observed, we compute the projected surface brightness of the Henquist bulge and use this as the input to compress. Integrating the density along the line of sight, one obtains (e.g., Hernquist 1990)
where s = R/a, with R being the projected radius, and
for 0 ≤ s ≤ 1:
for 1 ≤ s ≤ ∞ . At s = 1, X(s = 1) = 1, the surface mass density has a finite value:

2.3. Gas Disks
Assuming a razor-thin exponential disk, we model the gas contribution with two parameters: total gas mass Mgas and gas scale length Rgas. The total gas mass is derived through the gas mass–stellar mass relation as in Chae et al. (2021),

with masses in solar units. This includes both atomic and molecular hydrogen gas (Lelli et al. 2016b). To account for helium, we multiply the derived mass by a factor of 1.33. Following Di Cintio & Lelli (2016), we specify the gas scale length using the empirical relation Rgas = 2Rd. The gas contribution is important in dwarf galaxies and the outermost parts of some spiral galaxies. In both cases, gtot is largely dominated by the DM halo, so the precise modeling of the gas distribution does not strongly affect our results, having only minor effects on gbar in the low-acceleration regime.
2.4. The Circumgalactic Medium
In addition to cold gas, galaxies are surrounded by coronae of warm–hot gas. This circumgalactic medium (CGM) may contain a baryonic mass comparable to that in the stars (Werk et al. 2014; Tumlinson et al. 2017; Bregman et al. 2021), albeit in a diffuse form distributed over a much larger volume (hundreds of kiloparsecs). We do not attempt to model this component, as it is not detected in individual SPARC galaxies, so the model RAR would not be compatible with the observed RAR. Indeed, the extended, diffuse nature of the CGM ensures that it will contribute negligibly to both axes of the RAR over the tens of kiloparsecs typically spanned by the SPARC data. There is some hint from lensing data (Brouwer et al. 2021) that the CGM might become important at larger scales and lower accelerations than we are interested in here.
2.5. DM Halos
The DM halos from N-body cosmological simulations can be described by the NFW halo (Navarro et al. 1996),
where ρs is the characteristic volume density, and rs is the scale radius. It is common to describe NFW halos using two parameters defined at the so-called "virial radius" r200 (within which the average halo mass density is 200 times the critical density of the universe): the halo concentration C200 and the halo mass M200. These two parameters are defined as

where G and H0 = 73 km s−1 Mpc−1 are the Newton and Hubble constants, respectively. We will use these two parameters to describe NFW halos in this paper and determine their values using M⋆–M200 relations (constant mass ratio or abundance matching) and halo mass–concentration relations.
2.5.1. Setting the DM Halo Mass: A Constant Mass Ratio
The total mass of a DM halo remains a difficult quantity to ascertain. A classic approach (e.g., Dalcanton et al. 1997) is to assume a constant ratio of normal to DM. Here we adopt

consistent with the findings of Mo et al. (1998). Models of this type fail badly (McGaugh & de Blok 1998), causing far too much scatter in the RAR. We include such a model here as an important historical point of reference.
2.5.2. Setting the DM Halo Mass: Abundance Matching
It is now widely recognized that a constant baryon fraction is not viable in terms of either kinematics (McGaugh et al. 2010; Posti et al. 2019) or the number density of galaxies (Guo et al. 2010; Behroozi et al. 2013; Moster et al. 2013). In the latter case, a constant stellar mass-to-halo mass ratio cannot reproduce the observed stellar mass function of galaxies (a Schechter function), starting from the theoretical DM halo mass function. Reproducing the observed stellar mass function requires a nonlinear correlation between stellar and halo mass that has become known as abundance matching.
Abundance matching has now become a popular tool to determine the stellar mass–halo mass relation (SMHMR). Observational methods using satellite kinematics (e.g., Conroy et al. 2007) and weak lensing (e.g., Mandelbaum et al. 2006; Leauthaud et al. 2012; Hudson et al. 2015) have also been used to measure the SMHMR. Here we consider different SMHMRs from abundance matching and apply them to kinematic data.
One curious aspect of abundance-matching relations (AMRs) is the nonlinearity of the relation between stellar and halo masses above and below the break in the Schechter function. Below the break, a large range of stellar mass is compressed into a narrow range of halo mass. Above the break, the situation is reversed, and a little stellar mass range goes a long way in terms of halo mass. This can be problematic, as there is a proclivity for abundance matching to predict DM halo masses for bright galaxies that are too large for the observed kinematics (e.g., McGaugh & van Dokkum 2021). In contrast, we expect the compression of the range of halo masses for low-mass galaxies to be helpful insofar as it is a step in the direction of making the DM halos of rather different galaxies look similar, as indicated by kinematics (McGaugh et al. 2007). Whether this is merely a numerical convenience or how the universe really works is a larger question.
Various AMRs have been proposed. These have nonnegligible differences at both the high- and low-mass ends (e.g., Guo et al. 2010; Moster et al. 2013, 2018; Kravtsov & Manwadkar 2021). In this work, we consider two AMRs that bracket most of the relations proposed in the literature: Behroozi et al. (2013) and Kravtsov et al. (2018). Both studies adopted the same parameterization function,
where the function f(x) is defined as

Behroozi et al. (2013) found that α = −1.412, γ = 0.316, δ = 3.508,  , and
, and  . This gives a relation close to that from Moster et al. (2013). Instead, Kravtsov et al. (2018) found a significantly different behavior at the high-mass end with the following parameters: α = −1.779, γ = 0.547, δ = 4.394,
  , and
, and  . Di Cintio & Lelli (2016) found that the Kravtsov et al. (2018) relation describes high-mass galaxies better than Moster et al. (2013) or Behroozi et al. (2013) because a galaxy with M⋆ ≃ 1011
M⊙ is assigned to a DM halo with M200 ≃ 1013
M⊙ rather than ∼1014–15
M⊙. As such, we use the Kravtsov et al. (2018) relation as our fiducial relation in this paper and present the results from other M⋆–M200 relations as reference.
. Di Cintio & Lelli (2016) found that the Kravtsov et al. (2018) relation describes high-mass galaxies better than Moster et al. (2013) or Behroozi et al. (2013) because a galaxy with M⋆ ≃ 1011
M⊙ is assigned to a DM halo with M200 ≃ 1013
M⊙ rather than ∼1014–15
M⊙. As such, we use the Kravtsov et al. (2018) relation as our fiducial relation in this paper and present the results from other M⋆–M200 relations as reference.
2.5.3. Setting the DM Halo Concentration
To derive halo concentrations, we use the halo mass–concentration relation, which has been extensively studied in galaxy formation simulations. This relation depends on cosmology and is sensitive to halo profiles (Macciò et al. 2008; Dutton & Macciò 2014). In the WMAP5 cosmology, the halo mass–concentration relation for the NFW profile is given by

Both the AMR and halo mass–concentration relation have significant scatter, but we assume an accurate match when sampling. With these two relations, we completely determine the DM halo for a given stellar mass.
3. The RAR for Noncompressed Halos
The total rotation curves of the model galaxies are given by the quadratic sum of the various mass contributions:

Figure 2 plots the rotation curves for four cases: disk-only galaxies with the AMR from Kravtsov et al. (2018), disk+bulge+gas galaxies with the AMR from Kravtsov et al. (2018), disk+bulge+gas galaxies with a constant M⋆/M200 = 0.05 from Mo et al. (1998), and disk+bulge+gas galaxies with the AMR from Behroozi et al. (2013). For illustration, we truncate the model rotation curves at 20Rd, comparable to the most extended rotation curves in the SPARC database. At small radii, the SPARC rotation curves are mostly observed at r > 0.5 kpc, so we apply this as the inner cutoff. Throughout the paper, we will use the same cutoff for all rotation curves and the RAR.
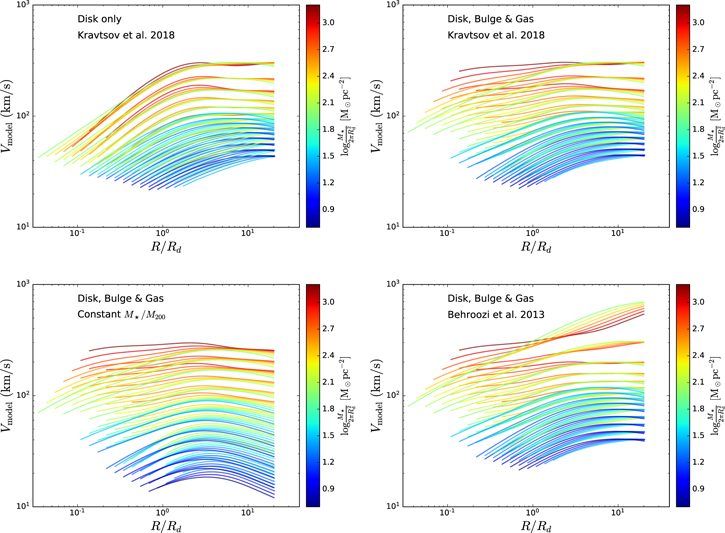
Figure 2. Rotation curves of the model galaxies assuming different M⋆–M200 relations. Galaxies are color coded by  (i.e., central surface stellar-mass densities for disk-only galaxies). The model rotation curves are cut at 0.5 kpc in the inner parts (see Figure 3 in McGaugh et al. 2020) and 20Rd in the outer parts, according to the range the SPARC rotation curves cover.
Download figure:
Standard image High-resolution imageWe color code rotation curves according to  , which is the central surface stellar-mass density for disk-only galaxies. As expected, galaxies with higher central surface mass densities rotate faster. In the disk-only case, the rotation curves are roughly self-similar because of the self-similarity of exponential disks and NFW halos, but high-mass galaxies rise too slowly in the inner parts with respect to real galaxies. When a bulge component is added for massive galaxies, the inner parts of the rotation curves become flat and more comparable to the SPARC rotation curves. This shows that the central bulge is an essential component to model a massive galaxy.
The imposed M⋆–M200 relations have a significant effect on the rotation curves. For low-mass galaxies, assuming M⋆/M200 = 0.05 leads to systematically smaller rotation velocities than abundance matching. This occurs because AMRs imply lower stellar fractions (M⋆/M200 ≪ 0.05) for dwarf galaxies, so the assumption M200 = M⋆/0.05 assigns a dwarf galaxy with a given M⋆ to a less massive DM halo. For high-mass galaxies, the Kravtsov et al. (2018) relation and the constant M⋆/M200 model give similarly flat rotation curves. The Behroozi et al. (2013) relation, however, presents much larger rotation velocities at large radii for high-mass galaxies because it predicts larger halo masses for a given stellar mass at the high-mass end. This would imply rising rotation curves at large radii, which are not observed in real galaxies.
We calculate gtot and gbar from the model rotation curves and baryonic contributions, respectively. They are plotted for each individual galaxy in Figure 3. Disk-only galaxies show a "hook" in the RAR that consistently bends upward due to an excess of DM at small radii. A similar phenomenon has been observed in Lelli et al. (2017a) when testing the emergent gravity theory of Verlinde (2011). In our CDM models, this occurs because exponential disks have a maximum value of gbar at R = 0.747Rd. At smaller radii, the value of gbar decreases toward the center. Given that the NFW model is cuspy, DM halos make significantly larger contributions to rotation curves at smaller radii. This leads to considerably larger total acceleration gtot, bending the curves upward. As such, the upwardly bending hook is a reflection of the core–cusp problem. A central bulge can significantly increase the baryonic mass density at small radii, so it effectively moves the radius at which the baryonic acceleration peaks further in. How far the turning point moves depends on how compact and massive the bulge is. All of the modeled bulges effectively move their turning points out of the observable range. As a result, massive galaxies with a bulge present a nonhooked RAR.

Figure 3. Predicted RAR using different M⋆–M200 relations. Black solid lines represent the observed RAR (Lelli et al. 2016a; McGaugh et al. 2016), and dotted lines are the lines of unity. The disk-only model predicts a hook-shaped RAR for individual galaxies with a turning point at R = 0.747Rd. The inner parts at R < 0.747Rd with increased opacity and thickness bend upward, showing a larger discrepancy from the observed RAR. The central bulges in massive galaxies effectively move the turning point further into the center and out of the observable range. The predicted RAR for low-mass galaxies is either systematically lower (constant M⋆/M200) or higher (AMRs) than the mean observed relation.
Download figure:
Standard image High-resolution imageThe RAR of low-mass galaxies is more sensitive to M⋆–M200 relations because they are DM-dominated. The constant M⋆/M200 model shows insufficient gravitational contributions from DM halos. One can adopt a lower M⋆/M200 ratio to achieve a better match, but the systematic hooks would persist. The Behroozi et al. (2013) relation implies a very high halo mass for the most massive galaxies in our sample, so the total accelerations are larger than expected at all radii. In fact, there are some models that lie well above the observed RAR. The DM halos derived using the Kravtsov et al. (2018) relation can better reproduce the observed RAR at the high-mass end.
To further investigate the effect of the M⋆–M200 relation, we check their corresponding BTFRs in Figure 4. The solid line is the BTFR calibrated by Schombert et al. (2020),

Since the model rotation curves may not remain flat at large radii, there is no clear definition for Vf . For illustrative purposes, we choose the velocities at R = 5Rd, given most of the SPARC rotation curves have become flat by this radius. We check that using a different radius does not affect our conclusion.

Figure 4. The BTFR from different M⋆–M200 relations. The solid line is the calibrated BTFR (Schombert et al. 2020) with a slope of 4 (McGaugh et al. 2021). The constant M⋆/M200 model recovers a slope of ∼3.0, as expected from the halo mass–velocity relation (Steinmetz & Navarro 1999). Models employing the AMRs provide a reasonable match to the observed BTFR below L*. Above this scale, the BTFR for bright galaxies is predicted to bend to higher velocities, consistent with the bend in the M⋆–M200 relations. This bend is not observed (Di Teodoro et al. 2021).
Download figure:
Standard image High-resolution imageAt large radii, DM halos dominate the rotation curves, so M200 ∼ V3. This implies that the imposed M⋆–M200 relation will imprint its shape onto the BTFR plot. When we assume a constant M⋆/M200, it leads to a linear BTFR but with a slope of ∼3, as expected. Abundance matching instead predicts a bend in the BTFR. The Kravtsov et al. (2018) relation is less bent, and so is the resultant BTFR. The Behroozi et al. (2013) relation bends significantly at the high-mass end, so we observe a big increase in the rotation velocities. A bent AMR is therefore in conflict with the linear BTFR.
4. Baryonic Compression of DM Halos
In the previous sections, we treated the baryonic components and DM halos separately, ignoring their mutual interaction. In this section, we use the compress code (Sellwood 2014) to compute the response to the primordial NFW halo to the formation of the baryonic galaxy. The final halo is no longer exactly NFW in form, but the combined system is in dynamical equilibrium.
4.1. The Compression Code
The DM halo must respond to the changing gravitational potential that results from the growth of the baryonic galaxy at its center. This evolution is often modeled as adiabatic, which is a good approximation even in the hierarchical cosmogony of ΛCDM (Choi et al. 2006). Young (1980) introduced an algorithm that conserves all three adiabatic actions (Jr , Jϕ , Jθ ). This is a major improvement over previous studies (e.g., Barnes & White 1984; Blumenthal et al. 1986; Ryden & Gunn 1987), which overstate the effects of compression (Sellwood 1999; Gnedin et al. 2004). Conserving the third action, the radial adiabatic invariant, effectively makes DM halos less susceptible to compression.
Sellwood & McGaugh (2005) developed Young's algorithm and applied it to the adiabatic contraction of DM halos. It starts with a given NFW halo and updates its density profile iteratively as baryons are added. Throughout the process, spherical symmetry is assumed, which significantly simplifies the computation. Its validity has been tested with N-body simulations by Jesseit et al. (2002). Using compress, we calculate the compressed DM halos for all 80 model galaxies that are built from the Kravtsov et al. (2018) relation.
4.2. Rotation Curves and RAR from Compressed Halos
To illustrate the effects of baryonic compression, Figure 5 shows the ratios of the rotation velocities of the compressed halos to that of the original NFW halos. The degree of halo compression depends strongly on the baryonic surface mass density. The halos of low surface density galaxies experience almost negligible adiabatic contraction, while those of high-surface-density galaxies are strongly compressed. As expected, baryonic compression is more significant at smaller radii, where the surface mass density is higher.
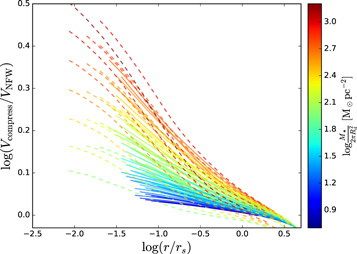
Figure 5. Ratios of the rotation velocities of compressed halos to pure NFW halos using the AMR from Kravtsov et al. (2018). Solid/dashed lines represent galaxies with stellar mass smaller/larger than 1010.5
M⊙, color coded by  . Solid lines show a perfect color gradient: higher surface mass densities present stronger compression effects. The break at 1010.5
M⊙ originates from the turning point in the AMR.
. Solid lines show a perfect color gradient: higher surface mass densities present stronger compression effects. The break at 1010.5
M⊙ originates from the turning point in the AMR.
Download figure:
Standard image High-resolution imageGalaxies with m⋆ > 1010.5 M⊙ (dashed lines in Figure 5) respond rather differently to baryonic compression. This occurs because they lie in a different regime of the AMR, in which DM halo mass increases more rapidly with stellar mass. The resulting stellar-to-halo mass ratio becomes smaller, so that baryonic effects turn out to be less sufficient to compress massive halos than expected in the low-mass region.
The baryonic effects have a direct implication for the RAR because larger rotation velocities correspond to larger total accelerations. The RAR from compressed halos and its residuals are shown in Figure 6. As mentioned earlier, the halos of low surface density galaxies experience less significant adiabatic contraction, so their location on the RAR remains roughly the same (see Figure 3). The halos of high-surface-density galaxies suffer strong baryonic compression, and the compression is more profound at small radii due to the strong gravitational pull of the central bulges. The net result is that their total accelerations are increased considerably after halo contraction, presenting a large discrepancy from the observed RAR.

Figure 6. The RAR (left) and its residuals (right) when baryonic compression is considered, assuming the AMR from Kravtsov et al. (2018). Symbols are the same as in Figure 3. The model shows a systematic deviation above the RAR. Compression effects are more significant at small radii, so that massive galaxies present a big upward shift with respect to Figure 3.
Download figure:
Standard image High-resolution image
The residual plot better illustrates the discrepancy. All model galaxies are clearly above the baseline across almost all radii. Since the NFW model predicts a falling rotation curve at large radii, some galaxies fall below the baseline. The "hooks" in low-mass galaxies become more distinct, given that the compressed halos are more concentrated at small radii. High-mass galaxies, though not hooked, experience substantial baryonic contraction and so never approach the one-to-one line observed at high accelerations.
5. Discussion
We have made a careful calculation of adiabatic compression for model galaxies well matched to the observed range of size and mass present in the SPARC data that define the RAR. A model with a constant stellar-to-halo mass ratio (as in Mo et al. 1998) produces an RAR with an enormous amount of scatter, much greater than observed. This is, in part, why such models were rejected as unworkable by McGaugh & de Blok (1998). More recent models built on the same principle (e.g., Di Cintio & Lelli 2016; Desmond 2017; Navarro et al. 2017) appear more successful because the assumption of a constant stellar-to-halo mass ratio has been replaced with a variable ratio from abundance matching. This has the effect of reducing the range of halo masses for the range of observed stellar masses, reducing the scatter in the RAR (Di Cintio & Lelli 2016).
Models that we built with AMRs have lower scatter in the RAR for the same reason. However, the scatter is not entirely negligible, and none of the models provide an entirely satisfactory match to the observed RAR. The problems encountered differ for high- and low-mass galaxy models.
The AMRs have a bend around a halo mass of 1012 M⊙. This imprints a scale on the predicted kinematics that is not clearly observed. In the Tully–Fisher plane, abundance-matching models perform well for low-mass galaxies but overpredict the velocities of high-mass galaxies. The severity of this problem depends on how sharp the bend in the AMR is. Of the models considered here, those built with the relation of Kravtsov et al. (2018) suffer less from this effect than those built with the relation of Behroozi et al. (2013). This problem manifests in the RAR plane as models with excessively large total accelerations.
A further problem that arises at high accelerations is that models with adiabatically compressed halos never reach the one-to-one line where gbar = gtot. This problem does not appear if we ignore compression; a sufficiently high-surface-brightness bulge or disk will be sufficiently dominant so that gbar ≈ gtot at gbar ≫ g†, and the model looks fine (e.g., Navarro et al. 2017). Unfortunately, this is an artifact of ignoring the inevitable gravitational response of the DM halo to the formation of the luminous galaxy. If we start from the initial NFW halos predicted by DM-only simulations, the high concentrations of baryons required to reach a high gbar have a strong effect on the central cusp of the DM halo, which compresses to maintain gtot > gbar. Consequently, one never expects to reach the observed one-to-one line.
Low-mass galaxy models form a sequence that might be considered a reasonable approximation of the observed RAR. However, these models generically display "hooks" at small radii. These are the manifestation of the cusp–core problem in bulgeless galaxy models. The centripetal acceleration gbar of an exponential disk has a maximum at a radius of 0.747Rd. This marks a maximum along the abscissa of the RAR plane for pure disk models. In contrast, the acceleration contributed by the DM halo increases monotonically to the center. Following any given model from the outside in, one follows a track of increasing acceleration in the RAR plane until the maximum in gbar is reached. The models then bend back, hooking away from the observed RAR as gtot continues to increase. These features 6 are a generic prediction of disk models in NFW halos.
The data do not clearly display the predicted upwardly hooking behavior. For example, the residuals around the mean RAR do not correlate with radius or R/Reff, where Reff is the stellar half-mass radius (Lelli et al. 2017a). There are many examples of galaxies in SPARC that have well-resolved rotation curves within 0.747Rd, so this behavior should be apparent if present. The predicted effect is not subtle.
Great care must be taken in evaluating both gbar and gtot at small radii. The first is sensitive to the adopted stellar mass-to-light ratio of the stars, while the second is sometimes subject to resolution effects. Indeed, there are some hints of hooks in the data but at a much smaller amplitude than predicted. We do not believe these features to be meaningfully significant, for the reasons just given. They scatter both upward and downward, 7 as expected for noise.
6. Conclusion
In this paper, we examined the RAR expected in ΛCDM by building 80 model galaxies. The models include both stars and gas, with exponential disks and Hernquist bulges chosen to match the observed range of properties in the SPARC database (Lelli et al. 2016a). Model galaxies are embedded in NFW halos. We consider several prescriptions for relating the DM halo mass to the stellar mass and calculate the effect of baryonic compression to elucidate the expected effects of the formation of the luminous galaxy on the mass distribution of the DM halo.
We identify at least three distinct problems: (i) the shape of the SMHMR, which overpredicts velocities for high-mass galaxies; (ii) the inability of our adiabatically compressed models to reach the one-to-one line at high accelerations; and (iii) the presence of upturned but unobserved hooks in the predicted RAR for low-mass galaxy models.
The first of these problems seems minor and yet intractable. It is minor insofar as the variation of the SMHMR obtained from abundance matching is approximately correct to explain the same variation indicated by kinematics. It is intractable in that there is inevitably a bend in the AMRs that simply is not present in kinematic data. Abundance matching imprints a mass scale M200 ≈ 1012 M⊙, while kinematics evince an acceleration scale g† ≈ 10−10 m s−2. The two are not obviously related. The mass scale of abundance matching predicts a bend in the plane of the BTFR where the acceleration scale is defined by this relation as a single power law (Equation (21); see McGaugh et al. 2020).
Problems (ii) and (iii) might conceivably be addressed with further baryonic physics that we have not considered, like feedback. It is an intentional choice on our part to separate these effects so that we can see what compression alone does. This sets the standard for what feedback (or other baryonic physics) needs to do in order to reconcile ΛCDM models with the observations. However, there are different problems that appear in distinct regimes, so it is not obvious that generic feedback effects will solve all problems. Indeed, many works that might resolve the cusp–core problem (e.g., Di Cintio et al. 2014) have their strongest effects on low-to-intermediate-mass galaxies while leaving high-mass galaxies unscathed. This addresses problem (iii) while leaving problem (ii) unaddressed. In any case, whatever mechanism is invoked must precisely undo the effects of compression at high surface densities without inducing too much scatter in the RAR. This unavoidably requires fine-tuning between gravitational and nongravitational baryonic effects on DM halos.
A deeper issue that we do not address is why the relations that we struggle to explain here, the BTFR and the RAR, were successfully predicted a priori by MOND (Milgrom 1983).
We are grateful to Jerry Sellwood for help and advice in using the COMPRESS code. The work of P.L., S.S.M., and J.M.S. is supported in part by NASA ADAP grant No. 80NSSC19k0570. S.S.M. also acknowledges support from NSF grant No. PHY-1911909. Y.T. is supported by Taiwan Ministry of Science and Technology grant No. MOST 110-2112-M-008-015-MY3. C.M.K. is supported by grant No. MOST 110-2112-M-008-005.
Footnotes
- 6
Hooks are not readily apparent in the models of Navarro et al. (2017) because they discontinued their plots at 0.747Rd.
- 7
While we find that pure CDM models predict upturned hooks due to the central cusp of the NFW profile, Bullock (2017, private communication) noted that SIDM predicts downturned hooks.