


Abstract
The weak r-process offers an explanation of the formation of lighter heavy elements 36 ≤ Z ≤ 47 in ultra-metal-poor stars. Magnetohydrodynamically driven supernovae are thought to be a robust astronomical site of the weak r-process and recently gave a good description of the observational abundance pattern of an extremely metal-poor star. However, the characteristics of nuclear reactions in the MHD nucleosynthesis are not as clear as in another site, that of core-collapse supernovae. In this paper, the trajectories of the MHD model are implemented into SkyNet network calculations. By varying the reaction rates of each type, the (α,n) reactions are much more active than other types of reactions, such as (n,γ), (p,γ), (n,p), and (α,p). A further detailed sensitivity study investigates the (α,n) reactions and lists the most influential ones over the whole range, and the impactful reactions on each element from Sr to Ag are tabulated.
Export citation and abstract BibTeX RIS

Original content from this work may be used under the terms of the Creative Commons Attribution 4.0 licence. Any further distribution of this work must maintain attribution to the author(s) and the title of the work, journal citation and DOI.
1. Introduction
The origin of elements heavier than iron in the cosmos has been intensively investigated in the past century, especially after the theoretical framework was established by Burbidge et al. (1957) and Cameron (1957). They outlined those elements observed in the solar system that can be explained by the following nucleosynthesis processes. The s-process (Käppeler et al. 2011; Reifarth et al. 2014) and the slow neutron capture process, where the timescale of neutron capture is generally longer than the β-decay timescale. It takes place during the asymptotic giant branch (AGB; Busso et al. 2001; Sneden et al. 2008) phase of low-mass stars; about half of the elements heavier than iron can be formed in the s-process. Opposite to the much faster β-decay in the s-process, the rapid neutron capture process (r-process; Arnould et al. 2007; Thielemann et al. 2011; Mumpower et al. 2016) proceeds via faster neutron capture reaction than β-decay; it therefore can go far from the valley of stability in the nuclei chart. Thirty-five neutron-deficient nuclei from 74Se to 196Hg are so-called P-nuclides, which contain more protons than other isotopes and are produced in the P-process (Arnould & Goriely 2003; Rauscher et al. 2013). The P-nuclides are generated by photodisintegration on the seeds' nuclei, which are created in previous nucleosynthesis mechanisms like the s-process. These above-dominated processes are not able to explain all the observations; other processes therefore are proposed, like the i-process (Abate et al. 2016; Hampel et al. 2016) and νp-process (Fröhlich et al. 2006; Wanajo et al. 2011).
Unlike the astrophysical observations of the s-process, which can be described pretty well by theory, the r-process still has uncertainties. The possible sites remain unconfirmed, since the r-process takes place in an extreme environment with high temperature and density within a short timescale, and only the stellar explosion can be the candidates, like the neutron star merger (NSM; Goriely et al. 2011; Korobkin et al. 2012; Mendoza-Temis et al. 2015), core-collapse supernovae (CCSNe; Arcones & Thielemann 2013; Burrows & Vartanyan 2021), and magnetohydrodynamic (MHD) ejection of rapidly rotating SNe. The gravitational waves of GW170817 detected by LIGO/VIRGO (Abbott et al. 2017) and the corresponding electromagnetic afterglow AT 2017gfo (Arcavi et al. 2017; Coulter et al. 2017; Cowperthwaite et al. 2017; Kasliwal et al. 2017) in 2017 were the first identification of a merger event of two neutron stars. The later electromagnetic observation discovered that the element strontium is produced (Watson et al. 2019), as well as heavy elements like lanthanide (Kasen et al. 2017; Pian et al. 2017). These signatures confirmed that the predicted kilonova afterglow of the NSM is a robust site of the r-process, but not unique in the cosmos (Côté et al. 2019). A CCSN (Burrows & Vartanyan 2021) is another conceivable spot. It accompanies the death of a massive star and gives birth to a neutron star or black hole. The current 3D models (Lentz et al. 2015; Radice et al. 2017; Skinner et al. 2019) unravel that this explosion could be a site of nucleosynthesis with its combination of moderate neutron exposure, high entropy, and fast expansion timescale, which ejects a board range of elements (Mumpower et al. 2016). Meanwhile, it also indicates that not all of the r-process nuclei can be produced in this scenario (Kajino et al. 2019).
The characteristic r-process abundance pattern in the solar system has three main peaks at around A ∼80, 130, and 195, corresponding to the nuclear magic number N = 50, 82, and 126 in the shell model. This solar r-abundance is accumulated by more than one nucleosynthesis process, while the ultra-metal-poor (UMP) star (Spite & Spite 1978) is believed to have been born in the early Galaxy and to have only experienced an individual synthesized process. The UMP star therefore can be a better benchmark of the theoretical models. Two types of elemental abundances are observed in the very old UMP stars: Sneden-like abundance (Sneden et al. 2008) favors the production of heavy elements, while Honda-like abundance (Honda et al. 2004) mainly focuses on the formation of the lighter elements. The abundances of heavy elements at 56 < Z < 83 are well in agreement with the solar r-process abundance, but the pattern of lighter elements 36 < Z < 47 is fairly scattered, which is no longer able to be explained by the canonical r-process.
The weak r-process (Truran et al. 2002) is so developed for explaining the elements with A < 130; it is also proposed as the charged-particle reaction (CPR) process (Woosley & Hoffman 1992; Qian & Wasserburg 2007) and the lighter-element primary process (Travaglio et al. 2004; Montes et al. 2007) in the literature. The weak r-process usually undergoes only a slightly neutron-rich or even proton-rich environment, leading to less neutron exposure than the main r-process. The neutron capture reaction hereby no longer dominates the element production, but is replaced by the CPR, like the (α,n) reaction (Bliss et al. 2017; Pereira & Montes 2016). Previous research has tabulated the key (α,n) reactions in the scenario of neutrino-driven winds after CCSNe (Bliss et al. 2018, 2020). In this paper, the sensitivity study of the (α,n) reaction in the magnetohydrodynamically driven SNe (MHD-SNe), which is another site of weak r-process, will be performed.
This paper is structured as follows: MHD-SNe and their parameterized trajectories are described in Section 2.1, and the method and details of the sensitivity study are introduced in Section 2.2. In Section 3, the results are presented, including the list of major influential reactions. Finally, the conclusions are given in Section 4.
2. Methods
2.1. MHD Model
The MHD-SNe are an energetic class of SNe, also called hypernovae. Their explosion energy can reach about 10 B (1 B = 1 Bethe, 1052 erg), while being 10 times larger than the canonical CCSN. The MHD-SN is driven by its strong magnetic fields and fast rotation of the PNS; it occurs only when the energy of the magnetic field is roughly in equipartition with the kinetic energy. The MHD-SN is an alternative robust astronomical site for the r-process; the latest report on the element abundance pattern of the extremely metal-poor star SMSS J200322.54–114203.3 (Yong et al. 2021) was explained successfully by the MHD model. The explosion mechanism of MHD was proposed originally in the 1970s (Bisnovatyi-Kogan 1970; LeBlanc & Wilson 1970; Meier et al. 1976) and was considered as a source of r-process elements in the mid-1980s (Symbalisty 1984; Symbalisty et al. 1985).
A number of three-dimensional (3D) simulation efforts have been made to understand the mechanism of the MHD-SNe; the initial 3D model for a 15 M⊙ progenitor, including sophisticated radiative transfer of neutrinos, is presented in Winteler et al. (2012). While the magnetic field amplifies from 5 × 10¹² G to 5 × 10¹⁵ G, corresponding to the ratio of magnetic to gravitational binding energy increasing 10,000 times, a successful full r-process up to the third peak A ∼ 195 is synthesized. A subsequential 3D model (Mösta et al. 2014) considers the microphysical finite-temperature equation of state (EOS) and a leakage scheme and lepton number exchange. It initially leads to strong bipolar jet formation, but afterward it is disrupted by a kink instability of the ultrastrong toroidal field near the rotation axis and then loses its jet feature. Further study (Mösta et al. 2015) has shown that the magnetorotational instability is a weak-field instability, while the scale toroidal field of the magnetar is small, and the MHD-driven explosions can be formed with the shape of a double lobe. But the r-process is not robust under this scenario (Mösta et al. 2018), and the elements beyond the second peak are reduced by a factor of 100 when the magnetorotational jets produced by the rapidly rotating core undergo a kink instability. The 3D simulations (Kuroda et al. 2020) of full general relativity with spectral neutrino transport show the shock wave is not revived after the bounce; expansion of the MHD-driven flows toward the polar directions is predominantly driven by the magnetic pressure. The most recent simulation (Obergaulinger & Aloy 2021) propagates the magnetically driven polar outflows with stronger magnetization, and the explosion reaches moderate energies of about 1 s. Generally speaking, the 3D simulations so far are still controversial, and the extremely high explosion energy of ∼10 B is hard to obtain by these models so far (Kuroda et al. 2020; Matsumoto et al. 2020); therefore, more studies are expected.
On the other hand, the 2D model continuously supports the MHD-SN as a conceivable site of r-process. Various numerical simulations are performed by investigating the features, including magnetic fields, rotation rates, and neutrino luminosity. The first 2D adiabatic model showed successful results in 2006 (Nishimura et al. 2006), although the effects of neutrino cooling and heating are ignored. Two types of the characteristic explosion are shown in Nishimura et al. (2015): prompt magnetic jets, with strong initial magnetic fields above 1015 G around the surface of the PNS and rapid rotation, promptly explode just after the bounce and launch a strong shock wave along with the rotational axis. The heavy nuclei including actinides can be produced here. The delayed magnetic jets, with weak initial magnetic fields and rotation, take about 10–100 ms after the bounce, while the magnetic fields increase owing to the wrapping. When the magnetic fields grow up to 1015 G, the stalled shock wave revives and ejects. The nuclei synthesized in this scenario cannot exceed the second peak A ∼ 130, where identified as the site of weak r-process. By considering the fission fragment distributions from the recycling of material (Shibagaki et al. 2016), the r-process abundance peaks are still well produced in the MHD-SNe. While introducing the magnetorotational instability into the MHD-SNe (Nishimura et al. 2017), not only the weak r-process elements but also the intermediate-mass nuclei are formed.
In the present work, the 2D model from Reichert et al. (2021a), developed by a series of studies (Obergaulinger & Aloy 2017, 2020; Aloy & Obergaulinger 2021; Obergaulinger & Aloy 2021), will be employed to run the reaction sensitivity study. This model includes parameterized rotation, magnetic field, and a self-consistent neutrino treatment. The simulation is based on the model 35OC (Woosley & Heger 2007), which has 35 M⊙ for the initial mass of the star. While the collapse occurs, the mass is 28.1 M⊙ with an iron core of mass 2.02 M⊙. The angular velocity is 1.98 Hz at the center and 0.1 Hz at the surface of the iron core. The poloidal and toroidal components of the magnetic field at the core are 1.7 × 10¹⁰ G and 1.7 × 10¹¹ G, respectively.
Four models are calculated by varying the magnetic field, rotational velocity, timescale, explosion energy, mass ejection, and ratio of rotational/magnetic to gravitational energy of the PNS. A huge number of tracers of these models are generated to record the density, temperature, radius, electron fraction (Ye), neutrino luminosity, and energies during the evolution. The weak r-process, where the elements reach the second r-process peak around A ∼ 130, is successfully synthesized mainly by the models 35OC-Rs and 35OC-Rw. Ten tracers of the weak r-process group from model 35OC-Rs (Reichert et al. 2021b) will be implemented into the network calculation; the entropy versus Ye and maximum temperature versus density of these tracers are shown in Figure 1. By comparing these two plots with Figures 3 and 4 in Reichert et al. (2021b), the 10 tracers basically favor the low entropy of the whole sample, while the other three parameters are well representative. The mean value of the 10 tracers is a few kB/n less than the peak value of 35OC-Rs, which indicates that the present work generally reflects the character of MHD-SNe with relatively lower entropy conditions.
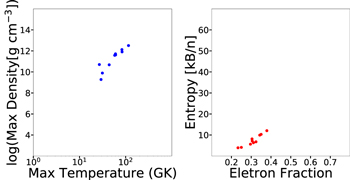
Figure 1. Left: maximum temperature vs. density of the 10 tracer particles from 35OC-Rs. Right: electron fraction vs. entropy for each tracer at T = 5.8 GK.
Download figure:
Standard image High-resolution imageTheir abundances are shown in Figure 2, with the discrepancies mainly on the second peak A ∼ 130. Some tracers have a pretty strong second peak, similar to a solar abundance like tracer 2, while the amplitude of the second peak of some other tracer is an order of six less than the first peak, like tracer 6. Tracer 4 shows a special pattern with a feeble iron peak and elements beyond the second peak, even reaching to A ∼ 190.

Figure 2. The abundance pattern of 10 representative tracers from model 35OC-Rs. Most patterns have similar strengths of iron peak and the first peak A ∼ 80, but scattered off at the second peak A ∼ 130. Tracer 4 has an extremely weakened iron peak and extends to A ∼ 190.
Download figure:
Standard image High-resolution image2.2. Reaction Rate Network
The nuclear reaction network code SkyNet (Lippuner & Roberts 2017), consisting of 7841 nuclei and 95,455 reactions, is employed in this literature. It includes a nuclear statistical equilibrium (NSE) solver, Helmholtz EOS, and electron screening corrections. SkyNet reads the density, electron fraction, and temperature as a function of evolution time from the MHD tracers, and the entropy is calculated by the EOS.
SkyNet uses nuclear reaction rates taken from the JINA-REACLIBV2.0 database (Cyburt et al. 2010), and the baseline (or reference) reaction rates in this work are also from it. A total of 1683 (α,n) reactions from Mn (Z = 25) to Sn (Z = 50) are extracted from the JINA-REACLIBV2.0 database. For each individual reaction, three calculations are run with all 10 trajectories: the baseline, reaction rate increased 100 times, and reaction rate decreased 100 times. In total, 50,490 network evolutions of (α,n) reactions are performed. The sensitivity of these reactions to a specific element is determined by the difference of abundance between the baseline and the varied rates.
Besides the (α,n) reaction, a couple of other types of reactions are supposed to play roles after NSE breakout (Woosley & Hoffman 1992) in the weak r-process. Here, the (n,γ), (p,γ), (α,p), (n,p) reactions of isotopes from Mn to Sn are investigated by their entire impact on the final abundance.
3. Results and Discussion
3.1. Type of Reactions
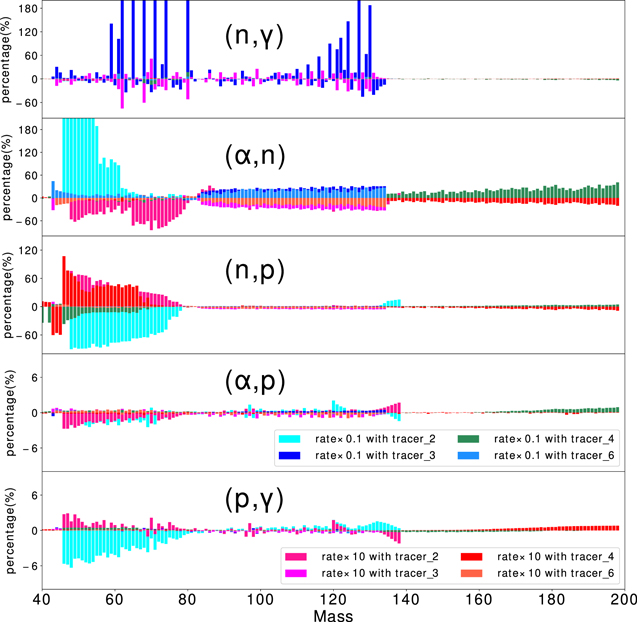
After the NSE phase breakdown, various types of reactions play their roles in the evolution to move matter toward high Z. It is critical to know which ones among this huge number of reactions dominate the nucleosynthesis, in order to lead scientist focus on them in both theory and experiments. It would be more efficient to investigate the impact of the types rather than the tremendous reactions individually. The types of (α,n), (n,γ), (p,γ), (n,p) and (α,p) of isotopes from Mn (Z = 25) to Sn (Z = 50) are selected from the rate database. Each type includes about 1600 reactions; the rates of them and their reverse reactions are removed from the REACLIB database and entirely increased 10 times or decreased 10 times. Then, they were implemented into the network and run with the 10 trajectories. The relative discrepancies in percentage between them and the baseline on four representative tracers are shown in Figure 3. Tracers 2, 3, and 6 represent the weak r-process abundance pattern with a strong, medium, and weak second peak, respectively. The pattern of tracer 4 is between the classic weak r-process and main r-process, since it has lower electronic fraction, and thus more fuel is available for the nucleosynthesis to reach mass number A ∼ 190.
Figure 3. The discrepancies of abundance as a function of mass number between reaction rate variation and the baseline of (α,n), (n,γ), (p,γ), (n,p), and (α,p) shown in percentage. The reaction rates of each type are entirely increased or decreased 10 times with four representative tracers; some bars in (α,n) and (n,γ) are out of range, as they are too much larger than the value of the main part.
Download figure:
Standard image High-resolution image
The most active type is the (α,n) reaction; it changes the final abundances not only on the shown tracers in the figure but also on the remaining ones. The elements in the iron peak of tracer 2 are severely influenced by the (α,n) reaction; the decreased rates could enrich their abundance more than a couple of times, which is out of the range in the figure. This illustrates that the reaction flow toward high Z mainly relies on the (α,n) reaction under this condition, while the slower rate prevents the seeds' nuclei from going further and therefore stack; and vice versa while the reverse reaction rate is enhanced. The impacts of (α,n) to tracers 3 and 6 are mild compared to those of tracer 2, but still obvious over the whole range of mass number. This result means that the dominated reaction in the weak r-process under the current MHD-SN model is (α,n), which is in good agreement with the study of CCSNe. The timescales of different types of reactions show that the (α,n) reaction is fastest during the sensitive temperature and determine the CCSN nucleosynthesis evolution (Bliss et al. 2017). The dominated role of the (α,n) reaction in the weak r-process is thus supported by both timescale and sensitivity study of nuclear reactions, and in the scenario of both CCSNe and MHD-SNe.
The neutron capture reaction (n,γ), which dominates in the main r-process, has limited influence here. It favors the tracers with a medium second peak of the abundance pattern in Figure 2, like tracer 3. The decreased (n,γ) significantly enriched the elements located between 60 and 80 and the second peak. But the matter between them is barely changed, which means that other reactions push the synthesis from iron peak to the high-Z zone, while the (n,γ) only affects the elements' abundances around the second peak. This means that the (n,γ) is not the driving force at the key stage of the weak r-process. On the other tracers, the (n,γ) seldom plays a key role in the evolution.
The (n,p) reactions impact the elements around iron peak in a few tracers; this is consistent with the study from Bliss et al. (2017). They figured out that when the temperature is above 4.2 GK, the (n,p) reactions are main charge-particle reactions. This means that this type of reaction principally plays its role at the early stage of the weak r-process after NSE, which is why its influences concentrate around the seeds' nuclei but barely on the heavy nuclei zone, as shown in Figure 3.
Comparing to the key of (α,n), the (α,p) reactions have minor impact on the final abundance. Because the weak r-process takes place at the neutron-rich side of the stability valley. Once an α-particle and a nucleus fuse to a compound nucleus, it is much more easy to evaporate a neutron rather than a proton. Thus, we can see only a few percent difference, shown in Figure 3. The (p,γ) reactions play a key role in proton-rich environments like the νp-process; however, in these current tracers with Ye lower than 0.5, it has much less influence than others.
3.2. Key (α,n) Reactions
The impact factor R is defined as

where i designates the index of atomic number. Either the increased or deceased rate of a reaction resulting in a R(i) less than 0.9 or more than 1.1 will be identified as an influential reaction. These reactions are tabulated in Table 1; they are mainly from the region Z from 29 to 34 and A from 80 to 90. The influences of the top several reactions spread over a pretty wide range, because they proceed in the most sensitive temperature range for the (α,n) reactions. As Bliss et al. (2017) figured out, at the early phase of weak r-process (α,n) reactions do not play the leading role but are replaced by other reactions. For instance, for tracer 2, the Ye is about 0.24 after the NSE breakdown, which promotes the neutron capture reactions driving the seed nuclei away from the stability valley quite vertically, so the (α,n) of iron peak isotopes even not sensitive to themselves. With decreasing temperature, the (α,n) gradually manages the synthesis and exhibits its most influence while the reaction flow reaches the zone of Z = 29–34. The increased reaction rates of these isotopes rapidly consume the seed nuclei and thus weaken the abundances of the iron peak. On the other hand, their impacts on the production of heavier elements are even much larger than those of neighboring nuclei. For example, for the element Mo, the (α,n) reactions of 103Mo, 89Nb, and a couple of other neighboring nuclei also have an impact on its abundance, but the R(i) are one order less than the top reactions on Table 1. Because both the temperature and density decrease as the synthesis goes on, the (α,n) reactions of heavier isotopes are not able to have universal influence, as in the early stage, and thus have limited impact to the nuclei of its neighbor zone. The isotopes on Table 1 extremely favor the decay mode of β delayed neutron emission, for instance, the 79–81Zn uniquely have this mode among the zinc isotopic chain. The β delayed neutron emission (Roberts et al. 1939) affects the even–odd fluctuation in r-process abundance (Suzuki et al. 2018), which usually requires a high Q value of the neutron-rich isotope. Here the correlation between it and the (α,n) reaction is found in the weak r-process under the MHD-SN scenario.
Table 1. Reaction Rate Variations That Affect Most Elements
| Reaction | Z of Element | Tracer |
|---|---|---|
| 80Zn(α,n) | 25–28, 33–52 | 1, 2, 3, 6 |
| 79Zn(α,n) | 25–27, 34–52 | 1, 2, 3, 6 |
| 81Zn(α,n) | 25–28, 34–46, 48–52 | 2, 3 |
| 81Ga(α,n) | 25–28, 34–45, 47, 48, 50–52 | 2, 8 |
| 79Cu(α,n) | 25–29, 52–66 | 2, 4 |
| 82Ge(α,n) | 25–27, 42–52 | 2, 8 |
| 83Ge(α,n) | 25–28, 44–52 | 2, 8 |
| 88As(α,n) | 25–29, 33–39 | 2 |
| 87As(α,n) | 25–29, 33–38 | 2 |
| 84Ge(α,n) | 26–29, 32, 33, 50–52 | 2, 8 |
| 79Ga(α,n) | 44–52 | 8 |
| 88Se(α,n) | 25–27, 34–39 | 2 |
| 90Se(α,n) | 25–27, 34, 36–39 | 2 |
| 86As(α,n) | 25–28, 35, 36, 38 | 2 |
| 78Ni(α,n) | 25–29 | 2, 3 |
| 86Ge(α,n) | 25–29, 32 | 2 |
| 89As(α,n) | 25–28, 33, 35 | 2 |
Download table as: ASCIITypeset image
The weak r-process explains the abundance of elements 36 < Z < 47 of UMP stars. Table 2 tabulates the impactful reactions for given elements from krypton to silver, including the value of reaction varied, the R(i), and the corresponding tracers. These reactions are selected by two categories: group I contains the ones with the largest R(i), and group II lists the neighbor isotopes of the target element. Group I basically coincides with the reactions in Table 1, which has universal impact over the whole range of elements. The 80Zn, 81Ga, and 82Ge among these isotopes are closed shell nuclei with N = 50, in particular 80Zn, which holds the top position on every subtable. These isotopes with shell closure are bottlenecked at the early phase of the nucleosynthesis since the equilibrium of (n,γ)–(γ,n). The reaction flow is therefore slowed down here, so the enhanced reaction rates of (α,n) provide an additional driving force to revive it. The (α,n) reactions move along with the direction of slope = 2(Z+2,N+1) in the nuclei chart, so the heavier closed shell nuclei with N = 50 like 83As, 84Se, 85Br, and 86Kr are detoured and replaced by 87,88As, 88–90Se, etc. The reactions of 78,79Zn, 79,70Ga, and 80,81Ge also have apparent influence over a wide range, as they already reach the gateway of the N = 50 shell closure. Most reactions in Table 2 expose their sensitivity, while the reaction rate increased 100 times, except for the 82Ge. Both the increase and decrease of its rate impact the abundances on most elements at similar level besides Kr and Y. Unlike the other N = 50 closed shell nuclei, 80Zn and 81Ga mainly show their influence under rate-enhancing conditions, the decreased rate of 82Ge presents comparable effect indicates that the (α,n) reaction is irreplaceable at this point, once it is reduced the path for moving matter toward the high-mass region will be suppressed.
Table 2. Influential Reactions on Elements 36 ≤ Z ≤ 47
| Element | Reaction | Rate varied | R(i) | Tracer |
|---|---|---|---|---|
| Kr | 80Zn(α,n) | 100 | 0.294, 0.172 | 3, 6 |
| (Z = 36) | 88Se(α,n) | 100 | 0.207 | 2 |
| 90Se(α,n) | 100 | 0.201 | 2 | |
| 81Ga(α,n) | 100 | 0.185 | 8 | |
| 79Zn(α,n) | 100 | 0.179, 0.115 | 3, 6 | |
| 78Zn(α,n) | 100 | 0.158, 0.095 | 3, 6 | |
| 87As(α,n) | 100 | 0.169 | 2 | |
| 88As(α,n) | 100 | 0.163 | 2 | |
| 89Se(α,n) | 100 | 0.156 | 2 | |
| 81Zn(α,n) | 100 | 0.109, 0.082 | 3, 6 | |
| 86As(α,n) | 100 | 0.104 | 2 | |
| 79Ga(α,n) | 100 | 0.073 | 8 | |
| 80Zn(α,n) | 0.01 | 0.042, 0.045 | 3, 6 | |
| 93Kr(α,n) | 100 | 0.011 | 6 | |
| Rb | 80Zn(α,n) | 100 | 0.303, 0.182 | 3, 6 |
| (Z = 37) | 81Zn(α,n) | 100 | 0.201, 0.112 | 8, 3 |
| 79Zn(α,n) | 100 | 0.186, 0.121 | 3, 6 | |
| 78Zn(α,n) | 100 | 0.163, | 3 | |
| 90Se(α,n) | 100 | 0.174 | 2 | |
| 88Se(α,n) | 100 | 0.173 | 2 | |
| 87As(α,n) | 100 | 0.148 | 2 | |
| 88As(α,n) | 100 | 0.143 | 2 | |
| 89Se(α,n) | 100 | 0.129 | 2 | |
| 82Ge(α,n) | 100, 0.01 | 0.048, 0.046 | 2 | |
| 79Ga(α,n) | 100 | 0.084 | 8 | |
| 89As(α,n) | 100 | 0.067 | 2 | |
| 85As(α,n) | 100 | 0.058 | 2 | |
| 87Se(α,n) | 100 | 0.513 | 2 | |
| 80Zn(α,n) | 0.01 | 0.046, 0.045 | 3, 6 | |
| 91Br(α,n) | 100 | 0.018 | 2 | |
| 94Kr(α,n) | 100 | 0.010 | 2 | |
| Sr | 80Zn(α,n) | 100 | 0.298, 0.196 | 3, 6 |
| (Z = 38) | 81Ga(α,n) | 100 | 0.208, 0.093, 0.07 | 8, 6, 2 |
| 79Zn(α,n) | 100 | 0.185, 0.131 | 3, 6 | |
| 78Zn(α,n) | 100 | 0.158 | 3 | |
| 90Se(α,n) | 100 | 0.140 | 2 | |
| 88Se(α,n) | 100 | 0.129 | 2 | |
| 87As(α,n) | 100 | 0.119 | 2 | |
| 88As(α,n) | 100 | 0.117 | 2 | |
| 82Ge(α,n) | 100, 0.01 | 0.059, 0.057 | 2 | |
| 81Zn(α,n) | 100 | 0.108 | 3 | |
| 80Ga(α,n) | 100 | 0.068 | 8 | |
| 80Zn(α,n) | 0.01 | 0.047, 0.043 | 6, 3 | |
| 83Ga(α,n) | 100 | 0.059 | 2 | |
| 86As(α,n) | 100 | 0.058 | 2 | |
| 87Se(α,n) | 100 | 0.030 | 2 | |
| 91Br(α,n) | 100 | 0.017 | 2 | |
| 94Kr(α,n) | 100 | 0.016 | 2 | |
| 93Kr(α,n) | 100 | 0.010 | 2 | |
| Y | 80Zn(α,n) | 100 | 0.309, 0.205 | 3, 6 |
| (Z = 39) | 81Ga(α,n) | 100 | 0.227 | 8 |
| 79Zn(α,n) | 100 | 0.180, 0.137 | 3, 6 | |
| 78Zn(α,n) | 100 | 0.159, 114 | 3, 6 | |
| 90Se(α,n) | 100 | 0.118 | 2 | |
| 88As(α,n) | 100 | 0.110 | 2 | |
| 81Zn(α,n) | 100 | 0.108, 0.097 | 3, 9 | |
| 87As(α,n) | 100 | 0.106 | 2 | |
| 88Se(α,n) | 100 | 0.101 | 2 | |
| 79Ga(α,n) | 100 | 0.087 | 8 | |
| 89Se(α,n) | 100 | 0.072 | 2 | |
| 80Zn(α,n) | 0.01 | 0.498, 0.439 | 6, 3 | |
| 84Ge(α,n) | 100 | 0.040 | 8 | |
| 91Br(α,n) | 100 | 0.206 | 2 | |
| 94Kr(α,n) | 100 | 0.011 | 2 | |
| 93Kr(α,n) | 100 | 0.010 | 2 | |
| 85Y(α,n) | 100 | 0.002 | 6 | |
| Zr | 80Zn(α,n) | 100 | 0.317, 0.213, 0.134 | 3, 6, 1 |
| (Z = 40) | 81Ga(α,n) | 100 | 0.224 | 8 |
| 79Zn(α,n) | 100 | 0.189, 0.142, 0.063 | 3, 6, 1 | |
| 78Zn(α,n) | 100 | 0.168, 118 | 3, 6 | |
| 81Zn(α,n) | 100 | 0.115, 101, 0.070 | 3, 6, 8 | |
| 82Ge(α,n) | 100, 0.01 | 0.091, 0.092 | 8 | |
| 79Ga(α,n) | 100 | 0.084 | 8 | |
| 88As(α,n) | 100 | 0.089 | 2 | |
| 90Se(α,n) | 100 | 0.087 | 2 | |
| 83Ge(α,n) | 100 | 0.079 | 8 | |
| 87As(α,n) | 100 | 0.081 | 2 | |
| 89Se(α,n) | 100 | 0.045 | 2 | |
| 104Rh(α,n) | 0.01 | 0.021 | 5 | |
| 121Tc(α,n) | 100 | 0.018 | 6 | |
| 105Rh(α,n) | 0.01 | 0.016 | 5 | |
| 119Tc(α,n) | 100 | 0.016 | 6 | |
| 89Nb(α,n) | 0.01 | 0.019 | 6 | |
| Nb | 80Zn(α,n) | 100 | 0.320, 0.219, 0.095 | 3, 6, 1 |
| (Z = 41) | 81Ga(α,n) | 100 | 0.231 | 8 |
| 79Zn(α,n) | 100 | 0.191, 0.147, 0.065 | 3, 6, 1 | |
| 82Ge(α,n) | 100, 0.01 | 0.097, 0.098 | 8 | |
| 78Zn(α,n) | 100 | 0.169, 122 | 3, 6 | |
| 81Zn(α,n) | 100 | 0.116, 103, 0, 061 | 3, 6, 1 | |
| 79Ga(α,n) | 100 | 0.086 | 8 | |
| 83Ge(α,n) | 100 | 0.084 | 8 | |
| 88As(α,n) | 100 | 0.074 | 2 | |
| 80Ga(α,n) | 100 | 0.072 | 8 | |
| 90Se(α,n) | 100 | 0.070 | 2 | |
| 87As(α,n) | 100 | 0.064 | 2 | |
| 88Se(α,n) | 100 | 0.047 | 2 | |
| 89As(α,n) | 100 | 0.026 | 2 | |
| 121Tc(α,n) | 100 | 0.016 | 6 | |
| 119Tc(α,n) | 100 | 0.015 | 6 | |
| 89Nb(α,n) | 0.01 | 0.013 | 6 | |
| Mo | 80Zn(α,n) | 100 | 0.326, 0.224, 0.099 | 3, 6, 1 |
| (Z = 42) | 81Ga(α,n) | 100 | 0.234, 0.034 | 8, 3 |
| 82Ge(α,n) | 100, 0.01 | 0.108, 0.110 | 8 | |
| 79Zn(α,n) | 100 | 0.195, 0.149, 0.066 | 3, 6, 1 | |
| 78Zn(α,n) | 100 | 0.173, 124 | 3, 6 | |
| 81Zn(α,n) | 100 | 0.119, 106, 0, 063 | 3, 6, 1 | |
| 83Ge(α,n) | 100 | 0.094 | 8 | |
| 79Ga(α,n) | 100 | 0.086 | 8 | |
| 80Ga(α,n) | 100 | 0.072 | 8 | |
| 81Ge(α,n) | 100 | 0.059 | 8 | |
| 90Se(α,n) | 100 | 0.049 | 2 | |
| 87As(α,n) | 100 | 0.045 | 2 | |
| 88Se(α,n) | 100 | 0.028 | 2 | |
| 121Tc(α,n) | 100 | 0.020 | 6 | |
| 119Tc(α,n) | 100 | 0.018 | 6 | |
| 89Nb(α,n) | 0.01 | 0.016 | 6 | |
| 103Nb(α,n) | 0.01 | 0.011 | 6 | |
| 103Mo(α,n) | 100 | 0.010 | 6 | |
| Tc | 80Zn(α,n) | 100 | 0.338, 0.225, 0.087 | 3, 6, 1 |
| (Z = 43) | 81Ga(α,n) | 100 | 0.254 | 8 |
| 79Zn(α,n) | 100 | 0.202, 0.149, 0.057 | 3, 6, 1 | |
| 82Ge(α,n) | 100, 0.01 | 0.111, 0.111 | 8 | |
| 78Zn(α,n) | 100 | 0.180, 124 | 3, 6 | |
| 81Zn(α,n) | 100 | 0.124, 107, 0.055 | 3, 6, 1 | |
| 79Ga(α,n) | 100 | 0.095 | 8 | |
| 83Ge(α,n) | 100 | 0.096 | 8 | |
| 80Ga(α,n) | 100 | 0.080 | 8 | |
| 77Zn(α,n) | 100 | 0.072 | 3 | |
| 76Zn(α,n) | 100 | 0.062 | 3 | |
| 84Ge(α,n) | 100 | 0.059 | 8 | |
| 88As(α,n) | 100 | 0.047 | 2 | |
| 90Se(α,n) | 100 | 0.037 | 2 | |
| 121Tc(α,n) | 100 | 0.024 | 6 | |
| 119Tc(α,n) | 100 | 0.021 | 6 | |
| 91Br(α,n) | 100 | 0.013 | 2 | |
| 85Y(α,n) | 0.01 | 0.015 | 6 | |
| 122Ru(α,n) | 100 | 0.013 | 6 | |
| Ru | 80Zn(α,n) | 100 | 0.343, 0.234, 0.090 | 3, 6, 1 |
| (Z = 44) | 81Ga(α,n) | 100 | 0.263 | 8 |
| 82Ge(α,n) | 100, 0.01 | 0.122, 0.121 | 8 | |
| 79Zn(α,n) | 100 | 0.205, 0.156, 0.100 | 3, 6, 8 | |
| 78Zn(α,n) | 100 | 0.182, 129 | 3, 6 | |
| 81Zn(α,n) | 100 | 0.126, 111, 0.056 | 3, 6, 1 | |
| 83Ge(α,n) | 100 | 0.096 | 8 | |
| 80Ga(α,n) | 100 | 0.084 | 8 | |
| 77Zn(α,n) | 100 | 0.073 | 3 | |
| 76Zn(α,n) | 100 | 0.064 | 3 | |
| 81Ge(α,n) | 100 | 0.065 | 8 | |
| 79Ga(α,n) | 100 | 0.058 | 1 | |
| 88As(α,n) | 100 | 0.043 | 2 | |
| 90Se(α,n) | 100 | 0.029 | 2 | |
| 121Tc(α,n) | 100 | 0.023 | 6 | |
| 119Tc(α,n) | 100 | 0.021 | 6 | |
| 134In(α,n) | 0.01 | 0.020 | 6 | |
| 129Ag(α,n) | 100 | 0.019 | 6 | |
| 89Nb(α,n) | 0.01 | 0.019 | 6 | |
| 117Rh(α,n) | 100 | 0.016 | 6 | |
| 122Ru(α,n) | 100 | 0.013 | 6 | |
| 94Zr(α,n) | 100 | 0.010 | 3 | |
| 91Zr(α,n) | 100 | 0.010 | 1 | |
| Rh | 80Zn(α,n) | 100 | 0.353, 0.239, 0.102 | 3, 6, 1 |
| (Z = 45) | 81Ga(α,n) | 100 | 0.274 | 8 |
| 82Ge(α,n) | 100, 0.01 | 0.129, 0.128 | 8 | |
| 79Zn(α,n) | 100 | 0.211, 0.158, 0.067 | 3, 6, 1 | |
| 78Zn(α,n) | 100 | 0.188, 131 | 3, 6 | |
| 81Zn(α,n) | 100 | 0.130, 114 ,0.064 | 3, 6, 1 | |
| 83Ge(α,n) | 100 | 0.112 | 8 | |
| 80Ga(α,n) | 100 | 0.088 | 8 | |
| 77Zn(α,n) | 100 | 0.075 | 3 | |
| 76Zn(α,n) | 100 | 0.065 | 3 | |
| 81Ge(α,n) | 100 | 0.069 | 8 | |
| 84Ge(α,n) | 100 | 0.068 | 8 | |
| 78Zn(α,n) | 100 | 0.049 | 1 | |
| 85Ge(α,n) | 100 | 0.033 | 2 | |
| 121Tc(α,n) | 100 | 0.025 | 6 | |
| 119Tc(α,n) | 100 | 0.023 | 6 | |
| 110Sn(α,n) | 100 | 0.020 | 6 | |
| 134In(α,n) | 0.01 | 0.022 | 6 | |
| 129Ag(α,n) | 100 | 0.021 | 6 | |
| 89Nb(α,n) | 0.01 | 0.021 | 6 | |
| 117Rh(α,n) | 100 | 0.017 | 6 | |
| 122Ru(α,n) | 100 | 0.014 | 6 | |
| 97Nb(α,n) | 100 | 0.012 | 6 | |
| Pd | 80Zn(α,n) | 100 | 0.355, 0.244, 0.091 | 3, 6, 1 |
| (Z = 46) | 81Ga(α,n) | 100 | 0.285 | 8 |
| 82Ge(α,n) | 100, 0.01 | 0.136, 0.134 | 8 | |
| 79Zn(α,n) | 100 | 0.213, 0.162, 0.057 | 3, 6, 1 | |
| 78Zn(α,n) | 100 | 0.190, 134 | 3, 6 | |
| 81Zn(α,n) | 100 | 0.131, 0.116 | 3, 6 | |
| 83Ge(α,n) | 100 | 0.117 | 8 | |
| 79Ga(α,n) | 100 | 0.110 | 8 | |
| 80Ga(α,n) | 100 | 0.092 | 8 | |
| 77Zn(α,n) | 100 | 0.076 | 3 | |
| 76Zn(α,n) | 100 | 0.066, 0.039 | 3, 6 | |
| 84Ge(α,n) | 100 | 0.072 | 8 | |
| 80Ge(α,n) | 100 | 0.063 | 8 | |
| 81Ga(α,n) | 100 | 0.044 | 3 | |
| 83Ge(α,n) | 100 | 0.029 | 2 | |
| 119Tc(α,n) | 100 | 0.022 | 6 | |
| 110Sn(α,n) | 100 | 0.020 | 6 | |
| 134In(α,n) | 0.01 | 0.022 | 6 | |
| 129Ag(α,n) | 100 | 0.020 | 6 | |
| 89Nb(α,n) | 0.01 | 0.020 | 6 | |
| 129Sn(α,n) | 100 | 0.017 | 6 | |
| 117Rh(α,n) | 100 | 0.017 | 6 | |
| 122Ru(α,n) | 100 | 0.014 | 6 | |
| 139Sn(α,n) | 100 | 0.011 | 6 | |
| 141In(α,n) | 0.01 | 0.013 | 6 | |
| 114Pd(α,n) | 100 | 0.011 | 1 | |
| 103Mo(α,n) | 100 | 0.010 | 6 | |
| 119Rh(α,n) | 0.01 | 0.010 | 1 | |
| Ag | 80Zn(α,n) | 100 | 0.373, 0.240, 0.115 | 3, 6, 1 |
| (Z = 47) | 81Ga(α,n) | 100 | 0.298 | 8 |
| 82Ge(α,n) | 100, 0.01 | 0.142, 0.141 | 8 | |
| 79Zn(α,n) | 100 | 0.225, 0.157, 0.075 | 3, 6, 1 | |
| 78Zn(α,n) | 100 | 0.201, 130 | 3, 6 | |
| 81Zn(α,n) | 100 | 0.140, 0.116 | 3, 6 | |
| 83Ge(α,n) | 100 | 0.123 | 8 | |
| 79Ga(α,n) | 100 | 0.114 | 8 | |
| 80Ga(α,n) | 100 | 0.096 | 8 | |
| 81Ge(α,n) | 100 | 0.077 | 8 | |
| 77Zn(α,n) | 100 | 0.080 | 3 | |
| 76Zn(α,n) | 100 | 0.070 | 3 | |
| 84Ge(α,n) | 100 | 0.075 | 8 | |
| 80Ge(α,n) | 100 | 0.066 | 8 | |
| 81Ga(α,n) | 100 | 0.045 | 3 | |
| 121Tc(α,n) | 100 | 0.036 | 6 | |
| 119Tc(α,n) | 100 | 0.033 | 6 | |
| 110Sn(α,n) | 100 | 0.029 | 6 | |
| 134In(α,n) | 0.01 | 0.032 | 6 | |
| 129Ag(α,n) | 100 | 0.030 | 6 | |
| 89Nb(α,n) | 0.01 | 0.030 | 6 | |
| 117Rh(α,n) | 100 | 0.025 | 6 | |
| 129Sn(α,n) | 100 | 0.025 | 6 | |
| 122Ru(α,n) | 100 | 0.020 | 6 | |
| 141In(α,n) | 0.01 | 0.020 | 6 | |
| 103Nb(α,n) | 0.01 | 0.020 | 6 | |
| 103Mo(α,n) | 100 | 0.018 | 6 | |
| 107Cd(α,n) | 0.01 | 0.017 | 6 | |
| 108Ag(α,n) | 100 | 0.017 | 6 | |
| 107In(α,n) | 0.01 | 0.016 | 6 | |
| 116Sn(α,n) | 100 | 0.016 | 6 | |
| 137Sn(α,n) | 100 | 0.014 | 6 | |
| 104Ag(α,n) | 100 | 0.015 | 6 | |
| 133Ru(α,n) | 100 | 0.010 | 4 | |
The R(i) of group II is generally dozens of times less than that of group I, and only has a limited effect on their adjacent elements. The (α,n) reactions of some isotopes have mild influence on three or four elements, such as 93,94Kr and 91Br to Rb, Sr and Y; 117Rh, 129Ag and 134In to Ru, Rh, Pd and Ag; 110Sn to Rh, Pd and Ag; 103Mo to Mo, pd and Ag. Few isotopes also have a wide range impact as the top items in group I, but with much less R(i), like 119,121Tc, influence the abundances from Zr to Ag, while 89Nb almost has the same coverage besides Tc. 122Ru is sensitive to five elements, Tc, Ru, Rh, Pd, and Ag. The remaining reactions of group II just have a limited impact on one or two elements nearby.
4. Conclusion
The MHD-SNe, referred to as hypernovae, eject matter with high temperature and density from the PNS with fast rotation and a strong magnetic field. It is a robust site of weak r-process by various models and can explain the chemical abundance of the UMP stars. The nucleosynthesis of MHD-SNe in the perspective of nuclear reaction, like what types of reaction dominate in this scenario and what reactions are most sensitive to the final abundance, has not been investigated before.
In this paper, the state-of-the-art MHD-SNe model is implemented into the SkyNet network calculation. By varying the rates of all reactions for each specific type, the (α,n) reaction shows its remarkable influences over a wide range of the mass number under most tracers of the model. It indicates that (α,n) are dominated in the process, which is consistent with previous studies of the timescale of the reaction. The (n,γ) reaction has limited impact under a few tracers, in particular on the iron peak and the second peak A ∼ 130. The (n,p) reaction influences the abundance around iron peak since it is active in the early phase of the nucleosynthesis, while the (α,p) and (p,γ) show much less significance on the current model. A total of 1683 (α,n) reaction rates of the isotopes from Z = 25 to Z = 50 are varied one by one to investigate their sensitivity. The most impactful reactions are selected based on the discrepancy of the final abundance to the baseline. The isotopes of these reactions are mainly from the region Z from 29 to 36 and A from 80 to 90 and generally favor the β delayed neutron emission decay mode. The sensitive reactions on each element are also tabulated, including the above universal influential reactions and reactions that only have a local effect on their adjacent elements.
This work provides a guide to reduce the physics uncertainties of MHD-SN nucleosynthesis in future experiments. Many isotopes shown in Table 2 were hard to reach before, as they are far away from the stability valley, but will be available on the new fantastic facilities like FRIB, coming soon. Better understanding of the origin of the lighter heavy elements can be obtained with the measurements of these critical reactions.
I would like to thank M. Reichert, M. Obergaulinger, M. Eichler, M. Aloy, and A. Arcones for providing the trajectories of the MHD model. I appreciate the helpful discussions with Luke Roberts and Kirby Hermansen on the coding issues. This work is supported by the Major State Basic Research Development Program of China grant No. 2018YFA0404401, the CAS Light of West China Program grant No. 2020-82, and the CAS Project for Young Scientists in Basic Research grant No. YSBR-002.