


Abstract
A GOES M1.9 flare took place in active region AR 11153 on 2011 February 9. With a resolution of 200 kHz and a time cadence of 80 ms, the reverse-drifting (RS) type-III bursts, intermittent sequence of type-U bursts, drifting pulsation structure (DPS), and fine structures were observed by the Yunnan Observatories Solar Radio Spectrometer (YNSRS). Combined information revealed by the multiwavelength data indicated that after the DPS was observed by YNSRS, the generation rate of type-U bursts suddenly increased to 5 times what it had been. In this event, the generation rate of type-U bursts may depend on the magnetic-reconnection rate. Our observations are consistent with previous numerical simulation results. After the first plasmoid produced (plasma instability occurred), the magnetic-reconnection rate suddenly increased by 5 to 8 times. Furthermore, after the DPS, the frequency range of the turnover frequency of type-U bursts was obviously broadened to thrice what it was before, which indicates a fluctuation amplitude of the density in the loop top. Our observations also support numerical simulations during the flare-impulsive phase. Turbulence occurs at the top of the flare loop and the plasmoids can trap nonthermal particles, causing density fluctuation at the loop top. The observations are generally consistent with the results of numerical simulations, helping us to better understand the characteristics of the whole physical process of eruption.
Export citation and abstract BibTeX RIS

Original content from this work may be used under the terms of the Creative Commons Attribution 4.0 licence. Any further distribution of this work must maintain attribution to the author(s) and the title of the work, journal citation and DOI.
1. Introduction
Magnetic reconnection is a common phenomenon in the solar atmosphere and it can occur in a slowly changing way, which may contribute to coronal heating (e.g., Priest & Schrijver 1999), but more often happens as sudden, violent processes such as flares, coronal mass ejections (CMEs), and jet eruptions (e.g., Lin & Forbes 2000; Cassak & Shay 2012). Magnetic reconnection leads to plasma heating and particle acceleration, which in turn, can efficiently contribute to chromospheric evaporation, thermal conduction fronts, and solar radio bursts during solar eruption (e.g., Tian et al. 2014; Ni et al. 2015, 2016, 2017; Hong et al. 2017, 2019; Cairns et al. 2018; Bi et al. 2020).
The energetic electrons are accelerated by magnetic reconnection; the instability of an electron beam can generate Langmuir (plasma) waves at the local plasma frequency that can be converted into electromagnetic emission. Then, the electron beam propagates in an upward direction (anti-sunward) along open magnetic field lines, producing normal type-III solar radio bursts with a negative frequency-drift rate. Cairns et al. (2018 ) provided the long-desired direct evidence that electrons energized in magnetic-reconnection regions produce type-III solar radio bursts. In contrast, the energetic electrons propagate in a downward direction (sunward) to form reverse-drifting (RS) type-III bursts with a positive frequency-drift rate; as the energetic electrons move toward the mirror point in a closed magnetic field line, they show first a negative drift rate and later a positive drift rate after they have crossed the loop apex, which is shaped like an inverted letter U, hence their name, type-U bursts. In some cases, the energetic electrons are accelerated by magnetic reconnection and reach the mirror point near the opposite footpoint of the flare-loop system, then by the magnetic mirror effect, the energetic electrons moving along the loops and type-U bursts are formed. A partial type-U burst that does not show a fully developed downward branch is called a J burst (e.g., Aschwanden et al. 1993; Wang et al. 2001; Ning et al. 2000, 2003; Kong et al. 2016). The physical relevance of type-III and -U bursts is the diagnostics of whether the electron beams propagate along open or closed magnetic field lines (e.g., Aschwanden 2009).
The radiation mechanism of type-III, type-U bursts, and their subtypes is usually considered plasma radiation, which produces radiation at the plasma frequency (or second harmonic frequency), and its square is directly proportional to the electron density. Therefore, the coronal electron-density distribution can be diagnosed by the frequency distribution of type-III, type-U bursts, and their subtypes. Specifically, the type-III pair bursts occurring in the flare-impulsive phase have lower separate frequencies, indicating the plasma density of the magnetic-reconnection energy-release region (Tan et al. 2016a, 2016b). The coronal altitude of the magnetic-reconnection region can be estimated by coronal-density models (e.g., Aschwanden & Benz 1995).
In numerical simulations of magnetic reconnection in the current sheet, Shen et al. (2011a) found that the rate of magnetic reconnection, MA , after the first plasmoid generation was about 5 to 8 times higher than before. Similar results were found in numerical simulations by Ni & Lukin (2018); their results also demonstrated that, after the plasmoid instabilities appeared, the reconnection rate sharply increased by a factor of about 5 times. This phenomenon of magnetic reconnection was not observed due to the limited resolution of observations.
In addition, the jets are usually considered to be the results of the plasma heated and accelerated by magnetic reconnection and moving along open or large-scale magnetic field lines. Therefore, they often have straight or slightly curved structures. The observations also show that there are lots of fine structures and radio bursts in the process of jets (e.g., Shen et al. 2011a, 2012; Zhang & Zhang 2017; Shen et al. 2018).
2. Observations and Results
A GOES M1.9 class flare in soft X-rays occurred in active region AR 11153 on 2011 February 9. The onset, peak, and end times are 01:23 UT, 01:28 UT, and 01:31 UT, respectively. At the same time, several solar radio bursts and fine structures were observed by the Yunnan Observatories Solar Radio Spectrometer (YNSRS; Gao et al. 2014a) and Hiraiso Radio Spectrograph (HiRAS; Kondo et al. 1995).
The solar radio bursts occurred between 01:26 and 01:36 UT on 2011 February 9 and were detected by HiRAS, which consists of three antennas, HiRAS-1, HiRAS-2, and HiRAS-3, which have frequency ranges of 25–70, 70–500, and 500–2500 MHz with spectral resolutions of 45 kHz, 430 kHz, and 2 MHz, respectively. Figure 1 displays the dynamic spectrum of this event obtained by HiRAS with a time cadence of 1 s. In the dynamic spectrum observed by HiRAS-3, between 01:26:24 and 01:30 UT, some type-III bursts with a narrow band appeared over a group of decimetric radio bursts (DCIM) that occurred from 700 to 1500 MHz. Actually, these type-III bursts observed by HiRAS are three groups of type-U bursts observed by YNSRS with a higher time and frequency resolution (see Figure 2(a)). Figure 1 also shows the drifting pulsation structure (DPS) drifting from 440 MHz at 01:28:21 UT to 340 MHz at 01:28:45 UT, as well as the two U bursts that are strung together; these type-U bursts occurred from 220 to 300 MHz observed by HiRAS-2 between 01:30:15 and 01:30:42 UT. The obvious radio storm, observed by HiRAS-1, occurred between 01:28:06 and 01:34:50 UT and in the frequency range from 27 to 70 MHz.

Figure 1. Solar radio bursts observed by HiRAS-1, HiRAS-2, and HiRAS-3 from 25 to 2500 MHz on 2011, February 9."RFI" means the radio frequency interferences; "storm" and "DPS" structures are also displayed. The frequency range of YNSRS data of Figure 2(a) is indicated by the white box.
Download figure:
Standard image High-resolution image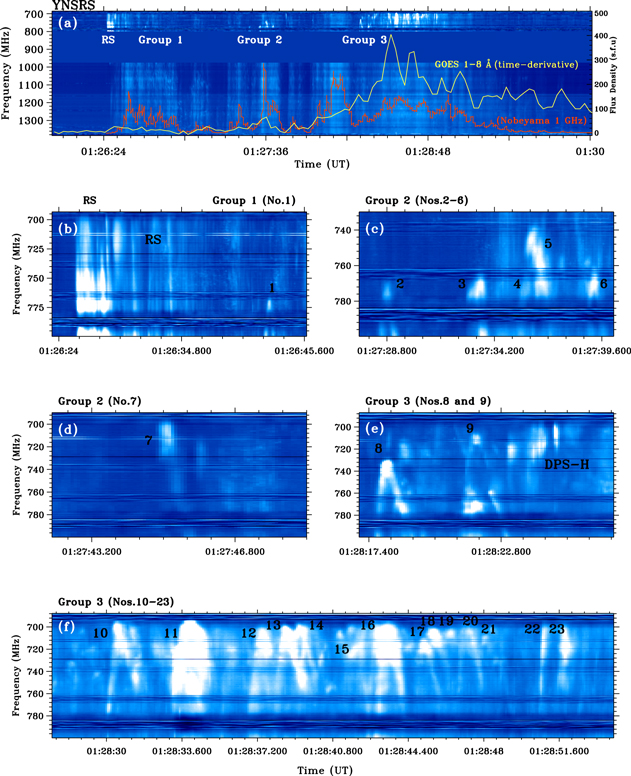
Figure 2. (a) The dynamic spectrum of solar radio bursts observed by YNSRS from 680 to 1380 MHz. "RS" and "groups 1–3" type-U bursts are marked. The continuous curve with yellow color is the time derivative of the GOES 1–8 Å time series; the red curve is the Nobeyama Radio Polarimeter's flux plot at 1 GHz. (b) The RS type-III solar radio bursts occur at around 01:26:24–01:26:38 UT. The first type-U burst (No. 1) starts at around 01:26:42.280 UT; the duration time is about 640 ms. (c)–(d) The second group of type-U bursts (Nos. 2–7) occur around 01:27:28–01:27:46 UT. (e)–(f) The third group of type-U bursts (Nos. 8–23) occurred at around 01:28:17–01:28:52 UT along with the other drifting pulsation structure (marked with "DPS-H") showed in (e).
Download figure:
Standard image High-resolution imageThe dynamic spectrum in the white box of Figure 1 was also observed by YNSRS, which works in the frequency range from 625 to 1500 MHz with a spectral resolution of 200 kHz and a time cadence of 80 ms. The frequency range of 800–975 MHz has no data because of the notch filters that suppress serious interference in this band (see Gao et al. 2014a). The dynamic spectrum of the event obtained by YNSRS is plotted in the Figure 2(a) between 01:26 and 01:30 UT on 2011, February 9, which shows the reverse-drifting (RS) type-III bursts, type-U bursts, fine structures, and DCIM, which were also observed by HiRAS. We assigned the type-U bursts into three groups with an obvious time interval for each group (Groups 1–3). These groups include 1 (01:26:42.280–01:26:42.920 UT), 6 (01:27:28–01:27:46 UT), and 16 (01:28:17–01:28:52 UT) type-U bursts, respectively. We also note that it is hard to resolve type-U bursts in Figure 1; therefore, if there is a lack of high-resolution data, these type-U bursts usually may be considered narrow-band type-III bursts in previous observations. The continuous curve with yellow color in Figure 2(a) is a time derivative of the GOES 1–8 Å time series, which is used as a proxy for the missing HXR data because no RHESSI data were available at that time interval. Around the peak of the flare (∼01:28 UT), the Group 3 type-U bursts have the largest number and the fastest generation rate; meanwhile, the rising and dramatic variability happened in the time-derivative curve of the GOES 1–8 Å time series. In addition, the red curve in Figure 2(a) is the Nobeyama Radio Polarimeter's (NoRP; Nakajima et al. 1994) flux plot at 1 GHz, which shows the maximum flux density of these radio bursts is about 300 s f u.
In order to investigate the details of these radio bursts, we zoomed in each region of Figure 2(a), hence, Figures 2(b)–(f) are corresponding to type-RS bursts and groups 1–3 type-U bursts, respectively. Figure 2(b) shows a group of type-RS bursts between 01:26:24 and 01:26:38 UT. Combining the HiRAS-3 and YNSRS data revealed by Figures 1 and 2(b), we found the type-RS bursts drifting from 660 to 970 MHz with the drifting rate of 660 ± 110 MHz s−1. The first group (Group 1) has one type-U burst (No. 1; see Figure 2(b)), which is after the type-RS bursts and starts at 01:26:42.280 UT, as well as a time duration of about 640 ms. Both the beginning and ending frequency are 800 MHz, and the turnover frequency is 766 MHz. Figures 2(c) and (d) display the second group (Group 2) of the type-U bursts (Nos. 2–7), which occurred between 01:27:28 and 01:27:46 UT. The Nos. 2–4 and 6 have almost the same beginning, ending, and turnover frequencies, which are 800, 800, and 766 MHz, respectively. The turnover frequencies of Nos. 5 and 7 are lower than the others, and are about 740 and 700 MHz, respectively. Figures 2(e) and (f) show the last group with 16 type-U bursts (Nos. 8–23) between 01:28:17–01:28:52 UT, which is the largest number of type-U bursts in this event. Some enhancements between them are not included. Hence, 16 is a lower limit; possibly more type-U bursts occurred in this group. In addition, there are some fine structures (FSs) in HiRAS and YNSRS data, such as DPSs (see Figures 1 and 2(e)).
DPS is considered to be the radio signature of plasmoids forming and moving during magnetic reconnection in the impulsive phase of a flare (e.g., Kliem et al. 2000; Liu et al. 2010; Gao et al. 2014b). In numerical simulations of magnetic reconnection, the emergence of plasmoids is considered to be a sign of plasma instability and turbulence (Shen et al. 2011b; Ni et al. 2015, 2016, 2017). Two DPSs in this event are displayed in Figures 1 and 2(e), respectively. HiRAS observed the DPS with the center frequency drifting from 420 to 360 MHz and a time interval of 01:28:21–01:28:45 UT; the drifting rate was −3 ± 0.5 MHz s−1 (marked with "DPS" in Figure 1). The other DPS after No. 9, a type-U burst with a drifting rate of −6.2 ± 2.7 MHz s−1 observed by YNSRS, occurred in the higher frequency; the center frequency range is from about 728 to 712 MHz, and the time interval is about 01:28:23–01:28:25 UT (marked with "DPS-H" in Figure 2(e)). In addition, after the DPS of Figure 1, the two crowded type-U bursts occurred between 300 and 220 MHz observed by HiRAS-2 with a time interval of 01:30:18–01:30:36 UT; the turnover frequency is about 290 MHz.
Figures 2(c)–(f) display some FSs in type-U bursts. Figure 2(c) shows the No. 5 type-U burst, which is superimposed over the No. 4. Both of them have almost the same turnover time (∼01:27:36 UT), but different turnover frequencies, which are 760 and 740 MHz, respectively. We also note that Nos. 10–18 type-U bursts occurred after the "DPS-H" observed by YNSRS (see Figures 2(e) and (f)), and their turnover frequencies are not concentrated at one point, but distributed in a frequency range of ∼30 MHz (such as the No. 10 type-U burst in Figure 2(f)). In contrast, before the "DPS-H," the turnover frequencies of type-U bursts Nos. 1–9 are distributed in the range of ∼10 MHz (such as the No. 9 type-U burst in Figure 2(e)).
2.1. Radio Data Analysis
The physical mechanism behind type-III and -U bursts is considered to be plasma radiation. The energetic particle motion in the coronal plasma with a velocity of 0.1–0.3 c causes the Langmuir instability and fluctuation and then the corresponding energy is transferred to the electromagnetic wave with the same frequency at the local plasma frequency and/or second harmonic frequency. Therefore, the frequency fobs of the observed radio bursts is related to the plasma frequency fp
and the electron density ne
in the source region by ![${f}_{\mathrm{obs}}={{sf}}_{p},\,\,{f}_{p}\,[\mathrm{kHz}]=8.98\sqrt{{n}_{e}\,[{\mathrm{cm}}^{-3}]}$](https://content.cld.iop.org/journals/0004-637X/923/2/268/revision1/apjac3135ieqn1.gif) and thus to the altitude of the source region, if a coronal-density model, ne
= ne
(h), is given. Here s stands for the fundamental (s = 1) and for the harmonic (s = 2) band, respectively (McLean & Aabrum 1985).
and thus to the altitude of the source region, if a coronal-density model, ne
= ne
(h), is given. Here s stands for the fundamental (s = 1) and for the harmonic (s = 2) band, respectively (McLean & Aabrum 1985).
In this work, we use the electron-density model of Aschwanden & Benz (1995) for the flare region:

where h1 is a transition height at which the way ne depends on h changes. This model is constrained by the electron density nQ at the base of the quiet corona and the density scale height λ. It was developed for the region that has been affected by the heating and chromospheric evaporation in the flare process. A smooth transition between the two regimes is obtained by requiring that the function and its first derivative be continuous at the transition height h = h1. These continuity conditions determine h1 and the density n1 = ne (h = h1):

with p = 2.38, λ = 6.9 × 109 cm, and nQ = 4.6 × 108 cm−3.
The type-RS bursts were observed by YNSRS at the beginning of this event (see Figures 2(a) and (b)); they indicated the electron beams were propagating in the sunward direction in contrast to the normal type-III solar radio bursts. The starting frequency of the type-RS bursts is 695 ± 3 MHz, according to the altitude of the region of particles accelerated by magnetic reconnection, which can be calculated by Equation (1) and is 20.6 ± 0.1 Mm(from the solar surface).
We investigated the radio data from YNSRS, the EUV data from the Atmospheric Imaging Assembly (AIA, Lemen et al. 2012), and LOS magnetograms from the Helioseismic and Magnetic Imager (HMI, Schou et al. 2012) on board the Solar Dynamics Observatory (SDO). A newly emerging magnetic loop appeared below the existing magnetic loop at 01:25:45 UT in the 131 Å band (see Figure 4(a)). At 01:26:21 UT, a disturbance of EUV was observed, which moved from one upper left footpoint of the original magnetic loop to another lower right footpoint (see the red arrow in Figure 4(b)). The cusp-shaped structure formed at 01:26:26 UT in 94 Å (see Figure 4(c)); the loop top of the cusp-shaped structure and the two footpoints brightened at the same time. The brightened areas are identified with the red dashed box and orange arrows in Figure 4(c), respectively. Meanwhile, the loop top of the cusp-shaped structure was located at the junction of two opposite magnetic fields (see the red dashed box in Figures 4(c) and (d), respectively). It indicates that the region of magnetic reconnection may be located in the current sheet above the cusp-shaped structure (see Figure 1 of Forbes & Acton 1996). At the same time (01:26:24–01:26:38 UT), YNSRS observed the type-RS bursts (see the right lower panel in Figures 4(c) and 2(b)). Combining the EUV and radio data, we realize that the scenario may be that the newly emerging magnetic loop reconnected with the original loop, forming the cusp-shaped structure. Type-RS bursts caused by the electron beam are accelerated by the magnetic reconnection and propagate from the loop top toward the footpoints (sunward) in the cusp-shaped structure. The accelerated electrons finally enter the lower atmosphere and heat it, resulting in the phenomenon of two footpoints brightening at the same time in 94 Å (see Figure 4(c)).
After the type-RS bursts, the type-U bursts (Nos. 1–23) appeared; the turnover frequencies and corresponding coronal altitudes of type-U bursts deduced from Equation (1) were displayed in Figure 3. The turnover frequency of type-U bursts is the lowest frequency of each type-U burst. In other words, the turnover frequency is lower than the starting and ending frequency of each type-U burst, respectively, which means that the trajectory of the electron beam first moves from the high-density coronal region to the low-density region, and then to the high-density region again.
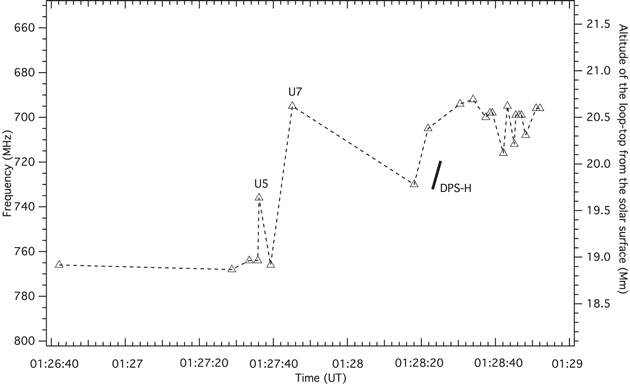
Figure 3. The altitude and frequency of turnover frequencies of type-U bursts, and the DPS observed by YNSRS ("DPS-H"). Triangle symbols represent the turnover frequencies and associated altitudes of type-U bursts. The center frequency and altitude of the "DPS-H" is indicated by a solid line.
Download figure:
Standard image High-resolution imageFigure 4(e) shows that chromospheric evaporation phenomena may be observed in the cusp-shaped structure at 01:27:09 UT in 131 Å. It is manifested as the brightening EUV propagating along the loop from the right footpoint to the left one (see the yellow arrows in Figure 4(e)). Meanwhile, the Nos. 1–7 type-U bursts occurred (see lower right and left panels in Figure 4(e)). According to the sequence of various features shown in Figures 4(a)–(e), we acquire a scenario such that the electrons were accelerated by magnetic reconnection and the cusp-shaped structure formed. The accelerating electrons propagated along the magnetic loop to the footpoints (sunwards) and produced type-RS bursts; some energetic electrons were reflected by the magnetic mirror effect in one footpoint region and moved up along the loop to the loop top (anti-sunward), and then moved down to another footpoint (sunward), producing the type-U bursts. A part of the energetic electrons and heating conduction front reached the chromosphere (see Forbes & Acton 1996, Figure 1), the energetic electrons were injected into the chromosphere and heated the chromospheric plasma, and the chromospheric plasma propagating along the loop caused the brightening EUV moving in the loop observed in 131 Å (see Figure 4(e)) with a velocity of about 360 km s−1.

Figure 4. (a) The white arrow points to the newly emerging loop in SDO/AIA 131 Å. (b) The red arrow points to EUV inflows in the existing loop in 131 Å. (c) The magnetic reconnection accelerates and heats particles in 94 Å; the accompanying RS type-III bursts in the same time are shown in the lower right panel. The orange arrows mark the brightened areas of the cusp-shaped structure. The red dashed box indicates the region where magnetic reconnection may occur. (d) An HMI magnetogram. The red dashed box shows the same area as in (c); it is also used to indicate the possible area of magnetic reconnection with positive and negative polarities. (e) The phenomenon of chromosphere evaporation in 131 Å is indicated by the yellow arrow and the accompanying type-U bursts (Groups 1–2) are displayed in the lower panels. (f) The cusp-shaped structure continues to brighten and the remote brightening occurs in 131 Å, with the largest number of type-U bursts (Group 3) in the lower right panel.
Download figure:
Standard image High-resolution imageSubsequently, at 01:27:33 UT, the remote brightening of the cusp-shaped structure was observed in 131 Å (see Figure 4(f)), and the whole cusp-shaped structure rose up and brightened. The third group of type-U bursts (Nos. 8–23, 01:28:17–01:28:52 UT), which is type-U bursts with the largest number and the fastest generation rate, occurred at this event. After the third group of type-U bursts, there was a significant brightening in all EUV bands until the detector was saturated and could no longer distinguish the cusp-shaped structure. At this time, the flare was at the maximum moment in soft X-rays observed by GOES.
We investigated the turnover frequencies of the type-U bursts (Nos. 1–23) and their corresponding coronal altitudes (see Figure 3). We note that the turnover frequencies of all type-U bursts occurred between 696 ± 3 and 766 ± 3 MHz, and the corresponding coronal altitudes were between 20.5 ± 0.1 and 19.0 ± 0.1 Mm (from the solar surface). Combined with the evolution of the cusp-shaped structure observed by SDO/AIA, the corresponding region of the turnover frequency should be the loop top of cusp-shaped structure. Therefore, the decreasing turnover frequency of type-U bursts means the altitude of the loop top is rising continuously, which indicated the expansion of the whole flare-loop system. According to the turnover frequencies of type-U bursts in Figure 3, we estimated the frequency-drift rate is −0.7 ± 0.1 MHz s−1 by the linear fitting, and the velocity of the whole flare-loop system is 14.7 ± 0.2 km s−1 (anti-sunward) estimated by Equation (1). In addition, from the observation data of YNSRS and HiRAS, we have not found the second harmonic structure of type-U bursts. Therefore, the calculation of the coronal altitude is based on the fundamental frequency radiation, that is, s = 1 in fobs = sfp .
Figure 3 shows the lowest turnover frequency of the type-U bursts is 695 ± 3 MHz, which corresponds to the density of the loop top, which is about 6.0(±0.1) × 109 cm−3 by ![${f}_{p}\,[{\rm{kHz}}]=8.98\sqrt{{n}_{e}\,[{{\rm{cm}}}^{-3}]}$](https://content.cld.iop.org/journals/0004-637X/923/2/268/revision1/apjac3135ieqn2.gif) . The two bifurcations of the type-U bursts extend to about 800 ± 3 MHz, which correspond to the density of the footpoints, which is about 7.9(±0.1) ×109 cm−3.
. The two bifurcations of the type-U bursts extend to about 800 ± 3 MHz, which correspond to the density of the footpoints, which is about 7.9(±0.1) ×109 cm−3.
Both theories and observations assume that the flare-loop system is expanding continuously during solar eruption, which is manifested by the rising of the flare-loop system and the separation of footpoints in the corona. At the same time, a newly formed flare loop will be at a higher height of the corona than the others (e.g., Švestka et al. 1987; Lin et al. 1995; Forbes & Acton 1996; Lin 2004; Yan et al. 2013; Gao et al. 2014b). This behavior of the flare loop is not dependent on the plasma motion, but the result of the region of magnetic reconnection moving to new magnetic field lines. We notice that the curve of the turnover frequency of type-U bursts in Figure 3 is very steep at U5 and U7; it indicates that the turnover frequencies of the Nos. 5 and 7 type-U bursts decrease significantly at that moment and also means the loop tops rise significantly. In contrast, the turnover frequencies of the other type-U bursts decrease relatively slowly, which indicates the slow rising of the loop tops. A possible explanation for Nos. 5 and 7 decreasing significantly is that the electron beams that are reflected by the magnetic mirror effect move along the newly formed loops at a greater height in the magnetic-reconnection region. Meanwhile, the turnover frequencies of most type-U bursts decrease steadily, which may demonstrate that the whole flare-loop system is rising. We calculate the velocity of the flare-loop system rising as 14.7 ± 0.2 km s−1. According to Figure 4 in Lin (2004), we sketch the formation process of U5 and U7 (see Figure 5).
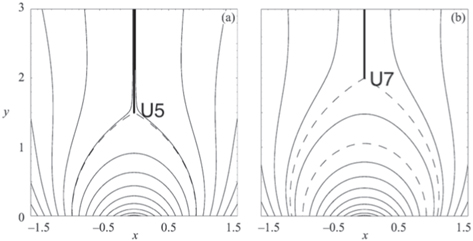
Figure 5. Schematic demonstration of a new loop formed after magnetic reconnection and the whole flare-loop system has expanded. (a) The dashed curve indicates a new loop formed after magnetic reconnection. At this time, due to the magnetic mirror effect, the upward moving electron beam just moves along the newly formed loop, resulting in the No. 5 type-U burst. (b) Another new loop is formed at the magnetic-reconnection point. Similar to the formation mechanism of a No. 5 type-U burst, the new loops are constantly produced in the magnetic-reconnection point and the electron beam moves along the newly formed loops to form the No. 7 type-U burst.
Download figure:
Standard image High-resolution imageIt is worth noting that DPS in the decimetric band is usually interpreted as radio signals of plasmoids formed during magnetic reconnection (e.g., Kliem et al. 2000; Bárta et al. 2008b; Gao et al. 2014b; Karlický et al. 2018). Based on Lin & Forbes' (2000) solar eruption model, Shen et al. (2011b) studied the magnetic-reconnection rate MA during magnetic reconnection through numerical simulations, and found that MA increased very slowly in the initial stage of magnetic reconnection, but increased significantly, 5–8 times, after the emergence of the first plasmoid or magnetic island (see Figure 5 in Shen et al. 2011b). Likewise, the numerical simulations of Ni et al. (2015, 2016) and Ni & Lukin (2018) also demonstrated that the magnetic-reconnection rate increased rapidly to 5 times after the emergence of plasma instability. In our work, the DPS occurred after the No. 9 type-U burst observed by YNSRS at 01:28:23 UT and the frequency range is about 700–740 MHz (see "DPS-H" in Figure 2(e)). The center frequency and drifting direction of "DPS-H" are displayed with solid arrows in Figure 3. According to Equation (1), the velocity of the plasmoid is 137 ± 60 km s−1 (anti-sunward). Meanwhile, the structure of this plasmoid can also be clearly observed in SDO/AIA 94, 131, and 211 Å bands (see Figure 6), especially in 94 Å (as shown by the arrows in Figures 6(a)–(b)). According to the SDO/AIA data, we obtain the velocity of the plasmoid as about 212 km s−1 (anti-sunward). These two speeds are almost the same; the little difference of the plasmoid velocity calculated in EUV and radio data may be due to the coronal-density model-dependent or projection effect.
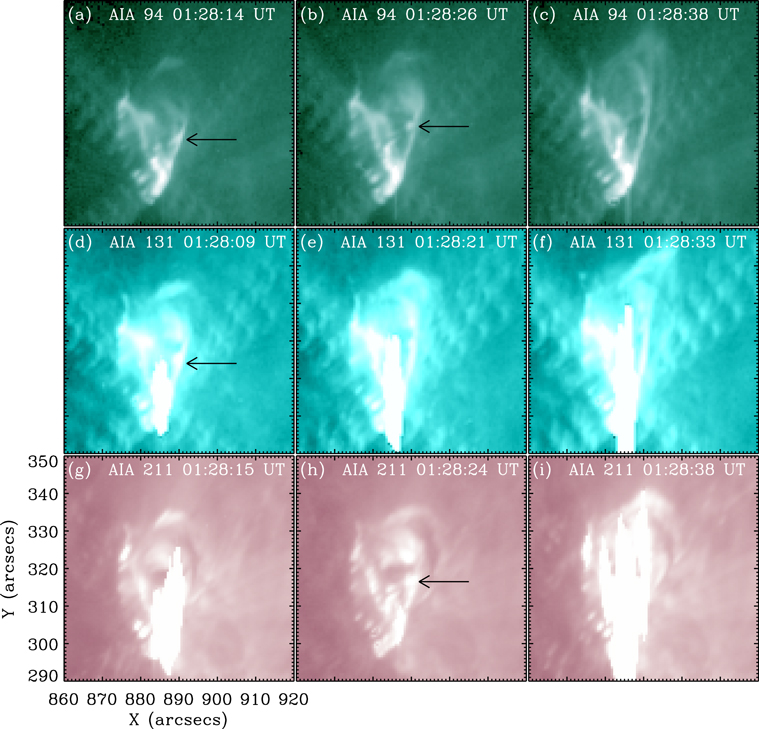
Figure 6. During 01:28:14–01:28:38 UT, a plasmoid observed in AIA 94, 131, and 211 Å is indicated by black arrows. At the same time, the "DPS-H" is observed by YNSRS in Figure 2(e).
Download figure:
Standard image High-resolution imageIn this event, before the occurrence of "DPS-H" in Figure 2(e), the generation rate of the type-U bursts was about 1 every 10 seconds, and after the "DPS-H," it increased to about 5 every 10 seconds. After the emergence of the first plasmoid, the generation rate of type-U bursts was enhanced five times. Furthermore, Figure 2(f) displayed that some type-U bursts after "DPS-H" appeared intensively and caused some of them to be too close to resolve. Therefore, we assume that a factor of 5 times is just a lower limit. The type-U bursts are generated by electron beams moving along the flare loop, so the generation rate of type-U bursts may represent the generation rate of electron beams, and the magnetic-reconnection rate could be described by the generation rate of type-U bursts. We suggest that this observed phenomenon may first support the results of numerical simulations by Shen et al. (2011b), Ni et al. (2015), Ni et al. (2016), and Ni & Lukin (2018) in the process of magnetic reconnection; when the plasma instability occurs, the magnetic-reconnection rate will increase significantly.
In addition, we also note that type-U bursts occurred before/after the "DPS-H" observed by YNSRS (see Figures 2(e)–(f)), and their turnover frequencies are not concentrated in one point. Before the "DPS-H," the turnover frequency range of type-U bursts (such as No. 9) is between 706 and 716 MHz; also, the frequency range is about 10 MHz (see Figure 2(e)). However, after the "DPS-H," the frequency range of turnover frequency is obviously broadened. From Figure 2(f), the frequency range of turnover frequency, such as in No. 10 in Figure 2(f), is between 696 and 726 MHz with a frequency range of 30 MHz. The duration of this state is 20 seconds; since this, the frequency range turns back to 10 MHz (see No. 19 in Figure 2(f)). According to the sequence of features, the changes in turnover frequency range before/after the "DPS-H" may manifest as variation in the density at the loop top. We calculate the average density of the loop top before the "DPS-H" (or the plasmoid generation); it is about 6.3 × 109 cm−3, and the fluctuation amplitude of the density is ±0.1 ×109 cm−3. However, after the plasmoid generation, the average density of the loop top is about 6.3 × 109 cm−3, but the fluctuation amplitude of the density is ±0.3 × 109 cm−3. This demonstrates that the density at the loop top has been in a significant fluctuation before and after the "DPS-H" (or the formation of the plasmoid), which is from 6.3(±0.1) ×109 cm−3 to 6.3(±0.3) × 109 cm−3. The observation results may support the numerical simulations of Fang et al. (2016); they simulated the deposition of energy driven by magnetic reconnection in a flare loop during the flare-impulsive phase, resulting in chromospheric evaporation between the two footpoints at a speed of hundreds of kilometers per second. The simulation results show that the turbulence phenomenon appears at the top of the flare loop and may be an effective nonthermal particle accelerator and the magnetic island (or plasmoid) can capture nonthermal particles at the loop top and cause density fluctuation.
2.2. EUV Observations
In order to better understand the physical process in this event, we review this process from EUV observations. By analyzing the data from SDO/AIA and HMI LOS magnetograms and the Solar Terrestrial Relations Observatory (STEREO; Kaiser et al. 2008), we found this event including three procedures, EUV disturbances, magnetic reconnection, and jet eruptions.
2.2.1. The First Stage: EUV Disturbances
Before the radio bursts, the cusp-shaped structure had not formed in SDO/AIA, and EUV disturbances occurred between 01:16:09 and 01:22:36 UT (see Figure 7). Four obvious EUV disturbances were observed in the 94 and 171 Å bands, respectively, which manifested as rapid movement of the enhancement structures in the flare loop. According to the distribution of the emission intensity in the time sequence, we estimated that the velocity of the first and second disturbances was 217.6 km s−1 and 113.3 km s−1, respectively. After 01:20:45 UT, the studied flare loop slightly rose, which resulted in the unsuitable speed of the third and the fourth disturbances.

Figure 7. The EUV disturbances were observed by AIA 94 and 171 Å between 01:16–01:23 UT. (a)–(b) The first EUV disturbance (No. 1) in both AIA 94 and 171 Å, respectively. (c) The second EUV disturbance (No. 2) in AIA 171 Å. These disturbances propagate from the upper left footpoint to the lower right one. All of the disturbances originate in the region of the red dashed box. (d) The red dashed box in the HMI magnetogram also indicates that the origin of the disturbances lies at the junction of positive and negative polarities. (e)–(f) Nos. 3 and 4 EUV disturbances in AIA 171 Å.
Download figure:
Standard image High-resolution imageFigures 7(a)–(b) show the first EUV disturbance observed in 94 and 171 Å, respectively. Figure 7(c) shows the second EUV disturbance observed in 94 Å, and Figures 7(e)–(f) display the third and fourth EUV disturbances, respectively. We also note that all the EUV disturbances in this event come from the left upper footpoint of the original magnetic loop (the area framed with the red dashed box in Figure 7(c)); the corresponding region is also drawn in the HMI magnetogram of Figure 7(d). This is shown by the left upper footpoint of the original magnetic loop located at the polarity inversion line. Therefore, the EUV disturbances propagating in the magnetic loop may come from magnetic reconnection near the left upper footpoint of loops. Furthermore, in this event, we have not observed the reflection phenomenon of EUV disturbance in the flare loops, which has been reported by Kumar & Cho (2013) and Kumar et al. (2015).
2.2.2. The Second Stage: Magnetic Reconnection
The second process occurred between 01:25 and 01:28 UT (see Figure 4). A variety of radio bursts such as RS type-III bursts, DPS, and the groups of type-U bursts were observed by YNRSR and HiRAS. Around the peak of the flare (∼01:28 UT), the third group of type-U bursts has the largest number and the fastest generation rate and the time-derivative curve of GOES 1–8 Å soft X-ray flux also shows dramatic variability during this period (see the yellow curve of Figure 2(a)).
2.2.3. The Third Stage: Jet Eruptions
Figures 8(a)–(c) display the evolutionary features of three jets observed by SDO/AIA 304 Å between 01:32:22 and 01:48:22 UT. The first and second jets are straight jets (see Figures 8(a) and (b)), and the second jet has an obvious fall (see the white arrow of Figure 8(c)). The third jet propagates along the magnetic loop, rising and falling together with two plasmoids that are found in the third jet (see the Figure 8(c)). In addition, because of the STEREO-A satellite position, the third jet appeared in the field of view (FOV) of STEREO-A/EUVI A; they showed the third jet with the same movement tendency as the SDO/AIA observed. Furthermore, we also investigated the velocity of each jet in Figures 9 (a) and (b), which show the third jet including two parts; one part has a straight direction with the velocity of 403 km s−1 (anti-sunward), and the other part propagates along the magnetic loop with a rising and falling speed of 106 km s−1. The dashed lines "CD" and "CE" in Figure 9(c) correspond to the second and first jet motion trail, respectively. The velocity of the second jet is about 260 km s−1 and the falling part is in the white dashed box in Figure 9(d). Figure 9(e) displays the first jet, which started at about 01:30 UT with velocity of 352 km s−1, and no matter was found to fall back.

Figure 8. After the type-U bursts, three jets are observed at 01:32:22–01:48:22 UT. (a)–(c) The white arrows indicate the direction of the jet. The Nos. 3 and 2 jets have obviously fallen back. Two plasmoids are marked by green circles in the No. 3 jet. (d)–(f) The No. 3 jet is also observed by STEREO-EUVI A 304 Å; the white arrow in (f) indicates the No. 3 jet moving along a loop.
Download figure:
Standard image High-resolution image
Figure 9. (a) Time slices taken from the AIA 304 Å images at the position marked by the dashed curve AB and dashed lines CD and CE in (c), which correspond to the jets Nos. 3−1's moving directions, respectively. The dashed lines in (b), (d), and (e) are used to derive the attached speeds, respectively.
Download figure:
Standard image High-resolution image3. Conclusions and Discussions
A GOES M1.9 class flare in soft X-rays occurred on 2011 February 9 including three stages: EUV disturbances, magnetic reconnection, and jet eruptions. In the first stage, EUV disturbances propagate from the left upper corner footpoint of the original magnetic loop to the right lower corner footpoint (see Figure 7). In the second stage, after the EUV disturbances, a newly emerging magnetic loop emerges around the right lower corner footpoint (see Figure 4(a)) and may reconnect with the original magnetic loop to form a cusp-shaped structure (see Figure 4(c)). Magnetic reconnection occurs in the current sheet above the cusp-shaped structure, and chromosphere evaporation may be found to occur between the two footpoints (see Figure 4(e)). In the third stage, the magnetic reconnection releases energy and drives the jet eruptions. The scenario of this event is demonstrated in Figure 10; in the magnetic reconnection, the high-resolution observation data of YNSRS shows several type-U bursts, which are hard to resolve in HiRAS data at the same time. After the No. 9 type-U burst, a DPS is recognized with a frequency-drift rate of −6.2 ± 2.7 MHz s−1 (see "DPS-H" in Figure 2(e)). According to the Equation (1), we calculate that the velocity of the plasmoid represented by the DPS is 137 ± 60 km s−1 (anti-sunward), and the plasmoid is also observed by SDO/AA near the loop top of the cusp-shaped structure with a velocity of 212 km s−1 (anti-sunward). The difference of the plasmoid velocities measured in different wavelengths may be due to the projection effect and the uncertainty in the coronal-density model. In addition, we measure the generation rates of type-U bursts before and after the "DPS-H" as 1 per 10 seconds and 5 per 10 s, respectively. The observations are generally consistent with the results of numerical simulations, helping us to better understand the characteristics of the magnetic reconnection.
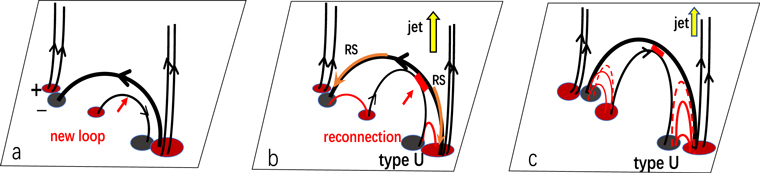
Figure 10. Schematic illustration of the radio bursts and jet eruptions. (a) The newly emerging loop reconnects with the original loop above. (b) The electrons are accelerated by magnetic reconnection to high speed and propagating along the loops as well as pouring into the footpoints (the RS type-III solar radio bursts produced); partial energetic electrons propagate along the loop (red curves in b) by the magnetic mirror effect, and the type-U bursts are produced. (c) Electrons propagate along the fresh loops to produce the Nos. 5 and 7 type-U bursts (red dashed curves in c). Magnetic reconnection also can lead to the formation of jets (yellow arrows in b and c).
Download figure:
Standard image High-resolution image
We also note the frequency range of turnover frequency of type-U bursts before and after the "DPS-H". Before the "DPS-H" (before the plasmoid formation), the turnover frequency of type-U bursts covers a frequency range of 10 MHz. By contrast, after the "DPS-H" (after the plasmoid formation), the frequency range of turnover frequency is about 30 MHz, and the latter is three times the former one. These observations also support the numerical simulations of the energy deposition driven by magnetic reconnection during the flare-impulsive phase, which produces chromospheric evaporation between the two footpoints; the turbulence occurs at the top of the flare loop, and the plasmoids can capture the nonthermal particles and cause the density fluctuation of the loop top.
By analyzing all the type-U bursts in this event, we found that the turnover frequency of all type-U bursts decreased slowly, except the turnover frequency of Nos. 5 and 7 decreased suddenly. This process can be explained by the physical process of the whole flare system expanding and the new loop formed by magnetic reconnection is existing at a higher altitude than the previous loops. The energetic electron beam moving along the newly formed loop makes the turnover frequency of Nos. 5 and 7 decrease significantly. We calculated the rising velocity of the whole flare-loop system as 14.7 ± 0.2 km s−1 (anti-sunward), estimated by Equation (1). We also studied the jet eruptions; after the magnetic reconnection, the velocity of jet eruptions is about 200–400 km s−1.
This work was supported by NSFC grant Nos. 11941003, 11403099, 11663007, 11703089, U1631130, and 11333007, as well as the International Space Science Institute in Beijing (ISSI-BJ). Q.C. was supported by grants from the Natural Science Foundation of Henan Province (grant No. 212300410210). We acknowledge the use of data from the SDO, STEREO, and GOES statellites, the Hiraiso Radio Spectrograph, and the Nobeyama Radio Polarimeter.