


Abstract
We report the probable detection of energetic neutral hydrogen atoms (ENAs) at >0.8 MeV in several large solar energetic particle events observed between 1997 and 2004. The low Earth orbiting SAMPEX satellite detected transient increases of quasi-trapped equatorial protons beginning typically ∼3 hr after the X-ray flare and lasting for up to several hours. Since the magnetic cutoff rigidity is >10 GV at the magnetic latitude where the particles were observed, we interpret the signal as due to ENAs that penetrate Earth's magnetic field and charge exchange in the upper atmosphere, whereupon the charged particles may become trapped. One event outside our survey period (2006 December 5) had previously reported solar flare ENAs, the only example of this phenomenon of which we are aware. Although the statistics are limited, the events we report suggest that the ENAs are produced as the flare-associated coronal mass wjection moves through the corona, as concluded previously for the 2006 December 5 event. The finding of ENAs emitted in conjunction with large solar flares opens a new avenue to understanding these events.
Export citation and abstract BibTeX RIS

Original content from this work may be used under the terms of the Creative Commons Attribution 4.0 licence. Any further distribution of this work must maintain attribution to the author(s) and the title of the work, journal citation and DOI.
1. Introduction
Solar energetic particle (SEP) events accelerate ions over the full range of the periodic table, at energies up to hundreds of megaelectronvolts per nucleon or more. The composition and ionization state of the ions carries information about the source regions, acceleration mechanisms, and transport in the interplanetary medium (e.g., reviews by Desai & Giacalone 2016; Reames 2017). A new source of information about SEP processes opened with the discovery of multi-megaelectronvolt energetic neutral hydrogen atoms (ENAs) emitted from a solar flare on 2006 December 5, and detected on the Solar TErrestrial RElations Observatory (STEREO) spacecraft (Mewaldt et al. 2009). Mewaldt et al. (2009) pointed out that although ENAs would be expected to be copiously produced near the solar surface, they would be stripped as they moved through the corona. They therefore concluded that the ENAs they detected were more likely produced beyond ∼1.6 Rs, including the associated coronal mass ejection (CME)-driven shock. Therefore, this mechanism could permit probing for the first time the interactions of accelerated protons with high coronal material, opening a new area of inquiry for understanding solar flares.
Although the 2006 December 5 event was followed by the cycle 24 solar activity maximum in ∼2010–2018, no further cases of ENA emission have been reported, leaving open the question of the level of rarity of such events. Retrospectively, we have noticed that Greenspan et al. (1999) identified three puzzling events on the low Earth orbiting Solar Anomalous and Magnetospheric Particle Explorer (SAMPEX) satellite, where quasi-trapped ∼0.8 MeV protons near Earth's magnetic equator showed transient increases starting a few hours after large X-ray flares. The radiation belts were quiescent in these periods, and Greenspan et al. were unable to describe a mechanism by which the protons could reach this location since the magnetic cutoff rigidity exceeds 10 GV. It is now clear the events reported by Greenspan et al. may have been caused by ENAs. The ENAs could pass through Earth's magnetic field, and some could interact with the upper atmosphere and be stripped. A subset with the proper orientation could then become trapped by the same mechanism that traps neutrals from the ring current (see Hovestadt et al. 1972; Moritz 1972; Greenspan et al. 1999; Grigorian et al. 2007; Petrov et al. 2008), and singly charged anomalous cosmic rays in the radiation belts (Blake & Friesen 1977; Cummings et al. 1993).
We examined the SAMPEX data and found that the 2006 December 5 event produced a transient equatorial intensity increase similar to those reported by Greenspan et al. (1999). We therefore surveyed a longer period of the mission to search for additional events, and found several. Below we discuss the observational evidence in these events, and statistical properties of both the solar sources, and details of the detection in low Earth orbit.
2. Observations
2.1. Instrumentation
The observations reported here were made with the Low energy Ion Composition Analyzer (LICA) on board the SAMPEX satellite. LICA is a time-of-flight mass spectrometer, but for this paper we used only singles count rates from its array of solid-state detectors whose view field of view (FOV) is 17° × 21°. Each of the four circular detectors had an area of 9.0 cm2, and viewed the incoming radiation through a thin 80 cm2 window 50 cm away, resulting in a total geometrical factor of 0.6 cm2 sr. Protons require 770 keV to reach and trigger the detectors (for additional details see Mason et al. 1993).
SAMPEX was launched 1992 July 3 into an initial 520 × 670 km orbit at 82° inclination (for details see Baker et al. 1993). The satellite re-entered the atmosphere 2012 November 13. SAMPEX was three-axis stabilized and used several pointing programs over the course of the mission. In all pointing modes, the fixed spacecraft solar panels faced the Sun, and the spacecraft rotated around the sunline. The instrument boresight was perpendicular to the sunline and pointed to the local zenith when over Earth's magnetic poles, thus requiring a rotation every half-orbit to point toward the north or south ecliptic pole. For the first event in the list below, the spacecraft was rotating at 1 RPM. For all the other events the rotation was carried out near the magnetic equator, where the instrument boresights were kept pointed perpendicular to the magnetic field so they could observe trapped particles. For some combinations of local times and magnetic field orientation near the equator, the spacecraft would execute a 180° rotation over ∼2 minutes to avoid pointing the instruments into the ram direction (Markley et al. 1995); these maneuvers are visible in some of the events to be discussed.
Figure 1 shows a sample event, the X1/3B flare on 2001 November 4 starting at 16:03 UT at N06W18. The upper panel shows the Geosynchronous Operational Environmental Satellite-10 (GOES-10) X-ray irradiance. The bottom panel shows SAMPEX/LICA solid-state detector counts per second, with Advanced Composition Explorer / Ultra Low Energy Isotope Spectrometer (ACE/ULEIS) scaled solid-state detector counts per second (orange dashed line) showing the interplanetary intensity. Over the course of an orbit the SAMPEX intensities change depending on latitude, longitude, local time, and pointing direction. Blue points show polar cap crossings at magnetic latitude >70°. Count rate spikes just before the start of some polar cap crossings are due to radiation belt electrons. At times when the spacecraft moves through the South Atlantic Anomaly (SAA) there is an additional increase in count rate, as shown around 15:10, when the edge of the SAA is crossed. The count rate minima of a few counts per second are around the crossings of the magnetic equator, and points in red are those within ±5° of the equator. Letters N, S at the bottom identify the polar caps, and filled circles of yellow and black mark dayside versus nightside equator crossings, respectively.
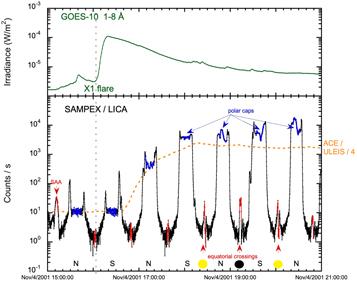
Figure 1. Observations for 2001 November 4. Top panel: GOES-10 X-ray irradiance. Bottom panel: SAMPEX/LICA solid-state detector count rate over several orbits. Red arrows mark transient increases at equatorial crossings (see text for details).
Download figure:
Standard image High-resolution imageThe equatorial crossing count rates are generally a few counts per second during geomagnetically quiet periods (Greenspan et al. 1999). Although this event produced an intense magnetic storm, it did not begin until the shock reached Earth, about 24 hr beyond the end of data in Figure 1. Notice the increase in the equatorial count rate about 2.5 hr after the X-ray event, which continued for several orbits (red arrows) and then decayed.
Close inspection of the three equatorial crossings marked by arrows in Figure 1 indicate structure near the peaks. Figures 2(a)–(c) shows greatly expanded views of these three peaks, which show a decrease near 0° magnetic latitude, just the opposite of what might be expected. These structures are due to 180° rolls of the spacecraft to avoid pointing the instrument into the ram direction, and coincidentally provide a pitch-angle scan in this region. Figure 2(d) shows the data from (a)–(c) plotted versus pitch angle, maintaining the same color codes, and showing strong peaking near 90°, so the particles are mirroring near the equator. Structures of this kind were seen in the equatorial count rates in several of the events reported here, but not in all due to differences in the spacecraft roll program and different roll behavior depending on local time.

Figure 2. (a), (b), and (c) expanded view of equatorial crossings marked by red arrows in Figure 1, with SSD count rates plotted versus magnetic latitude. Each data point is for 6 s accumulation. (d) pitch-angle distribution for panels (a)–(c), using same color codes.
Download figure:
Standard image High-resolution imageThe total number of counts in the peaks is quite large; for example, the peak in Figure 2(b) between ±5° latitude has over 3000 counts. Given the decrease in count rate caused by the pitch-angle changes, we can estimate that the total would have been significantly larger than this if pitch angles near 90° had been sampled continuously.
The question arises regarding the identity of the particles observed in the peaks, since only the solid-state detector trigger is recorded. Electrons appear unlikely due to the relatively high solid-state detector energy threshold (500 keV) and lack of a mechanism for producing trapped electrons at this location. High energy protons can trigger the solid-state detectors, but the spin modulation of the count rate near the equator rules this out since the walls of the telescope are thin and protons of more than a few 10 s of MeV can penetrate them. The spin modulation thus limits the energy of the particles to a few 10 s of MeV or lower, i.e., particles constrained to enter the telescope FOV. For these reasons we believe the particles observed near the equator are protons, most likely with energies close to the threshold of 770 keV.
2.2. Survey Results
Figure 3 shows count rates for 1997 to mid-2004, using the same cuts as Greenspan et al. (1999), namely, averaging over each equatorial pass between ±5° magnetic latitude for particles with pitch angles between 70° and 110°, and also excluding longitudes between 240° E and 15° E to avoid the SAA. Points plotted in red are for geomagnetically undisturbed periods (Dst > −40), while blue points are for disturbed periods (Dst < −40). Spikes during undisturbed periods that stand out most strongly are numbered 1–9 and are listed in Table 1. Three spikes that are less striking are numbered A1–A5 (see Appendix). Events 1, 2, and A1 are the three events identified in Greenspan et al. (1999). After mid-2004 NASA scientific support ended and pitch-angle data is not reliable.

Figure 3. Average count rates over all equatorial crossings (see text for details). Red: periods with Dst > −40; blue: periods when Dst < −40 (geomagnetically disturbed). Numbered spikes correspond to events in Tables 1 and A1. Some panels have a wider y-axis range than others.
Download figure:
Standard image High-resolution imageTable 1. Solar and Interplanetary Properties
| Event | X-Ray Start Time a | Day of Year | Peak Proton Flux >10 MeV a | Importance a | Location a | CME Speed (km s−1) a | NOAA AR a | Magnetic Field Type a | Fe/O 25–80 MeV nuc−1 b | References |
|---|---|---|---|---|---|---|---|---|---|---|
| 1⋯ | 6 Nov 1997 11:49 | 310 | 450 | X9/2B | S18W63 | 1556 | 8100 | β-γ-δ | 0.858 ± 0.011 | c , d , e |
| 2⋯ | 24 Aug 1998 21:50 | 236 | 670 | X1/3B | N25E09 | ⋯ a | 8307 | β-δ | 0.118 ± 0.039 | d , e |
| 3⋯ | 10 Apr 2001 05:06 | 100 | 355 | X2/2B | S23W09 | 2411 | 9415 | β-γ-δ | 0.125 ± 0.005 | |
| 4⋯ | 15 Aug 2001 23:30 | 227 | 493 | ⋯ | W140 b | 1575 | ⋯ | ⋯ | 0.121 ± 0.005 | |
| 5⋯ | 24 Sep 2001 09:32 | 267 | 12900 | X2/2B | S13E23 | 2402 | 9632 | β-γ-δ | 0.016 ± 0.001 | |
| 6⋯ | 4 Nov 2001 16:03 | 308 | 31700 | X1/3B | N06W18 | 1810 | 9684 | β-γ | 0.050 ± 0.001 | e |
| 7⋯ | 20 Jul 2002 21:04 | 201 | 28 b | X3.3 | SE90 b | 1941 | ⋯ | ⋯ | 0.080 ± 0.008 | b |
| 8⋯ | 15 Jun 2003 23:25 | 166 | ⋯ | X1.3/SF | S07E80 | 2053 | 10386 | β | ⋯ | |
| 9⋯ | 28 Oct 2003 09:51 | 301 | 29500 | X17/4B | S16E08 | 2459 | 10486 | β-γ-δ | 0.013 ± 0.001 | e , f |
| 10⋯ | 5 Dec 2006 10:18 | 340 | ⋯ | X9/2N | S07E79 | ⋯ a | 10930 | ⋯ | ⋯ | g |
Notes.
a Data from NOAA reports, magnetic field types are Mt. Wilson classification from NOAA; CME speeds from SOHO/LASCO catalog; SOHO not operating during event 2; LASCO downtime in event 10. b Fe/O events 1–7, 9 from Cane et al. (2006), multiplied by 0.134. c Mason et al. (1999); Cohen et al. (1999). d Greenspan et al. (1999). e GLE, Mewaldt et al. (2012). f Cohen et al. (2005). g Mewaldt et al. (2009).Download table as: ASCIITypeset image
Yearly panels in Figure 3 contain typically ∼6000 crossings. The particle count rate variations seen in the periods in-between event spikes show variations arising from a combination of orbital local time, altitude, pointing program, solar cycle, and geomagnetic variations (see discussion in Greenspan et al. 1999 and references therein). The discontinuity in early 2000 may be related to a large geomagnetic storm (Huttunen et al. 2002).
Table 1 lists events 1–9 shown in Figure 3. Columns 2–9 list NOAA properties for the events: X-ray start time, day of year, peak proton flux >10 MeV, X-ray and optical importance, location, associated CME speed, active region (AR) number, and AR magnetic field type. Column 10 lists the energetic particle Fe/O ratio. This list includes many large solar particle events from this period that have appeared in numerous publications, some of which are noted in Column 11. Solar locations for events 4 and 7 (and A4) are from Cane et al. (2006) who estimated the longitudes based on AR locations; the start time for event 4 is from the first appearance of the associated CME. Four events in the list produced ground level events (GLEs) on terrestrial neutron monitors, which requires ∼500 MeV nuc−1 SEPs (Mewaldt et al. 2012). A detailed discussion of the equatorial increases in the 1997 November 6 event (#1) was given in Greenspan et al. (1999), analogous to the discussion of the 2001 November 4 event above. Event 10 in the table is the STEREO ENA event (Mewaldt et al. 2009) that occurred after mid-2004, but is included for reference and is discussed separately.
Spikes 1–9 in Figure 3 occur during relatively quiet geomagnetic periods. Figure 4 shows each of these events in greater detail, where the equatorial crossing rates are plotted in red, and the high magnetic latitude (>70°) rates are plotted in blue. The x-axis is the epoch time in hours from the associated start time in Table 1. The high latitude rates often show large increases due to the associated solar energetic particle event, although in some cases there is no increase due to a prior event (#3 and #7) or event location in the eastern hemisphere (#8 and #10). From Figure 4 it can be seen that the numbered spikes in Figure 3 may consist of several successive crossings (e.g., events 1, 3, and 6), others are a single spike (e.g., 9 and 10), and others are unclear due to crossings missing due to the applied cuts.

Figure 4. Detector count rates versus epoch hour for each event in Table 1. Note that the y-axis has different ranges depending on the event. Blue: magnetic latitudes >70°; Red: latitudes within ±5° of the magnetic equator.
Download figure:
Standard image High-resolution imageTable 2 lists properties relevant to the SAMPEX observations. Column 2 is the Disturbance Storm Time (Dst) magnetic activity index averaged over 1–6 hr after the flare start time. The Dst values for the events are close to quiet or small substorm levels (e.g., Gonzalez et al. 1994). Column 3 lists two epoch times, the first of which is the crossing with maximum count rate in Figure 4, and the second a subsequent crossing on the other leg of the orbit. The second crossings all are crossings when the data was within the cuts. Columns 4–8 list SAMPEX orbital data averaged over the period within ±5° of the magnetic equator; Column 4 lists the Magnetic Local Time (MLT) at the magnetic equator along the current field line. Column 5 lists the altitude above Earth's surface, and shows the effects of orbital decay over the course of the survey. Column 6 is the L shell, and Columns 7 and 8 list the geographic longitude and latitude.
Table 2. DST and SAMPEX Locations
| GEO | |||||||
|---|---|---|---|---|---|---|---|
| Event | Dst b (nT) | Epoch (hr) | MLT (hr) | Altitude (km) | L shell | Longitude (°) | Latitude (°) |
| 1⋯ | −31.0 | 3.23–4.06 | 5.75–17.4 | 649–546 | 1.083–1.060 | −147.8–20.7 | −0.5–7.6 |
| 2⋯ | −24.5 | 3.78–4.65 | 13.6–1.51 | 598–566 | 1.060–1.100 | 177.1−−14.26 | 5.5–6.3 |
| 3⋯ | −30.0 | 2.56–6.52 | 14.1–2.46 | 614–499 | 1.005–1.065 | 101.2–−139.0 | 4.5–−2.9 |
| 4 a ⋯ | −2.0 | 4.85–5.67 | 8.30–20.9 | 544–559 | 1.020–1.081 | 64.43–−127.8 | 5.6–−5.8 |
| 5⋯ | −32.0 | 3.57–4.34 | 15.2–3.63 | 507–596 | 1.050–1.071 | 33.15–−159.3 | 5.2–−0.5 |
| 6⋯ | −28.5 | 3.22–4.05 | 21.5–9.98 | 483–606 | 1.044–1.071 | 34.28–−157.4 | 6.5–−1.8 |
| 7 a ⋯ | −25.5 | 2.55–9.71 | 9.85 21.8 | 564 476 | 1.033 1.063 | 151.2−−136.1 | 9.0−−4.8 |
| 8 a ⋯ | −1.5 | 3.44–8.98 | 11.7–23.8 | 547–455 | 1.008–1.063 | 132.5–−130.6 | 6.2–−4.0 |
| 9 a ⋯ | −4.0 | 4.52–5.29 | 5.55–17.0 | 515–481 | 1.066–1.041 | −141.3–26.15 | −3.6 10 |
| 10 a ⋯ | 15.6 | 3.60–4.32 | 1.38–1.6 | 470–468 | 1.068–1.027 | −6.6–159.8 | 12.4–8.3 |
Notes.
a Only first point shows a clear increase. b NOAA National Geophysical Data Center.Download table as: ASCIITypeset image
Figure 5 (top panel) shows the solar longitude and latitude of the events in Table 1 along with the locations of x-class and m-class X-ray flares during the survey period, excepting about 20% of the x-class events and 30% of the m-class events on the NOAA list that do not show locations. Numbers represented by the red filled circles in both panels correspond to the event number in Table 1. The events are nearly evenly divided between the solar eastern and western hemisphere. The majority occur in the southern hemisphere, but the statistics are limited. Figure 5 (bottom panel) shows the geographic location of SAMPEX when the maximum equatorial count rate was detected after the X-ray event, along with the adjacent equatorial crossing on the opposite side of Earth. The gap between about −20° and −100° longitude is due to the SAA, which has high intensities near the magnetic equator, precluding detection of small rate increases. The local times appear roughly evenly distributed over the day.

Figure 5. Top: solar longitude and latitude of events (red filled circles), x-class flares (yellow filled circles), and m-class flares (blue dots); Bottom: geographic longitude and local time at SAMPEX during periods when enhanced equatorial ions were detected for each event.
Download figure:
Standard image High-resolution image2.3. 2006 December 5 Event
Figure 6 shows the SAMPEX response during the 2006 December 5 event where Mewaldt et al. (2009) detected ENAs. Figure 6 (left) shows the count rates, with annotations as in Figure 1. The circled equatorial increase is shown in Figure 6 (right), plotted versus magnetic latitude, as in Figures 2(a)–(c). The ∼2 minute long spacecraft roll at the equator produces the same type of decrease shown in Figures 2(a)–(c). Roughly estimating the background level under the peaks at about 3 counts s−1, there are about 450 counts in the peaks between ±5°. In view of the strong peaking seen near 90° pitch angle in Figure 2, the number of counts near 90° in this pass was probably closer to 2–3 times this number or ∼1000–1500 counts total.

Figure 6. Detector count rates versus time for portions of event 10. Left: colors and symbols as in Figure 1. Orange line at top shows interval during which ENAs were detected on STEREO (Mewaldt et al. 2009). Right: count rates during the equatorial pass with maximum signal, showing a decrease as the spacecraft maneuvers near the equator (compare Figures 2(a)–(c)).
Download figure:
Standard image High-resolution image
3. Discussion
Quasi-trapped protons >0.5 MeV observed near the geomagnetic equator have been described previously, wherein particles in the ring current were neutralized by charge exchange with the geocorona, enabling them to penetrate Earth's magnetic field. Some could interact with the upper atmosphere and be stripped again and become temporarily trapped (Hovestadt et al. 1972; Hovestadt & Scholer 1976; Blake & Friesen 1977; Guzik et al. 1989; Mazur et al. 1998; Greenspan et al. 1999). Protons near 0.5 MeV would then drift westward until reaching the SAA, where they would reach low altitudes and be lost (Hovestadt et al. 1972). The timescale for drifting into the SAA is of order 1 hr, and sustained intensities of these particles would require continued replenishment. Increases in these equatorial particles are correlated with geomagnetic disturbances; for example in Greenspan's (1999) survey the threshold was Dst decreases of 100 nT or more.
The quasi-trapped protons described in this paper, however, were observed during geomagnetic quiet periods, and the transient increases followed large solar flare events. These increases are a puzzle, since low energy protons do not have access to the equatorial regions where cutoff rigidities exceed several gigavolts. However, the observation of solar flare ENAs by Mewaldt et al. (2009) identified a source of ENAs that could then become temporarily trapped by interacting with Earth's atmosphere as in the mechanism of Hovestadt et al. (1972) and other references cited above. We discuss our observations in terms of such a process. (We remark that a source from ∼0.5 MeV solar flare neutrons that penetrated the magnetosphere and then decayed before they propagated deep into the atmosphere does not seem reasonable since the window for their decay would be quite short, of order 10 s of ms, compared with their ∼4 hr flight time from the Sun).
Solar ENA protons in the energy range ∼0.8–2 MeV require ∼1.9–3.4 hr to reach Earth. Mewaldt et al. (2009) showed that ENAs in the 5 December 2006 event had arrival times consistent with their having been released in coincidence with the X-ray emission profile. The particle arrival times at STEREO spread over ∼2.5 hr and closely matched the 1–8 Å emission profile for the event. We assume that the other events discussed here had their ENAs emitted roughly at the X-ray flare time. The X-ray pulse typically lasts for an hour or two, so after accounting for velocity dispersion on the way to Earth, the arrival of ENAs at Earth may last for a few hours. If the ENA source is related to the associated CME, an injection length at the Sun of approximately hours could also be expected.
The solar source properties of the events are summarized in Table 1 and Figure 5 (upper panel). Most of the events in the table are X-class events, with large optical signatures as well. Although the statistics are limited, they appear roughly evenly distributed between the solar E/W hemispheres, but most occurred in the S hemisphere. The peak proton flux above 10 MeV is very large in some cases; however, for those events in the eastern hemisphere the magnetic connection to the corona can greatly influence the intensity measured at Earth. The CME speeds are all quite high. The active region magnetic field type shows no discernible pattern for the events. The energetic particle Fe/O ratio measured near Earth is included since some workers ascribe high Fe/O to acceleration near the flare site, and low Fe/O to acceleration at a CME-driven shock (Cane et al. 2006) and this could be relevant if the ENAs were created near the photosphere versus in the associated CME-driven shock as argued by Mewaldt et al. (2009). For the energy range shown in the table, the average SEP ratio is 0.131±0.006 (Reames 2020). Of the eight events with measured Fe/O, all but one are below average and so would be considered consistent with a non-flare source such as a CME.
Details of detection at SAMPEX are in Table 2 and Figure 5 (lower panel). Referring to the figure, there is an obvious gap between from −10° to −100° longitude, due to the SAA. The figure also shows that the events were detected at all local times.
If the pulse of ENAs basically impinges only on the sunward hemisphere, there could be a correlation between the equatorial proton increases and Earth's orientation at the time of arrival. For example, if the SAA was in the middle of the sunward hemisphere at the time of arrival, the quasi-trapped proton signal might be lessened since ENAs in the SAA might penetrate too low to allow trapping. We searched for such effects and found none. This might be related, e.g., to dependence of the injection mechanism on longitude or altitude, but we cannot tell.
A seemingly odd feature of the equatorial proton increases reported here is the relatively small dynamic range of the signals, which contrasts greatly with the orders of magnitude ranges of X-ray intensity and proton peak intensity. While the CME speeds, where measured, range over a factor of only 2–3, it is well known that such differences are enough to produce very large SEP intensity variations (Kahler 2001). It is possible that the small range of signals is supportive of Mewaldt's (2009) argument for a CME-associated source of the ENAs in the high corona, since the dynamic range in such events may well be far less than that of the flare processes near the surface. In this regard, event 4 with a tentative location of W140 (Cane et al. 2006) may be a critical case since X-rays were not visible from Earth, and so the CME in this case is the likely source. (Event A4 may also be of the same type, with location E100, and a relatively small X-ray flare which may be due to occultation by the limb.)
The ENAs on STEREO totaled ∼80 counts over ∼2.5 hr for the 5 December 2006 event. The counts were observable only because the parent event was in the eastern solar hemisphere and the much more numerous charged particles had not yet reached the spacecraft. In such a case, it is essentially required that the event be an eastern hemisphere event to produce a detectable signal. That is not required for the SEP ENAs presented here since Earth's magnetic field excludes all the low energy charged particles, allowing detection of events anywhere on the solar surface. Future missions using low Earth orbit observations have been proposed for high energy solar flare studies (e.g., Section 10.5.2.4 in Baker et al. 2013). Even though the quasi-trapped protons from ENAs have a limited lifetime, even a single ∼2.5 minutes pass during event 10 observed several hundred counts (Figure 6), greatly exceeding the interplanetary numbers reported by Mewaldt et al. (2009). Following Moritz (1972) and Hovestadt et al. (1972), Greenspan et al. (1999) pointed out that the ratio of low altitude equatorial particles observed on SAMPEX to incoming neutrals is expected to be large (2200 E2.77) since the creation cross section greatly exceeds the loss cross section for collision with an atmospheric particle. Since the equatorial protons reported here presumably are formed by the same process, namely, capture of a neutral particle stripped by collision with the high atmosphere, a large increase over the interplanetary intensities is plausible after taking account that the particles trapped for approximately an hour can be sampled by the detector many times instead of moving past the detector once.
We thank NOAA for the solar and geophysical data and indices used in this paper; and the SOHO Large Angle Spectrometric Coronagraph (LASCO) CME catalog used for CME speeds and the start time of event 4. We thank the referee for helpful suggestions. This work has been supported by NASA grant NNG06GB88G for the SAMPEX data center.
Appendix
Several events in Figure 1 showed spikes that were smaller than events 1–9, and these are listed in Table A1 below as events A1–A5, with the corresponding solar data. Following the survey period in Figure 1, we noticed several other interesting cases, and they are listed in Table A1 as well. Events A6, A7, and A8 occurred during a 3 day period in 2005 when AR 10808 was in the eastern solar hemisphere and produced a number of large X-ray flares. The maximum count rate spikes were quite large (∼10 counts s−1 for A6 and A7). Event A9 was discovered while examining the STEREO ENA event (#10), which originated in the same AR the day before. Its maximum equatorial count rate was 60 counts s−1 in a single spike, considerably larger than the increase seen in the STEREO ENA event (Figure 4).
Table A1. Solar and Interplanetary Properties—Additional Events
| Event | X-Ray Start Time a | Day of Year | Peak Proton Flux >10 MeV a | Importance a | Location a | CME Speed (km s−1) a | NOAA AR a | Magnetic Field Type a | Fe/O 25–80 MeV nuc−1 b | References |
|---|---|---|---|---|---|---|---|---|---|---|
| Smaller Events during Survey Period | ||||||||||
| A1⋯ | 30 Sep 1998 13:08 | 273 | 1200 | M2/2N | N23W81 | ⋯ | 8340 | α | 0.272 ± 0.008 | d |
| A2⋯ | 24 Nov 2000 14:51 | 329 | 942 | X2/2B | N22W07 | 1245 | 9236 | β | 0.342 ± 0.056 | |
| A3⋯ | 28 Jan 2001 15:40 | 28 | 49 | M1/1N | S04W59 | 916 | 9313 | β-γ | 0.600 ± 0.051 | |
| A4⋯ | 8 Jan 2002 18:14 | 8 | 91 b | C9.6 | NE100 b | 1794 | ⋯ | ⋯ | ⋯ | b |
| A5⋯ | 18 Jul 2002 20:16 | 199 | ⋯ | C3.3 | S06E39 | 2191 | 10036 | β-γ | ⋯ | |
| Events from Post-survey Period | ||||||||||
| A6⋯ | 7 Sep 2005 17:17 | 250 | 1880 | X17/3B | S06E90 | . . . | 10808 | α | 0.0536 ± 0.001 | |
| A7⋯ | 9 Sep 2005 19:13 | 252 | ⋯ | X6/2B | S10E58 | 2257 | 10808 | β-γ-δ | ⋯ | |
| A8⋯ | 10 Sep 2005 21:30 | 253 | ⋯ | X2 | S13E47 | 1893 | 10808 | β-γ-δ | ⋯ | |
| A9⋯ | 6 Dec 2006 18:29 | 340 | 1980 | X6/3B | S06E63 | ⋯ | 10930 | β | ∼0.075 | c |
Notes.
a Data from NOAA reports, magnetic field types are Mt. Wilson classification from NOAA; CME speeds from SOHO/LASCO catalog; SOHO not operating during event A1; LASCO downtime during event A6; only one point for event A9 so CME speed not determined. b Fe/O events A1–A3, A6, from Cane et al. (2006), multiplied by 0.134. c Event A9, 12–60 MeV nuc−1 from Cohen et al. (2008). d Greenspan et al. (1999).Download table as: ASCIITypeset image