


Abstract
The results of gamma-ray observations of the binary system HESS J0632 + 057 collected during 450 hr over 15 yr, between 2004 and 2019, are presented. Data taken with the atmospheric Cherenkov telescopes H.E.S.S., MAGIC, and VERITAS at energies above 350 GeV were used together with observations at X-ray energies obtained with Swift-XRT, Chandra, XMM-Newton, NuSTAR, and Suzaku. Some of these observations were accompanied by measurements of the Hα emission line. A significant detection of the modulation of the very high-energy gamma-ray fluxes with a period of 316.7 ± 4.4 days is reported, consistent with the period of 317.3 ± 0.7 days obtained with a refined analysis of X-ray data. The analysis of data from four orbital cycles with dense observational coverage reveals short-timescale variability, with flux-decay timescales of less than 20 days at very high energies. Flux variations observed over a timescale of several years indicate orbit-to-orbit variability. The analysis confirms the previously reported correlation of X-ray and gamma-ray emission from the system at very high significance, but cannot find any correlation of optical Hα parameters with fluxes at X-ray or gamma-ray energies in simultaneous observations. The key finding is that the emission of HESS J0632 + 057 in the X-ray and gamma-ray energy bands is highly variable on different timescales. The ratio of gamma-ray to X-ray flux shows the equality or even dominance of the gamma-ray energy range. This wealth of new data is interpreted taking into account the insufficient knowledge of the ephemeris of the system, and discussed in the context of results reported on other gamma-ray binary systems.
Export citation and abstract BibTeX RIS

Original content from this work may be used under the terms of the Creative Commons Attribution 4.0 licence. Any further distribution of this work must maintain attribution to the author(s) and the title of the work, journal citation and DOI.
1. Introduction
The most common definition of gamma-ray binaries is based on their composition and their energy output: a gamma-ray binary consists of a compact object orbiting a star, with periodic releases of large amounts of nonthermal emission at energies >1 MeV (Dubus 2013). The class of gamma-ray binary sources consists of fewer than ten members, and every member shows different characteristics. For all of them, except HESS J1832-093 (Martí-Devesa & Reimer 2020), it is known that the massive star is either a Be-type star surrounded by an equatorial circumstellar disk, or an O-type star.
In contrast, the nature of the compact object is unknown for many of the systems. Exceptions are the gamma-ray pulsar binaries PSR B1259-63/LS 2883 and PSR J2032 + 4127/MT91 213, each of which consists of a neutron star and a Be-type star. Pulsations were first discovered in the radio regime for the former one (Johnston et al. 1992) and in the gamma-ray regime for the latter (Abdo et al. 2009). Recently, a transient periodic radio signal in the direction of LS I +61° 303 was claimed (Weng et al. 2021). Together with the magnetar-like flares and the superorbital modulation detected in LS I +61° 303, these are strong hints for a strongly magnetized neutron star in the system (Gregory 2002; Torres et al. 2012; Ackermann et al. 2013). For the binary system HESS J0632 + 057, which also hosts a Be star (MWC 148), the observational characteristics point toward a neutron star as the compact object, interacting with the circumstellar disk of the Be star. Spectroscopic measurements of Hα emission from the Be star indicate a ≤2.5 M⊙ neutron star (Li et al. 2011; Moritani et al. 2018). However, a microquasar scenario, in which particles are accelerated in the jets of a black hole, cannot be ruled out (see Bosch-Ramon & Khangulyan 2009 for a review).
HESS J0632 + 057 was serendipitously discovered as a point-like source at energies above 400 GeV with the H.E.S.S. experiment during a scan of the Monoceros Loop and Rosette Nebula region (Aharonian et al. 2007). This gamma-ray source is coincident with the massive emission-line star MWC 148, which is of spectral type B0pe at a distance of 1.1–1.7 kpc (Morgan et al. 1955; Hinton et al. 2009; Aragona et al. 2010). Associated with this Be star, an X-ray source was detected at soft X-ray energies using XMM-Newton observations, named XMMU J063259.3 + 054801 (Hinton et al. 2009).
The nondetection with the VERITAS experiment (Acciari et al. 2009) provided evidence for variability of HESS J0632 + 057 at gamma-ray energies. HESS J0632 + 057 was later detected again in 2011 February by MAGIC and VERITAS at very high energy (VHE) (Aleksić et al. 2012; Aliu et al. 2014). This detection took place during a high state in X-rays measured with the Neil Gehrels Swift Observatory X-Ray Telescope (Swift-XRT; Falcone et al. 2011). The period of 321 ± 5 days found in X-ray data taken with Swift-XRT established finally the binary nature of HESS J0632 + 057 (Bongiorno et al. 2011). Aliu et al. (2014) later confirmed the periodicity with a larger Swift-XRT data set to be  days. HESS J0632 + 057 was detected after 9 yr of accumulating Fermi-LAT data in the orbital phase range 0.0–0.5 (Li et al. 2017) but, because of low statistical significance of the results, the orbital period in the high-energy band could not be determined. The spectral energy distribution (SED) of HESS J0632 + 057 shows two components at high energies, which is typical for gamma-ray binaries (Dubus 2013).
In the radio band, observations were conducted with the Giant Metrewave Radio Telescope (GMRT; 5 GHz) and the Very Large Array (VLA; 1280 GHz; Skilton et al. 2009). They revealed a point-like radio source at the position of MWC 148, at both radio wavelengths, and variability on timescales of roughly one month in the 5 GHz emission. Extended and variable radio emission at 50–100 au scales at 1.6 GHz was discovered by Moldón et al. (2011b) using the European VLBI Network (EVN). They monitored the source over the 2011 January–February X-ray outburst, detecting a shift of the peak of the emission by 21 au over 30 days. Similar behavior has been found in other gamma-ray binaries, such as PSR B1259-63/LS 2883 (Moldón et al. 2011a), LS 5039 (Moldon et al. 2011), or LS I +61° 303 (Massi et al. 2001), which also show a radio morphology with a central core and one-sided extended emission a few au in length.
The actual orbital geometry including eccentricity, position of apastron and periastron, and inclination of the HESS J0632 + 057 binary system is essentially unknown. Two different orbital solutions derived from optical measurements exist with large uncertainties quoted for all relevant parameters. They are derived through different methods and are based on different data sets (see Figure 1). They follow the same definition of phase ϕ = 0 as MJD = 54,857.0, arbitrarily set to the date of the first Swift-XRT observations (Bongiorno et al. 2011). One solution comes from Casares et al. (2012) using the photospheric absorption lines (mainly He i) of data taken in 2008–2011, and taking the centroid velocity of the Hα emission line to check for the orbital period of the binary (which was fixed to 321 days). The other solution is from Moritani et al. (2018) based on the bisector velocity of the Hα wing, regarding the wavelength where the wing intensity is the same on the blue and red sides as at the center (Shafter et al. 1986) of the Hα emission line from data taken in 2013–2017. The main differences between the two solutions lie in the eccentricity of the orbit and in the orbital phase of periastron passage:  ≃ 0.8 versus ≃ 0.6 and ϕ = 0.967 versus ϕ = 0.663 (Casares et al. 2012; Moritani et al. 2018), respectively. The second significant difference is the prediction of the mass of the compact object as a function of the inclination of the system. The orbital solution provided by Casares et al. (2012) sets an inclination limit of >60° for masses of the compact object consistent with a nonaccreting pulsar. The differences may be due to the different methods applied (absorption versus emission spectra, folding period fixed versus Fourier analysis, epoch of observations, etc.) or due to the sparse data set used by Casares et al. (2012), in which the observations are slightly clustered around periastron.

Figure 1. Illustration of the two suggested orbital solutions for HESS J0632 + 057 as seen from above the orbital plane. The very large uncertainties reported for each solution are not shown. Top: orbital solution derived from measurements of photospheric lines of the Be star (Casares et al. 2012). Bottom: orbital solution derived from measurements of the radial velocity of the Hα line (Moritani et al. 2018, Table 1, for Porb = 313 days). The massive star is indicated by the black marker. Crosses mark intervals of 0.1 in orbital phase, numbers indicate values for apastron and periastron orbital phase. The dotted line illustrates roughly the size of the disk of the Be star as derived from Hα measurements (Moritani et al. 2015; Zamanov et al. 2016).
Download figure:
Standard image High-resolution imageThe Be star in the HESS J0632 + 057 binary, MWC 148, has been studied together with the properties of its disk through optical spectroscopic observations by Moritani et al. (2015) and Zamanov et al. (2016, 2021). Applying the geometry derived by Casares et al. (2012), Zamanov et al. (2016) suggest that the compact object passes deeply into the disk during the periastron passage and that the circumstellar disk is likely truncated by the orbiting compact object. In contrast, Moritani et al. (2015) conclude from the nondetection of variations in Fe ii emission lines that the interaction between the compact object and the Be star disk occurs at a distance of two to seven stellar radii from the Be star. Furthermore, they deduced that the detected short-term (≤50 days) disk variability is caused by the interaction of the pulsar wind with the disk, rather than by tidal forces.
Optical polarization studies by Yudin et al. (2017) revealed variation in both polarization degree and polarization angle. This finding can be explained by perturbations of the circumstellar material close to periastron passage, applying the orbital solution by Casares et al. (2012), or before and after apastron passage, following the solution of Moritani et al. (2018). However, an additional source of polarized emission, such as a jet, might also explain the changes in polarization (Yudin et al. 2017).
Rea & Torres (2011) performed an X-ray timing and spectral analysis of HESS J0632 + 057 during its high and low states to obtain better insight into the nature of the compact object. No periodic or quasi-periodic signal in any of the emission states was found. Their calculated upper limit on the amplitude of a sinusoidal signal—defined as X-ray pulsed fraction of HESS J0632 + 057—is comparable to limits found for the well-studied binaries LS I +61° 303 and LS 5039. Recently, however, Yoneda et al. (2020) claim to have detected a period of ∼9 s in LS 5039. We caution that the significance after trials is not large for the different observations, that the period detected during different observations varies and requires a high and positive  , that the orbital corrections do not increase the pulse significance as expected, and that after background subtraction two data sets give rather different pulse fractions. A recent paper by Volkov et al. (2021) finds that the statistical significance of this feature is too low to claim it as a real detection. Comparing the spectral evolution of HESS J0632 + 057 with the TeV binaries LS I +61° 303 and LS 5039 reveals some differences. Specifically, HESS J0632 + 057 shows a steeper X-ray spectrum when the flux is higher, whereas the other two binaries show the opposite behavior. A comparison of the X-ray spectra during the different orbital phases of HESS J0632 + 057 will be discussed later in this paper.
The most recent study of simultaneous observations at hard X-rays with NuSTAR and in TeV gamma-rays with VERITAS was performed by Archer et al. (2020). The data were taken during a period of rising flux. The authors applied a leptonic model, assuming the compact object to be a pulsar, and claim that, under this simple assumption, HESS J0632 + 057 follows the same trend as other binaries: the magnetization of the wind decreases with greater distance from the compact object. According to Archer et al. (2020), this finding strengthens the pulsar scenario for HESS J0632 + 057.
This paper presents results from 15 yr of gamma-ray observations, several years of X-ray observations, and optical observation of HESS J0632 + 057 during different orbital phases. The paper is structured as follows. In Section 2 the instruments used for the studies are described. The results are then presented in Section 3. There the details of the overall light curve, the phase-folded light curves, and the spectra measured during different phases are shown. In Section 3.3 the correlation studies between measurements in the optical (Hα observations), X-ray, and VHE are shown. Subsection 3.4.1 presents the data from the unusual bright outburst from 2018 January. The results are discussed in Section 4 and summarized with final remarks in Section 5.
2. Observations
2.1. H.E.S.S. Gamma-Ray Observations
The H.E.S.S. (High Energy Stereoscopic System) experiment is an array of five imaging atmospheric Cherenkov telescopes located in the Southern Hemisphere in the Khomas Highland of Namibia ( S,
S,  E), at an elevation of 1800 m above sea level. Four telescopes of the array (CT 1–4) have 12 m diameter mirror dishes. A larger, 28 m diameter telescope (CT 5) was deployed at the site in 2012 July during the H.E.S.S. phase-II upgrade.
The telescopes CT 1–4 have been in operation since 2004 (Hinton & the HESS Collaboration 2004) and have a 5° diameter field of view (FoV). CT 5 is equipped with a camera with a 3.5° diameter FoV. Using only CT 1–4, as is done in this work, H.E.S.S. is sensitive to gamma-rays with energies from ∼0.2 TeV up to tens of TeV for observations at zenith.
The H.E.S.S. observations of HESS J0632 + 057 cover almost 14 yr (2004 March–2018 February), totalling 120 h of data after quality cuts, dead-time corrected and taken under dark sky conditions (Table 1). Analysis of 73 h of data obtained prior to 2012 February (MJD 55,951) was reported in Aliu et al. (2014) and these data are reanalyzed in this work, applying improved calibration and reconstruction methods for this paper. All available H.E.S.S. data were processed with the Image Pixel-wise fit for Atmospheric Cherenkov Telescope (ImPACT) analysis (Parsons & Hinton 2014) with std_ImPACT cut configuration, which requires a minimum of 60 photoelectrons per image.
Table 1. Summary of Gamma-Ray Observations of HESS J0632 + 057
| Observatory | Observation | Range of | Range of | Observation | Observation |
|---|---|---|---|---|---|
| Type a | Elevations | Energy Thresholds | Time c | Range | |
| (deg) | (GeV) b | (minutes) | (yr) | ||
| VERITAS | nominal HV | 43–64 | 160–630 | 14,995 | 2008–2019 |
| VERITAS | reduced HV | 53–64 | 420–630 | 630 | 2012–2018 |
| H.E.S.S. | CT 1–4 | 32–62 | 260–680 | 7200 | 2004–2018 |
| MAGIC | Stereo | 38–67 | 147–251 | 4080 | 2010–2017 |
Notes.
a VERITAS observations under bright moonlight conditions require different photomultiplier tube camera settings and are labeled with reduced high voltage (HV). b The energy threshold is defined as the lowest energy for events to be used in the analysis. Note that these definitions vary between the observatories, as different spectral reconstruction methods are applied. c Observation time after quality cuts and dead-time correction.Download table as: ASCIITypeset image
The signal was extracted from a circular region of radius 0.07° centered on the position of HESS J0632 + 057. For the background estimation, the reflected background method (Fomin et al. 1994; Berge et al. 2007), which ensures that the regions used for signal (ON) and background (OFF) extraction have the same acceptance in the FoV of the camera, was applied. A cross-check of the main analysis was performed using the Model++ analysis (de Naurois & Rolland 2009), yielding compatible results.
2.2. MAGIC Gamma-Ray Observations
The MAGIC (Major Atmospheric Gamma-Ray Imaging Cherenkov Telescopes) experiment is a stereoscopic system of two 17 m diameter imaging atmospheric Cherenkov telescopes. It is located on the Canary Island of La Palma, Spain, at the observatory El Roque de Los Muchachos ( N,
N,  W, 2200 m above sea level). It is equipped with pixelized cameras covering a field of view with a diameter of ∼3
 5. The MAGIC telescopes reach a trigger threshold down to 50 GeV and a sensitivity of ∼ 0.6% of the Crab Nebula flux above 250 GeV in 50 hr of observations at zenith angles <30° (Aleksić et al. 2016).
MAGIC observed HESS J0632 + 057 from 2010 October until 2017 November for a total of 68 hr (Table 1). The data set taken during an X-ray outburst occurring from 2010 October to 2011 March was published in Aleksić et al. (2012). The most recent data cover 2015 December to 2017 November. After quality cuts and correction for dead-time, 57.3 hr of good data remain. These observations were taken both under dark conditions (30.9 hr) and under moderate-to-strong moonlight (26.4 hr). They were carried out in wobble mode, pointing at two regions symmetrically 0.4° away from the source position to simultaneously evaluate the background (Fomin et al. 1994). The data have been analyzed using the standard MAGIC procedure (Zanin et al. 2013). The recorded images were calibrated, cleaned, and parameterized (Hillas 1985; Albert et al. 2008a), while applying different cleaning levels and size cuts for the data in moderate-to-strong moonlight according to Ahnen et al. (2017). The background rejection and the estimation of the gamma-ray arrival direction were performed using the random forest method (Albert et al. 2008b).
2.3. VERITAS Gamma-Ray Observations
The VERITAS (Very Energetic Radiation Imaging Telescope Array System) telescope array is composed of four imaging atmospheric Cherenkov telescopes located at the Fred Lawrence Whipple Observatory in southern Arizona (1268 m above sea level, 31°40'N, 110°57'W; Weekes et al. 2002). Each telescope has a 12 m diameter segmented mirror of ≈100 m2 area. Cherenkov light emitted in extensive air showers is reflected onto photomultiplier cameras covering a field of view of 35 diameter.
The VERITAS observations of HESS J0632 + 057 (VER J0633+057) have been obtained over 11 yr, from 2008 December to 2019 January. For a detailed discussion of the evolution of the performance of the VERITAS instrument with time, see Park & VERITAS Collaboration (2015).
VERITAS observed HESS J0632 + 057 for a total dead-time corrected exposure time of 260 hr, after the application of standard data selection cuts to account for nonoptimal weather or hardware conditions (see Table 1 for details). HESS J0632 + 057 was observed at an average elevation angle of 60° and at a fixed offset of 05 from the center of the camera's field of view. Observations were taken typically in dark sky conditions, with the exception of a small fraction (∼10 hr) of the data set which was obtained during 30%–65% moonlight. The latter results in a higher energy threshold and reduced sensitivity compared to observations taken under nominal sky conditions (Archambault et al. 2017).
Data were analyzed using VERITAS standard analysis software tools utilizing boosted decision trees for gamma–hadron separation based on image parameters (see, e.g., Krause et al. 2017; Maier & Holder 2017). The source region was defined as a circle with radius 009 around the nominal position of the X-ray source XMMU J063259.3 + 054801. Background event rates are estimated using the reflected background method (Fomin et al. 1994), assuming typically six background regions located symmetrically with respect to the signal region around the camera center. Light-intensity calibration factors obtained from regular monitoring of the optical throughput and of the detector performance are applied to take time-dependent changes in the instrument response into account (Nievas & VERITAS Collaboration 2021). The observations up to 2017 March (MJD 57,822) have been presented before (Aliu et al. 2014; Maier & VERITAS Collaboration 2017). These data have been reanalyzed applying improved calibration and background suppression methods.
2.4. X-Ray Observations
This study includes data obtained with the Swift-XRT, XMM-Newton, Chandra, and NuSTAR instruments. All data presented in Malyshev et al. (2019) were used, adding also Swift-XRT and Chandra data obtained after the publication of the aforementioned paper. Here, only details of analysis for these additional data are provided; for a description of the analysis of NuSTAR and Suzaku data, see Sections 2.4 and 2.5 of Malyshev et al. (2019).
The Swift-XRT data taken between 2018 December 5 and 14 were analyzed with the heasoft v.6.22 software package and reprocessed with xrtpipeline v.0.13.4, as suggested by the Swift-XRT team.
119
The spectra were extracted with xselect, using a  circle for source counts and an annulus centered at the source position with inner/outer radii of
  /
/ for the background. Chandra data were analyzed using CIAO v.4.9 software and CALDB 4.7.6. The data were reprocessed with the chandra_repro utility, source and background spectra with corresponding redistribution matrix files (RMF), and ancillary response files (ARF) were extracted from circular regions of radii
  (source) and
  (background) with the specextract tool. Two Chandra observations (obs. IDs 20974 and 20975; total exposure ∼70 ks) were performed over 2018 February 19–21, about two weeks after the last Chandra observation presented in Malyshev et al. (2019).
For each analyzed X-ray energy spectrum, neighboring energy bins were merged until each bin contained at least one count. Obtained spectra were then fitted in the 0.3–10 keV energy range. The reported fluxes were extracted from the fit of the spectra with an absorbed power-law model (cflux*phabs*po) with XSPEC v.12.9.1m. The fit was performed with Cash statistics, suitable for the analysis of low-statistics data (Cash 1979).
2.5. Optical Hα Observations
High-dispersion Hα profiles of the Be star in HESS J0632 + 057 were obtained using the HIDES (High-Dispersion Echelle Spectrograph), a fiber-fed system (Kambe et al. 2013) deployed on a 188 cm telescope at Okayama Astrophysical Observatory (OAO). 120 Furthermore, spectra using ESPaDOnS (Echelle SpectroPolarimetric Device for the Observation of Stars) at the Canada–France–Hawaii Telescope (Manset & Donati 2003) from 2013 October 31 to 2017 April 13 were obtained; see Table 2. The resolving power, R, of HIDES and ESPaDOnS is ∼50,000 and ∼68,000, respectively.
Table 2. Summary of Hα Profile Measurements of the Be Star MWC 148 in HESS J0632 + 057 using HIDES
| Observation | Number of | Total |
|---|---|---|
| Time Range | Pointings | Exposure Time |
| (YYYYMMDD) | (min) | |
| 20131031–20140410 | 14 | 2809 |
| 20141104–20150402 | 17 | 2350 |
| 20160107–20160330 | 6 | 1020 |
| 20161206–20161223 | 2 | 443 |
| 20170224–20170413 | 7 | 1210 |
Download table as: ASCIITypeset image
The observations and the data reduction steps are described in detail in Moritani et al. (2018); a short summary is provided here. The HIDES data were reduced using IRAF. The ESPaDOnS data were reduced using the Libre-Esprit/Upena pipeline, provided by the instrument team. The continuum level around the Hα line was refitted and the spectrum was normalized in order to compare with the HIDES data.
The radial velocity was measured as the bisector velocity of the wing of the Hα profile (Moritani et al. 2018) and the FWHM was determined by fitting the middle and bottom of the profiles with a single Gaussian function. The equivalent width (EW) was estimated by simply integrating the profiles. The observations are summarized in Table 2.
3. Results
The gamma-ray observations of HESS J0632 + 057 with H.E.S.S., MAGIC, and VERITAS amount to a large, ∼450 hr data set covering 15 yr, from 2004 to 2019 (see Table 1). The aggregated detection significance over the entire data set, calculated at the position of the X-ray source XMMU J063259.3 + 054801, is 17.9σ for H.E.S.S., 8.9σ for MAGIC, and 27.0σ for VERITAS. Statistical significances are calculated using Equation (17) from Li & Ma (1983). Systematic uncertainties for gamma-ray measurements originate mostly from variations in the atmospheric throughput to Cherenkov photons, mirror reflectivity, camera response, and errors in the background estimations as well as in the efficiencies of signal-selection cuts. The systematic uncertainty is estimated to be 10%–20% on the gamma-ray flux and 0.10–0.15 on the spectral index (Aleksić et al. 2016; Aharonian et al. 2006). Gamma-ray observations are grouped in intervals of approximately 10% of the orbital period due to the generally weak detection significance of individual observations. Shorter periods are used for the flux calculations during high states.
Integral gamma-ray fluxes are calculated throughout this paper above an energy of 350 GeV adopting a gamma-ray spectral index of Γ = 2.6, which is representative for the data sample (see Table 4 and Section 3.4).
3.1. Light-curve Modulation and Determination of Orbital Period
The long-term light curves (Figure 2) confirm that HESS J0632 + 057 is highly variable at X-ray and gamma-ray energies (see also Acciari et al. 2009; Bongiorno et al. 2011; Aliu et al. 2014). Above 350 GeV, the flux varies between 5% and 10% with respect to the flux of the Crab Nebula (above the same energy), dropping below the detection limits of the different ground-based instruments for some periods.
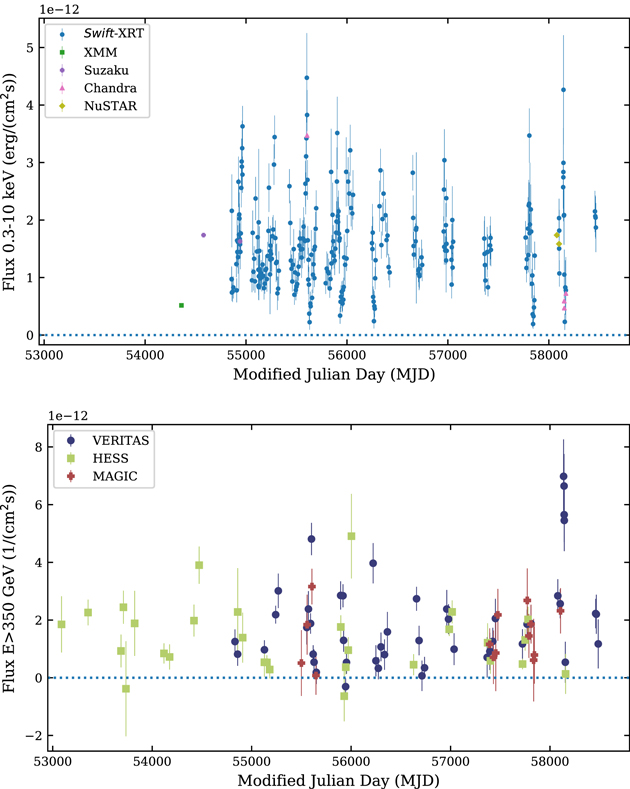
Figure 2. Top: long-term observations of HESS J0632 + 057 in X-rays (0.3–10 keV) with Swift-XRT, XMM-Newton, Suzaku, Chandra, and NuSTAR. Bottom: long-term observations of HESS J0632 + 057 in gamma-rays (>350 GeV) with H.E.S.S., MAGIC, and VERITAS. Vertical lines indicate 68% statistical uncertainties; note that these are smaller than the marker size for all X-ray instruments except Swift-XRT.
Download figure:
Standard image High-resolution imageThe large data sets allow us to search for periodic variability patterns on different timescales. The period was first determined to be 321 ± 5 days by Bongiorno et al. (2011) using approximately two years of Swift-XRT measurements (MJD 54,857 to 55,647). Subsequent updates to this analysis, based on extended data sets from Swift-XRT, yielded comparable results of Porb = 313–321 days (Aliu et al. 2014; Moritani et al. 2018; Malyshev et al. 2019). Flux modulations of the X-ray light curve are interpreted in the literature as being due to the orbital period of the binary system. The only non-X-ray measurement of the orbital period, based on optical observations of Hα radial velocity profiles, yielded  days (Moritani et al. 2018), again compatible with previous results (see Table 3 for a summary of the measurements of orbital period). Although Casares et al. (2012) did not estimate the orbital period, they showed that the main parameters of the Hα emission line (equivalent width, FWHM, and centroid velocity) are modulated within the 321 day X-ray period and calculated an orbital solution of the binary.
Table 3. Results of Derivation of the Orbital Period from Literature in Comparison with the Outcome of This Work
| Publication | Energy Range | MJD Range | Method | Orbital Period |
|---|---|---|---|---|
| (days) | ||||
| Bongiorno et al. (2011) | Swift-XRT | 54,857–55,647 | Peak fitting | 321 ± 5 |
| Aliu et al. (2014) | Swift-XRT | 54,857–55,972 | ZDCF |

|
| Moritani et al. (2018) | Swift-XRT | 54,857–57,052 | ZDCF |

|
| Moritani et al. (2018) | Hα | 56,597–57,856 | Fourier analysis |

|
| Malyshev et al. (2019) | Swift-XRT | 54,857–57,860 | PCC |

|
| This work | X-ray | 54,857–58,466 | PCC | 317.3 ± 0.7(stat) ± 1.5(sys) |
| This work | X-ray | 54,857–58,466 | PDM | 316.7 ± 1.5(stat) ± 1.5(sys) |
| This work | X-ray | 54,857–58,466 | DCF | 318.9 ± 2.2(stat) ± 1.5(sys) |
| This work | Gamma-ray | 53,087–58,490 | PCC | 316.7 ± 4.4(stat) ± 2.5(sys) |
| This work | Gamma-ray | 53,087–58,490 | PDM | 319.0 ± 3.4(stat) ± 2.5(sys) |
Note. The applied methods are: peak fitting (Bongiorno et al. 2011), Z-transformed discrete correlation functions (Alexander 1997, ZDCF), phase dispersion minimization (Stellingwerf 1978, PDM), discrete correlation functions (Edelson & Krolik 1988, DCF), and correlation analysis comparing the light curves with a binned-average light curve (Malyshev et al. 2019, PCC). Errors indicate 1σ statistical uncertainties.
Download table as: ASCIITypeset image
The analysis of the most recent available Swift-XRT data set including the reanalysis of older data (264 data points for MJD 54,857–58,466; see Figure 2, top), considered in this study using a method based on Pearson's correlation coefficient (PCC method; see Appendix A), results in an orbital period of Porb = 317.3 ± 0.7(stat) ± 1.5(sys) days (see Table 3). Systematic uncertainties are derived from the application of the different methods for the period derivation applied to 1000 Monte Carlo (MC)-generated data sets. The description of the application of additional methods, such as discrete correlation functions (DCF) or phase dispersion minimization (PDM), together with details of the analysis of the period and derivation of the associated systematic uncertainties, can be found in Appendix A. Periodic signals on timescales different from the orbital period have been observed in high-mass X-ray binaries, e.g., the superorbital period of 1667 days detected in radio, optical, X-ray and gamma-ray observations of the binary LS I +61° 303 (Gregory 2002; Li et al. 2011; Ackermann et al. 2013; Paredes-Fortuny et al. 2015b; Ahnen et al. 2016; Kravtsov et al. 2020). A signal at periods other than the orbital period has not been found for periods between 50 and 1000 days in an analysis of the X-ray observations of HESS J0632 + 057 using the PCC method (see Appendix A and Figure 12(d)). The analysis of MC-generated light curves with similar time structures shows that the PCC periodogram obtained from the analysis of the measured light curve is consistent with expectations from statistical fluctuations.
The large gamma-ray data set, spanning almost 15 yr of gamma-ray observations (Figure 2, bottom), allows the orbital period of this system to be determined from gamma-ray data alone for the first time. The approach of the analysis is equivalent to that of the X-ray analysis discussed above (PCC method), resulting in an orbital period Pγ = 316.7 ± 4.4(stat) ± 2.5(sys) days, consistent with the value obtained at X-ray energies (see again Appendix A for details on the analysis). Given the known strong correlation of X-ray and VHE gamma-ray fluxes observed in the past (Aliu et al. 2014, see also Subsection 3.3), this result is not unexpected.
Table 3 summarizes the outcome of the different analyses of orbital period in comparison with results from the literature. For period-folding, the result from the PCC method was used in this paper. It was applied to the Swift-XRT data with the following values: MJD0 = 54,857 (arbitrarily set to the date of the first observations of the source with Swift) and period P = 317.3 ± 0.7(stat) ± 1.5(sys) days. It should be stressed that none of the conclusions on the physical properties of the binary system depend on this particular choice (see also Appendix B and Figures 13 and 14).
3.2. Phase-folded Light Curves
The light curves at X-ray and gamma-ray energies were both folded with the adopted orbital period of 317.3 days using ϕ = 0 as MJD=54,857.0, arbitrarily set to the date of the first Swift-XRT observations (Bongiorno et al. 2011). These folded light curves reveal several prominent features (see Figure 3): a maximum around phases 0.2–0.4, a minimum at phases 0.4–0.6, a second (lower) peak around phases 0.6–0.8, and a broader plateau around 0.8–0.2. HESS J0632 + 057 is now detected at energies >350 GeV with high statistical significance at all orbital phases with the exception of the region around the first minimum, at phases 0.4–0.6 (Table 4). According to the orbital solution of Casares et al. (2012), the periastron is located at phase ϕ = 0.967, coincident with the gamma- and X-ray flux plateau, while apastron takes place during the dip/minimum, at phase ϕ = 0.467. For the orbital solution proposed by Moritani et al. (2018), periastron takes place at ϕ = 0.663, during the second peak, while apastron happens at ϕ = 0.163 (see Figure 1 for a representation of the suggested solutions). The phase-folded parameters of the Hα measurement results are shown in Figure 4. No significant modulation is seen in EW, whereas the radial velocity and FWHM show small variations as a function of orbital phase. Note that Moritani et al. (2018) proposed an orbital solution using the radial velocity of Hα.

Figure 3. X-ray (0.3–10 keV; top) and gamma-ray (>350 GeV; bottom) light curves as a function of the orbital phase, assuming an orbital period of 317.3 days (MJD0 = 54,857.0; Bongiorno et al. 2011). Vertical error bars indicate statistical uncertainties; note that these are smaller than the marker size for all X-ray instruments except for Swift-XRT. Fluxes are averaged over time intervals indicated by the horizontal lines (for most flux points these are smaller than the marker size).
Download figure:
Standard image High-resolution image
Figure 4. Results from Hα measurements of MWC 148 vs. orbital phase, assuming an orbital period of 317.3 days. Different markers indicate individual orbits, as indicated by the intervals in MJD in the figure legend in the central panel. (a) Hα equivalent width (EW); (b) Hα radial velocity; (c) Hα FWHM. See Section 2.5 for definitions of EW and FWHM.
Download figure:
Standard image High-resolution imageTable 4. Summary of Observations and Spectral Analyses at Gamma-Ray Energies Averaged over Different Ranges in Orbital Phase Assuming an Orbital Period of 317.3 days
| Observatory | Exposure | Significance a | Flux Normalization | Photon Index | Cutoff | χ2/Nc |
|---|---|---|---|---|---|---|
| (hr) | (σ) | Constant at 0.5 TeV b | Energy | |||
| (pre-trial) | [cm−2 s−1 TeV−1] | [TeV] | ||||
| Orbital phase range 0.2–0.4 (high state) | ||||||
| VERITAS | 119.3 | 25.5 | (45.6 ± 2.4) × 10−13 | 2.67 ± 0.04 | ⋯ | 45.17/7 |
| VERITAS (epl) | (57.2 ± 4.2) × 10−13 | 1.79 ± 0.16 | 1.75 ± 0.38 | 4.5/6 | ||
| H.E.S.S. | 17.3 | 9.9 | (34.0 ± 4.4) × 10−13 | 2.45 ± 0.12 | ⋯ | 4.6/7 |
| MAGIC | 35.5 | 9.6 | (34.8 ± 4.6) × 10−13 | 2.48 ± 0.11 | ⋯ | 13.5/8 |
| Orbital phase range 0.4–0.6 (low state) | ||||||
| VERITAS | 40.0 | 2.4 | ⋯ | ⋯ | ⋯ | ⋯ |
| H.E.S.S. | 18.7 | 2.9 | ⋯ | ⋯ | ⋯ | ⋯ |
| MAGIC | 5.2 | 0.6 | ⋯ | ⋯ | ⋯ | ⋯ |
| Orbital phase range 0.6–0.8 (high state) | ||||||
| VERITAS | 28.4 | 11.0 | (31.6 ± 3.9) × 10−13 | 2.52 ± 0.14 | ⋯ | 3.3/6 |
| H.E.S.S. | 30.4 | 13.8 | (32.0 ± 3.5) × 10−13 | 2.34 ± 0.1 | ⋯ | 15.25/15 |
| MAGIC | — | ⋯ | ⋯ | ⋯ | ⋯ | ⋯ |
| Orbital phase range 0.8–0.2 | ||||||
| VERITAS | 72.7 | 8.9 | (20.8 ± 3.1) × 10−13 | 2.67 ± 0.17 | ⋯ | 3.2/4 |
| H.E.S.S. | 53.6 | 8.3 | (16.2 ± 2.6) × 10−13 | 2.55 ± 0.15 | ⋯ | 5.3/2 |
| MAGIC | 27.4 | 3.4 | ⋯ | ⋯ | ⋯ | ⋯ |
Notes. The table lists the results of the power-law fits ( ) to the differential energy spectra obtained separately for H.E.S.S., MAGIC, and VERITAS. For one measurement, the result of a fit using a power law with exponential cutoff (
 marked as epl) is listed. Errors are 1σ statistical errors only. The systematic errors are 11%–20% on the flux constant and 0.10–0.15 on the spectral index.
Download table as: ASCIITypeset image
HESS J0632 + 057 has been observed over 14 orbits at X-ray and 18 orbits at gamma-ray energies (see Appendix C and especially Figures 15 and 16). Despite more than 270 X-ray pointings and ∼450 hr of gamma-ray observations, these data cover most orbits relatively sparsely. Only five orbits (orbits 7–11 in Figure 15) have been regularly monitored at X-ray energies over more than 50% of an individual orbit. Ground-based gamma-ray instruments covered an even smaller range, as they cannot observe the binary for a large fraction of its orbit due to visibility constraints. Four orbits have been observed in the phase range 0.2–0.4 with notable coverage in X-ray and gamma-ray observations (Figure 9) and are discussed in more detail in Section 3.4.1.
3.3. Correlation Analysis
Correlations between X-ray and gamma-ray flux measurements are shown in Figure 5 (top). Gamma-ray observations are averaged over several nights in order to achieve sufficient statistical detection significance, while X-ray observations are nightly averages. Measurements are considered to be contemporaneous in this context for X-ray observations taking place during the time period of the grouped gamma-ray observations (the maximum interval length for the grouped gamma-ray observations is ∼10% of the orbital period). Average X-ray fluxes are used for periods of gamma-ray observations including several X-ray data points. It is worth stating that both the X-ray and gamma-ray fluxes are measured to be variable on timescales as short as hours, and the total X-ray exposure associated with each point is typically just a small fraction of the gamma-ray exposure. This might contribute to some of the scattering between fluxes in both energy bands as observed in Figure 5 (top). The DCF method (Edelson & Krolik 1988) is used to quantify the correlation and to search for possible time lags between X-ray and gamma-ray emission patterns. Figure 5 (bottom) shows the DCF using a binning of 5 days (different binnings have been tried with no significant changes in the results) and with confidence limits calculated using the toy Monte Carlo technique as recommended in Uttley et al. (2003). The correlation coefficient is 0.82 at time lag τ = 0 and the p-value for noncorrelation is 4 × 10⁻¹⁵, calculated from 59 flux pairs. The ratio of gamma-ray (>350 GeV) to X-ray flux (0.3–10 keV) is on average 2.9 ± 0.3, estimated from a linear fit as shown in Figure 5 (top) for the chosen integration ranges in energy. This underlines the equality or even dominance of the gamma-ray energy range for the emission of the binary system with respect to the X-ray regime (see also Figure 8). The fit also indicates a nonzero X-ray flux (F0.3−10 keV = (6.1 ± 1.5) × 10−13 erg cm−2 s−1) for a vanishing gamma-ray component, suggesting an X-ray source partially unrelated to the gamma-ray emission. No indication of a significant time lag between X-ray and gamma-ray emission is observed (see Figure 5, bottom), although this measurement is not sensitive to time lags τ ⪅ 10 days due to the required grouping of the gamma-ray observations. In general, this confirms the strong correlation between gamma-ray and X-ray emission, as already shown in Aliu et al. (2014). Ranked and unranked correlation analyses result in similar correlation coefficients between 0.75 and 0.82. This points toward a close-to-linear correlation, although statistical uncertainties of the photon fluxes observed in both energy bands prevent us from making any strong statements regarding possible nonlinearities between gamma-ray and X-ray emission.

Figure 5. Top: contemporaneous gamma-ray (>350 GeV) vs. X-ray (0.3–10 keV) integral fluxes. In total, 59 measurements were selected with X-ray measurements taking place during the period of gamma-ray observations. The dashed line and shaded area indicate the results of a linear fit to the data and the 1σ error range, respectively. Bottom: discrete cross-correlation function (DCF) between gamma-ray and X-ray data assuming a bin width for the time lag Δτ = 5 days. The dashed lines indicate the 2σ, 3σ, and 4σ confidence levels (from bottom to top) derived from 100,000 toy Monte Carlo light curves. Only correlation coefficients with time lags consistent with zero are significant.
Download figure:
Standard image High-resolution imageNo correlation is found between any parameters obtained from the optical Hα measurements and X-ray or gamma-ray fluxes (Figure 6). The Spearman correlation coefficients are between –0.4 and 0.33 for time lags τ = 0, corresponding to p-values for noncorrelation between 0.02 and 0.85 (calculated from 18 gamma-ray/Hα and 31 X-ray/Hα pairs). A relaxed definition for contemporaneous data is used for the Hα correlation analysis with a time span of ±5 days, well below the shortest timescales of ≈50 days observed for Hα profile variability (Moritani et al. 2015). This relaxation of the contemporaneity criteria is necessary to obtain a reasonable number of pairs of observations, but might obscure variability on shorter timescales. The low gamma-ray fluxes and large uncertainties might hide possible correlations. It should also be noted that the optical Hα data were obtained during five orbital periods (MJD 56,597–57,857; orbits 12–16 in Figures 15 and 16) with generally sparse coverage of X-ray and gamma-ray observations. This results in no contemporaneous observation pairs at TeV/Hα around orbital phases 0.3–0.6, which correspond to the first maximum and the dip in the folded light curve. In the case of the contemporaneous observation pairs at X-ray/Hα, there is no coverage at orbital phases 0.0–0.2 and 0.5–0.6. This imperfect coverage of orbital phases might also obscure possible correlations.
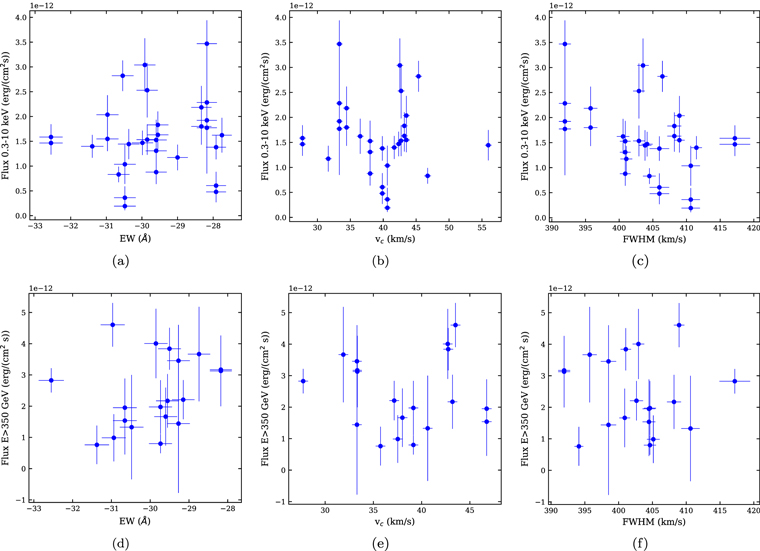
Figure 6. Hα measurements of MWC 148 vs. X-ray (top; panels (a)–(c)) and gamma-ray (bottom; panels (d)–(f)) measurements. In total 31 (19) measurements were selected with a maximal difference of observation dates of 5 days for the X-ray/Hα (gamma-ray/Hα) correlation analysis.
Download figure:
Standard image High-resolution image3.4. Flux States and Spectral Analysis
The data sets are divided into four different bins in orbital phase for the spectral analysis: the two higher flux states with orbital phases 0.2–0.4 and 0.6–0.8, the low state at orbital phases 0.4–0.6, and the medium (plateau) state for the remaining phases 0.8–0.2. This approach ignores the variability of the source on timescales shorter than these bins, as well as possible orbit-to-orbit variability, but allows a sufficient number of excess events to be collected for high-statistics spectra.
Results from the spectral analysis are summarized in Figure 7 and Table 4. The differential gamma-ray energy spectra in the four phase ranges are consistent within statistical uncertainties with simple power laws  with the exception of the long-exposure data set obtained with VERITAS for phase bin 0.2–0.4. Here, a spectral fit assuming a power law with exponential cutoff (
 ) with Ec
= 1.75 ± 0.38 TeV provides a significantly better reduced χ2 than a power-law fit without cutoff. Shorter exposure times at other phase bins of H.E.S.S. and MAGIC observations prevent us from measuring or refuting similar changes in the spectral shapes with those data sets. All measurements of the differential energy spectra by H.E.S.S., MAGIC, and VERITAS are compatible, within statistical and systematic uncertainties. No variability of the spectral index Γ is observed among spectra in different orbital phase bins, considering the statistical uncertainties. The spectral energy distributions for the four different phase bins are shown in Figure 8, including the X-ray spectra, which have been obtained in the same way by averaging over the phase bins discussed above. HESS J0632 + 057 is only weakly detected in the energy range covered by the Fermi-LAT, therefore only a phase-averaged spectrum is shown, taken from Li et al. (2017).
) with Ec
= 1.75 ± 0.38 TeV provides a significantly better reduced χ2 than a power-law fit without cutoff. Shorter exposure times at other phase bins of H.E.S.S. and MAGIC observations prevent us from measuring or refuting similar changes in the spectral shapes with those data sets. All measurements of the differential energy spectra by H.E.S.S., MAGIC, and VERITAS are compatible, within statistical and systematic uncertainties. No variability of the spectral index Γ is observed among spectra in different orbital phase bins, considering the statistical uncertainties. The spectral energy distributions for the four different phase bins are shown in Figure 8, including the X-ray spectra, which have been obtained in the same way by averaging over the phase bins discussed above. HESS J0632 + 057 is only weakly detected in the energy range covered by the Fermi-LAT, therefore only a phase-averaged spectrum is shown, taken from Li et al. (2017).
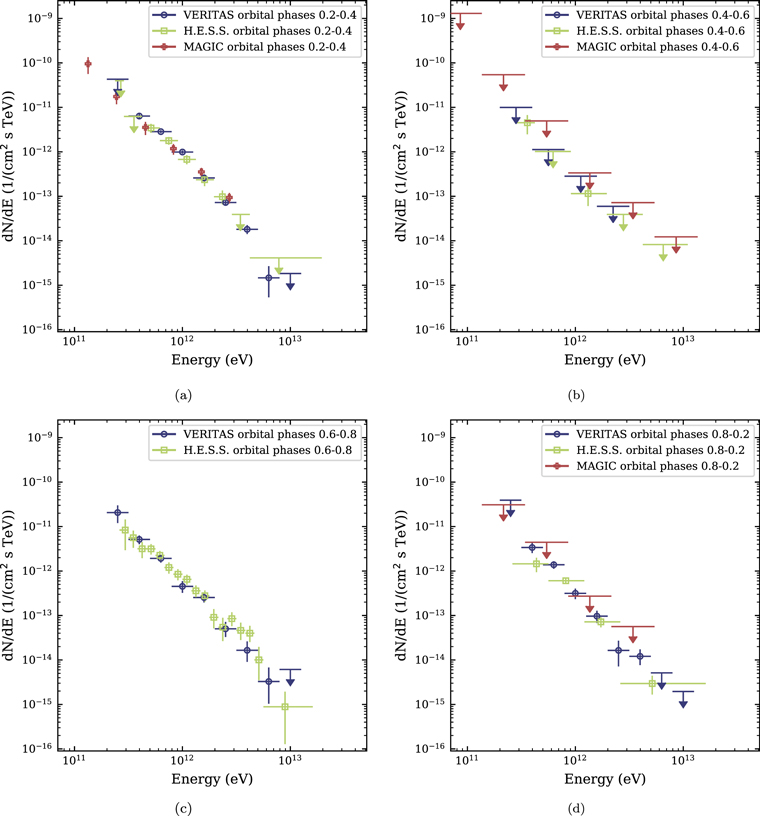
Figure 7. Differential energy spectra of photons above 200 GeV obtained by H.E.S.S., MAGIC, and VERITAS averaged over all available orbits. The figure shows the results for four different orbital phase bins: (a) orbital phases 0.2–0.4; (b) orbital phases 0.4–0.6; (c) orbital phases 0.6–0.8; (d) orbital phases 0.8–0.2. Vertical error bars show 1σ uncertainties; downward pointing arrows indicate upper limits at the 95% confidence level.
Download figure:
Standard image High-resolution image
Figure 8. Spectral energy distribution for HESS J0632 + 057 averaged over all available orbits. The figure shows the result for four different phase bins: (a) orbital phases 0.2–0.4; (b) orbital phases 0.4–0.6; (c) orbital phases 0.6–0.8; (d) orbital phases 0.8–0.2. Downward pointing arrows indicate upper limits at the 95% confidence level. Gray points show the phase-averaged spectrum measured by the Fermi-LAT (Li et al. 2017).
Download figure:
Standard image High-resolution image3.4.1. Detailed Examination of Orbits 9, 10, 16, and 17
Four orbits in the data sets presented provide reasonably good X-ray and gamma-ray coverage around orbital phase values of 0.2–0.45, which includes the first maximum and subsequent flux decay. Figure 9 shows the light curves for the four orbits with gamma-ray and X-ray coverage: 9, 10, 16, and 17. The shapes of the light curves of these four orbits differ notably and suggest the existence of orbit-to-orbit variability. The short-timescale variability on timescales of 20 days and less has been seen at X-ray energies (see also Figure 2). The observed differences in fluxes between orbits might be a biased view due to observations taking place at slightly different orbital phases. Observations during orbits 9 (2011 Jan) and 17 (2018 Jan) reveal gamma-ray and X-ray emission in bright states, comparable to the highest ever observed from this binary. The X-ray flux in orbits 10 and 16 is a factor of ∼1.5 lower than in orbits 9 and 17 at orbital phases of 0.35. The maximum gamma-ray flux also appears to be lower, although the low cadence of observations in this energy range does not allow a firm statement to be made.
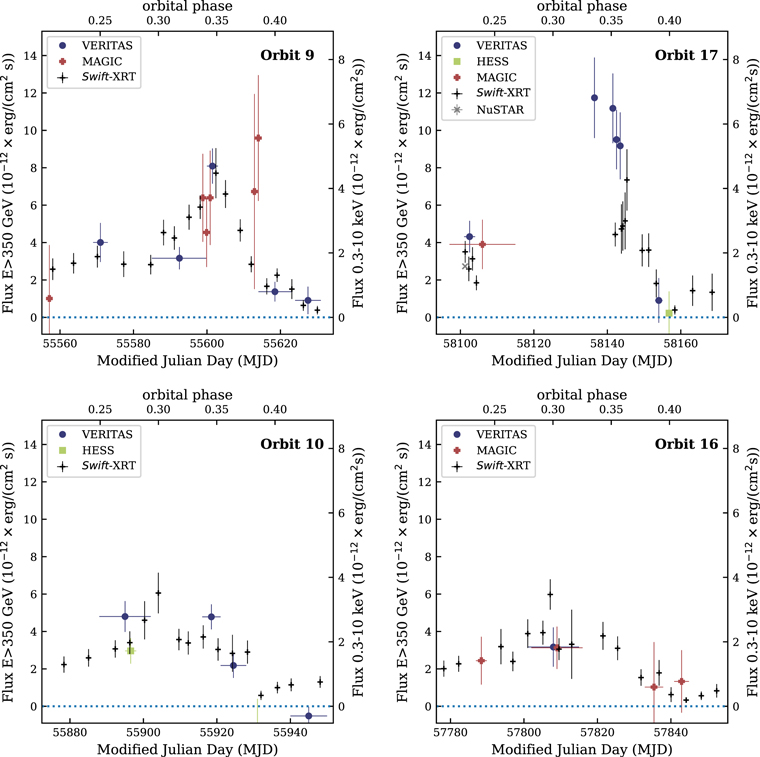
Figure 9. Detailed light curves for four orbits with deep X-ray and gamma-ray coverage in gamma-rays (H.E.S.S., MAGIC, VERITAS, >350 GeV; left axis) and X-rays (NuSTAR, Swift-XRT, 0.3–10 keV; right axis). Orbits are numbered following the start of the gamma-ray observations (phase zero of orbit 1 is at MJD 52,953). The orbits 9 and 17 (upper two panels) represent high states of the source while the orbits 10 and 16 (lower two panels) represent low states. Vertical lines indicate statistical uncertainties. Fluxes are averaged over time intervals indicated by the horizontal lines (for most flux points smaller than the marker size). An orbital period of 317.3 days is assumed.
Download figure:
Standard image High-resolution imageThe bright state in orbit 9 has been reported in previous work by the MAGIC and VERITAS collaborations (Aleksić et al. 2012; Aliu et al. 2014). The gamma-ray flux for orbit 17 reached a level of (7.0 ± 1.3) × 10−12 photons cm−2 s−1 above 350 GeV (corresponding to ≈7% of the flux of the Crab Nebula above the same energy). In this same orbit, HESS J0632 + 057 was detected on three individual nights within one week of observations with >7σ statistical significance per night (see Table 5).
Table 5. Summary of Observations and Spectral Analyses at Gamma-Ray Energies for Orbits 9 and 17
| MJD Range | Exposure | Significance a | Flux Normalization | Photon Index | χ2/N |
|---|---|---|---|---|---|
| (hr) | (σ) | Constant at 0.5 TeV | |||
| (pre-trial) | [cm−2 s−1 TeV−1] | ||||
| VERITAS observations of orbit 9 (2011 Jan) | |||||
| 55,585–55,600 | 11.3 | 6.1 | (3.8 ± 0.9) × 10−12 | 2.71 ± 0.30 | 2.7/3 |
| 55,600–55,603 | 8.7 | 11.6 | (8.3 ± 1.2) × 10−12 | 2.69 ± 0.17 | 4.5/4 |
| MAGIC observations of orbit 9 (2011 Jan) | |||||
| 55,585–55,600 | 4.5 | 5.9 | (4.9 ± 0.9) × 10−12 | 2.48 ± 0.20 | 4.2/3 |
| VERITAS observations of orbit 17 (2018 Jan) | |||||
| 58,136 | 1.8 | 7.5 | (11.9 ± 2.6) × 10−12 | 2.22 ± 0.24 | 3.3/4 |
| 58,141 | 2.5 | 7.7 | (9.2 ± 2.2) × 10−12 | 2.20 ± 0.24 | 2.0/4 |
| 58,142 | 3.6 | 7.8 | (11.6 ± 2.4) × 10−12 | 2.56 ± 0.28 | 1.5/3 |
| 58,143 | 3.1 | 5.8 | (7.3 ± 2.0) × 10−12 | 2.15 ± 0.22 | 3.2/2 |
Note. The table lists the results of the power-law fits to the differential energy spectra obtained for VERITAS and MAGIC. Errors are 1σ statistical errors only. The systematic errors are 11%–20% on the flux constant and 0.10–0.15 on the spectral index.
a Significances are calculated following the maximum likelihood ratio test method proposed in Li & Ma (1983).Download table as: ASCIITypeset image
The determination of variability timescales is limited by the cadence of the observations. For orbit 17, the flux changes from the highest state on MJD 58,136 to a flux below the detection limit on MJD 58,153 (flux upper limit for MJD 58,153: F99%CL(>350 GeV) < 2.6 × 10⁻¹² photons cm−2 s−1), indicating a flux decay time shorter than 17 days. A similar timescale of roughly 20 days or less, again limited by the cadence and detection statistics of the observations, is observed for orbit 9.
The spectral energy distributions for orbits 9 and 17 are shown in Figure 10 and results for spectral fits to the gamma-ray data, assuming power-law functions, are given in Table 5. Despite the dramatic changes of the overall flux levels, no evidence for variability of the spectral index is detected, within statistical errors, for all six periods of gamma-ray observations.
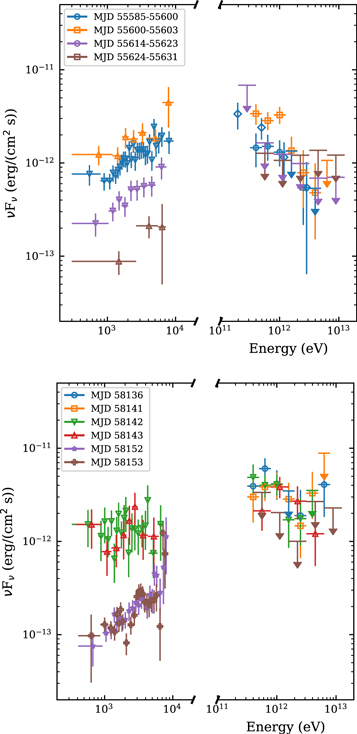
Figure 10. Spectral energy distribution for HESS J0632 + 057 during two orbital period ranges (orbit 9: top panel; orbit 17: bottom panel) with deep coverage in X-ray (Swift-XRT) and gamma-ray observations. Gamma-ray spectra obtained by VERITAS are shown in all figures. Orbit 9 also shows results from MAGIC (Aleksić et al. 2012), indicated by diamond-shaped markers. Downward pointing arrows indicate upper limits at the 95% confidence level.
Download figure:
Standard image High-resolution image4. Discussion
4.1. VHE Results and Acceleration Mechanisms
HESS J0632 + 057 has been observed at VHE with irregular coverage across 18 orbits, spanning an observational period from 2004 to 2019. These observations result in a statistically significant detection of nonthermal emission at all orbital phases, except phases 0.4–0.6. The phase-averaged luminosity of HESS J0632 + 057 above 1 TeV is ≈1032 erg s−1 (assuming a distance of 1.4 kpc), making it one of the faintest gamma-ray binaries known to date (see Dubus 2013). The VHE gamma-ray emission extends beyond several TeV (see Figure 7), indicating the existence of radiating particles with at least similar energies. The energy range for the detected emission and the spectral shapes of individual spectra are, within statistical uncertainties, independent of the orbital phase of the measurement. The spectra follow approximately power-law shapes with spectral indices in the range 2.3–2.6 (Table 4), in line with generic expectations from diffusive shock acceleration.
In general, and independent of the nature of the compact object (black hole or neutron star), the VHE emission can be produced through interactions of accelerated hadrons or leptons with surrounding matter, magnetic, or radiation fields. The literature (e.g., Khangulyan et al. 2007) provides detailed discussions of mechanisms for acceleration and losses (e.g., synchrotron radiation, anisotropic inverse Compton scattering, or adiabatic losses) as functions of density and magnetic field strengths in binary systems. The discussion of the nonthermal processes at work in HESS J0632 + 057, including particle acceleration and X- and gamma-ray emission and absorption processes, is limited by the uncertainties present in some of the fundamental characteristics of the system. In particular, the unknown nature of the compact object allows different scenarios for the required power source for particle acceleration to be considered (e.g., the interaction of the stellar wind with an accretion-driven relativistic jet or with a pulsar wind). Equally important are the difficulties in determining the orbital geometry, given that two discrepant solutions with large uncertainties are found in the literature (Figure 1). Further uncertainties include the size and orientation of the equatorial disk of the Be star, the mass-loss rates and velocities of both equatorial and isotropic stellar winds, the properties of the accreting object (in the case of a black hole) or the pulsar wind (in the case of a neutron star), and the magnetic field configuration in the acceleration region.
4.2. Flux Variability Studies
The 15 yr of H.E.S.S., MAGIC, and VERITAS observations of HESS J0632 + 057, combined with measurements at optical and X-ray energies, suggest multiple patterns of variability on different timescales in the binary system. The most prominent modulation, interpreted as the orbital period, is consistently seen, within statistical uncertainties, in X-ray and gamma-ray measurements (PX =317.3 ± 0.7(stat) ± 1.5(sys); Pγ = 316.7 ± 4.4(stat) ± 2.5(sys), see Section 3.1). In both bands, the orbital-phase-folded light curves (Figure 3) show two maxima at phases Φ ≈ 0.3 and Φ ≈ 0.6–0.8, separated by a deep flux minimum at orbital phase Φ ≈ 0.4. In the VHE band, the first maximum is more pronounced and exhibits, at least for some orbits, a sharp peak with a duration of a few days. The locations of the extrema in the X-ray and gamma-ray light curves along the binary orbit are not known, due to the large uncertainties in the orbital solutions, as discussed above. Assuming orbital parameters as presented in Casares et al. (2012) (Figure 1, top), the first maximum and the second maximum occur before and after apastron, where the environment around the compact object could likely be the least disturbed by the winds of the massive star. For the orbital solution proposed by Moritani et al. (2018), instead, the first maximum is after apastron and the second maximum shortly after periastron. A direct comparison with other gamma-ray binaries is affected by these uncertainties. However, it is worth pointing out that the two other long-period systems known (PSR B1259-63/LS 2883 and PSR J2032 + 4127/MT91 213) show their emission maxima close to or around the periastron passages.
The analysis of a total of 59 X-ray–VHE flux pairs reveals a strong correlation between these two energy bands (Figure 5, top). No time lag is observed (Figure 5, bottom), although the grouping of the gamma-ray observations (to gain statistics) prevents us from probing time lags τ ≤ 10 days. The X-ray–VHE correlation suggests that emission in both bands is produced by the same population of accelerated particles. One-zone leptonic models can describe the X-ray to TeV spectral distribution and the correlation between these two energy bands in HESS J0632 + 057, as seen in Hinton et al. (2009), Aleksić et al. (2012), and Aliu et al. (2014). In this scenario, a population of electrons produces X-rays via synchrotron emission and VHE gamma-rays through inverse Compton scattering off thermal photons from the companion Be star. It has been shown in Archer et al. (2020) that a one-zone leptonic model can describe well a small set of contemporaneous SED data in hard X-rays and VHE gamma-rays observed with NuSTAR and with VERITAS, respectively.
One of the main difficulties in modeling HESS J0632 +057's SED data lies in accounting for the observed orbit-to-orbit variability. Detailed hydrodynamical simulations of HESS J0632 + 057 by Bosch-Ramon et al. (2017) and Barkov & Bosch-Ramon (2018) propose a trapping of parts of the shocked pulsar wind by the massive star as a cause of orbit-to-orbit variability. These authors suggest that the peaks of the X-ray and VHE gamma-ray emission are a consequence of the accumulation of the hot shocked plasma injected by the shocked pulsar wind and the consequent disruption of the spiral arm in the periastron–apastron direction. It is proposed that the observed drop in the X-ray and gamma-ray fluxes is caused by the disruption of the stellar wind by the pulsar wind. In the simpler model of of Archer et al. (2020), this variability is assumed to be due to fluctuations of the electron density in the emission zone, which is treated as a free parameter of the fit. This kind of approach can only be applied to contemporaneous X-ray and VHE gamma-ray observations and it is only possible because of the large overlap between the electron energies responsible for the X-rays and VHE gamma-rays in this leptonic scenario.
For the first time, contemporaneous X-ray and gamma-ray observations have been presented for orbital phases 0.2–0.45 (around first maximum and minimum) for four different orbits (Figures 9 and 10). The measurements suggest that flux levels are different between these periods, indicating the existence of orbit-to-orbit variability in the emission pattern. No evidence for a superorbital period, as observed, e.g., in the gamma-ray binary LS I +61° 303 (Ahnen et al. 2016), is found. On shorter integration times, strong variability of the VHE flux on timescales of a few days was seen during observations in 2011 (orbit 9) and 2018 (orbit 17) at orbital phase ∼0.35 (prior to the local flux minimum; see Figure 9). Similar day-scale variability has been detected during VERITAS observations of the apastron passage of the compact object in the LS I +61° 303 binary system (Archambault et al. 2016).
In the GeV band, the weak flux of HESS J0632 + 057 hinders the detection of orbital variability with the Fermi-LAT (Li et al. 2017). No variability pattern is seen in Hα equivalent width, whereas the radial velocity and the Hα FWHM increase in the orbital phase range 0.3–0.6 and decrease between 0.7 and 0.3. The data demonstrate (with low statistical significance) a somewhat higher scatter at ϕ > 0.5, which may indicate a perturbed state of the stellar disk at these orbital phases. The correlation coefficients obtained for the different Hα parameters (EW, FWHM, and centroid velocity) and X-ray or VHE emission do not show significant values for the observed time lags (Figure 6). Optical spectroscopic measurements of MWC 148 during and after the time of the high state around 2018 January 25 with the RCC telescope at Rozhen NAO, Bulgaria, indicate changes in the structure or size of the equatorial disk of the Be star (Stoyanov et al. 2018), although comparable measurements have been carried out only during different orbital phases (2018 January 25: phase 0.36 and 2014 January 23: phase 0.71). Measurements of equivalent width by the Southern African Large Telescope (SALT Transient Program, L. Townsend 2020 personal communication) confirm this: pointings with a measured ∣EW∣ of >40 Å in 2018 February indicate a larger circumstellar disk than at the same phase in earlier cycles (e.g., ∣EW∣ of 2017 March 28 was ≈30 Å; see also measurements by Casares et al. 2012; Moritani et al. 2015).
4.3. Comparison with Other Binaries and Model Descriptions
Similarities of the emission pattern observed for HESS J0632 + 057 with those of other gamma-ray binaries are notable. Similar correlations between X-rays and VHE emission have been found during an outburst of LS I +61° 303 (Anderhub et al. 2009), but not consistently across different orbits (Acciari et al. 2011). However, many short-period systems like LS I +61° 303 are characterized by single-maximum light curves (Dubus 2013), while long-period gamma-ray binaries (e.g., PSR B1259-63/LS 2883, PSR J2032 + 4127/MT91 213) show a similar double-peaked structure in X- and gamma-ray emission (see, e.g., Dubus 2013; Abeysekara et al. 2018; H.E.S.S. Collaboration et al. 2020) as observed in HESS J0632 + 057. Moritani et al. (2018) and Malyshev et al. (2019) compare the emission patterns of HESS J0632 + 057 with those of PSR B1259-63/LS 2883 and relate the double-peak structure of the orbital-phase-folded light curves in the keV–VHE bands in both systems to the inclined disk geometry and the change in environmental parameters during the first and second crossings of the circumstellar disk by the compact object. The higher ambient density and increased magnetic field strengths in the stellar equatorial wind zone lead to enhanced particle acceleration via wind–wind interaction and possibly increased radiation efficiency due to an increased energy loss timescale for the electron population. Close to periastron, when the compact object leaves the disk, acceleration and radiation efficiency decrease, leading to the dip in the keV and VHE light curves. An & Romani (2017) obtain a quantitative description of the orbital variability pattern in X-rays of the binary 1FGL J1018.6-5856, which shows a similar double-peaked structure to that observed in HESS J0632 + 057. The model used a simple leptonic model based on intrabinary shock emission as discussed in the previous section, but with the following modifications: two electron populations are assumed, where one moves slowly in the shock and the other is accelerated along the shock flow; beaming effects, as proposed by Dubus et al. (2010), are added to the accelerated component in the cone-shaped shock front. Applying this model to HESS J0632 + 057, these components would lead to the enhanced flux state around orbital phases of 0.7–0.9 (when the flow direction and the line of sight align). The stellar disk of the Be star in HESS J0632 + 057 is the main difference compared to the diskless O-star in 1FGL J1018.6-5856 and might lead to enhanced absorption of the X-ray and gamma-ray emission. Additional changes in the magnetic fields at the intrabinary shock position due to the eccentric orbit and the resulting change in acceleration efficiency might be important to provide favourable conditions for the high emission state around phases 0.3–0.4 (Tokayer et al. 2021).
An alternative scenario to explain the variability pattern of HESS J0632 + 057 could be provided by flip-flop models. Torres et al. (2012) and Papitto et al. (2012) proposed this scenario to explain the emission from LS I +61° 303. In this scenario, the compact object is a pulsar. Different authors support the pulsar nature of the compact object in HESS J0632 + 057 (see Mochol & Kirk 2014; Moritani et al. 2015), as might be the case for the binaries LS I +61° 303 and LS 5039 (Yoneda et al. 2020), or as in the confirmed pulsar binaries PSR B1259-63/LS 2883 (Johnston et al. 1992; Kirk et al. 1999) and PSR J2032 + 4127/MT91 213 (Abdo et al. 2009; Camilo et al. 2009). In the model proposed by Torres et al. (2012) for LS I +61° 303, the pulsar switches from a propeller regime at periastron to an ejector regime at apastron, which is triggered by changes in the mass-loss rate of the companion star. Hence, for periods when the disk is at its largest, the propeller regime could be active also at apastron, reducing or impeding VHE emission and explaining the long-term variability in the binary. It should be noted that a recent Astronomer's Telegram (Weng et al. 2021) reported on the detection of a periodicity from LS I +61° 303 at a period 269.196 ms. This period is almost exactly that marked as the preferred one for the flip-flop model to work (see Figure 4 of Papitto et al. 2012). In this model, optical and VHE emissions are predicted to be anticorrelated. Moritani et al. (2015) argued that a similar mechanism could work in HESS J0632 + 057, although the orbital phases in which the gamma-ray emission occurs are different due to the geometry of the system. In the case of HESS J0632 + 057, the strong gas pressure will overcome the pulsar-wind pressure at periastron, suppressing VHE emission (assuming the ephemerides of Casares et al. 2012). The second minimum will take place at apastron, where the photon field and magnetic field density are low. In the case of LS I +61° 303, Ahnen et al. (2016) found the VHE periodicity as predicted, but no hints for (anti)correlation between optical and VHE were observed. The latter could be the result of the strong, short-timescale intraday variation displayed by the Hα fluxes. In HESS J0632 + 057, a similar situation can be at work, since both the contemporaneity of the observations (5 day time span) and the integration times are large, even more than for the case of LS I +61° 303, and were already problematic. The lack of (anti)correlation between optical and high-energy emission (X- and gamma-rays) observed in HESS J0632 + 057 can also be explained by the difference in the integration times required at these frequencies, which is in agreement with the results found by Ahnen et al. (2016) for the case of LS I +61° 303.
Regardless of the assumed model and the nature of the compact object, two additional processes can affect the orbital modulation of VHE emission, namely gamma–gamma absorption processes and the anisotropic nature of inverse Compton radiation. Close to periastron, the increased soft photon density can produce severe gamma–gamma absorption losses, which are potentially able to explain dips in the light curves of several gamma-ray binary systems (see, e.g., Böttcher & Dermer 2005; Dermer & Böttcher 2006; Sushch & van Soelen 2017). Anisotropic inverse Compton effects are important for orientations close to edge-on, as suggested by Bednarek (2006). In the context of LS 5039, Khangulyan et al. (2008) and Dubus et al. (2008) have shown that a model taking into account both effects can reproduce well the observed orbital light curve, producing somewhat different results to the spectrum in the isotropic inverse Compton case at inferior and superior conjunctions. The observed cutoff in the energy spectrum for the orbital phase bin 0.2–0.4 at Ec = 1.75 ± 0.38 TeV can have multiple, possibly correlated, origins: limiting properties of the shock determining the acceleration efficiency and the maximum energy of accelerated particles; photon fields determining the absorption of multi-TeV gamma-rays; or the effective temperature distribution of the low-energy target photons (e.g., due to substantial contribution from the stellar disk), which impact the energy of the gamma-rays obtained from inverse Compton processes.
An additional channel of information that can allow the proposed models to be discriminated against each other is the observation of flux variability patterns and outbursts at shorter timescales than the orbital period, as shown in Figure 9. Such variability suggests a rapid change in the environmental properties leading to particle acceleration, or in the surrounding medium impacting the VHE emission, possibly because of a peculiar geometry in the system (e.g., beaming, as proposed for PSR B1259-63/LS 2883 in, e.g., Khangulyan et al. 2011; Chernyakova et al. 2020). In terms of the discussed models, however, short-term variability can be accommodated by several theoretical explanations. In the flip-flop scenario these timescales could be interpreted as the timescales on which the pulsar wind is quenched due to increased circumstellar disk density. In the PSR B1259-63/LS 2883-like model, the same timescales would correspond to the times at which the compact object intersects the disk's region of influence and exits from it close to periastron. Additionally, stellar winds of massive stars can exhibit strong density variations. Flux variability can be connected to the clumpiness of the equatorial or isotropic stellar wind, which can lead to keV–VHE flux changes; see, e.g., Paredes-Fortuny et al. (2015a) and Archambault et al. (2016). In this case the variability time can allow us to estimate the characteristic size of the corresponding high-density structure. Deeper, simultaneous multiwavelength (keV–GeV–VHE) observations of HESS J0632 + 057 with current or future facilities can help to clarify these points. Such observations may allow one to find the shortest timescales of variability in each band and more firmly establish the similarities and differences in the variability patterns. Additional future Hα observations used as a tracer for the radius of the circumstellar disk are also helpful, since the data set shown in this paper is rather sparse.
5. Summary and Conclusions
The results of the deepest study of the gamma-ray binary HESS J0632 + 057 at TeV energies with H.E.S.S., MAGIC, and VERITAS, comprising a total of 450 hr of data spanning almost 15 yr, are presented. This multiyear campaign is embedded in a multiwavelength context, which includes X-ray (Swift-XRT, Chandra, XMM-Newton, NuStar, and Suzaku) and optical Hα observations. The results of the spectral and temporal analyses are summarized as follows.
- 1.For the first time, the orbital period at TeV energies was determined, yielding a value of 316.7 ± 4.4 days. This solution is in agreement with the 317.3 ± 0.7 day period derived from the latest Swift-XRT X-ray data set.
- 2.The light curve and spectral energy distribution along the orbit were characterized. In the phase-folded light curve, two well-differentiated peaks are visible, together with a dip phase and a broader plateau phase. The VHE SEDs for all of these phases (except the dip phase, where only upper limits could be derived) are generally characterized as power laws, showing no variability in the spectral slope within statistical errors. Only the spectrum measured with VERITAS during the phases 0.2–0.4 favors a power law with exponential cutoff at 1.75 TeV.
- 3.The strong correlation between X-rays and gamma-rays suggests a common origin of the radiation, indicating the existence of a single population of particles. An indication for an X-ray source partially unrelated to the gamma-ray emission was found, however.
- 4.The lack of correlation between Hα and X-rays or gamma-rays might point toward a negligible role for the disk of the Be star in the modulation of the nonthermal emission, but is possibly an effect of the fast variability of Hα compared with the sparse overlap of the data sets at different energies. If the Hα spectra change on a timescale of days, much shorter than the grouped gamma-ray timescales, one cannot measure a possible correlation with the sensitivity of current VHE/TeV instruments.
- 5.The ratio of gamma-ray to X-ray flux underlines the equality or even dominance of the gamma-ray energy range for the emission of HESS J0632 + 057.
- 6.Two outbursts during orbits 9 (2011 January) and 17 (2018 January) revealed enhanced gamma-ray and X-ray emission comparable to the highest flux ever observed from this binary. Furthermore, a flux decay time of roughly 20 days or less was detected for two orbits. Contemporaneous Hα data taken on 2018 January 25 indicate that the size of the circumstellar disk had increased during those days, suggesting that the decretion disk was larger and its structure had changed.
Looking forward, it is obvious that deeper, simultaneous multiwavelength (Hα and keV–GeV–TeV) observations of HESS J0632 + 057 with current and/or future more-sensitive instruments are required to characterize its emission. The determination of the orbital geometry of the system is of utmost importance and requires a coordinated multiyear optical campaign. Finally, the wealth of data presented for HESS J0632 + 057 awaits theoretical modeling taking consistently all aspects of the spectral and temporal measurements into account.
The support of the Namibian authorities and of the University of Namibia in facilitating the construction and operation of H.E.S.S. is gratefully acknowledged, as is the support by the German Ministry for Education and Research (BMBF), the Max Planck Society, the German Research Foundation (DFG), the Helmholtz Association, the Alexander von Humboldt Foundation, the French Ministry of Higher Education, Research and Innovation, the Centre National de la Recherche Scientifique (CNRS/IN2P3 and CNRS/INSU), the Commissariat à l'énergie atomique et aux énergies alternatives (CEA), the U.K. Science and Technology Facilities Council (STFC), the Knut and Alice Wallenberg Foundation, the National Science Centre, Poland grant no. 2016/22/M/ST9/00382, the South African Department of Science and Technology and National Research Foundation, the University of Namibia, the National Commission on Research, Science & Technology of Namibia (NCRST), the Austrian Federal Ministry of Education, Science and Research and the Austrian Science Fund (FWF), the Australian Research Council (ARC), the Japan Society for the Promotion of Science, and the University of Amsterdam. We appreciate the excellent work of the technical support staff in Berlin, Zeuthen, Heidelberg, Palaiseau, Paris, Saclay, Tübingen, and Namibia in the construction and operation of the equipment. This work benefited from services provided by the H.E.S.S. Virtual Organisation, supported by the national resource providers of the EGI Federation.
The MAGIC collaboration would like to thank the Instituto de Astrofísica de Canarias for the excellent working conditions at the Observatorio del Roque de los Muchachos in La Palma. The financial support of the German BMBF, MPG and HGF; the Italian INFN and INAF; the Swiss National Fund SNF; the ERDF under the Spanish Ministerio de Ciencia e Innovación (MICINN) (PID2019-104114RB-C31, PID2019-104114RB-C32, PID2019-104114RB-C33, PID2019-105510GB-C31,PID2019-107847RB-C41, PID2019-107847RB-C42, PID2019-107988GB-C22); the Indian Department of Atomic Energy; the Japanese ICRR, the University of Tokyo, JSPS, and MEXT; the Bulgarian Ministry of Education and Science, National RI Roadmap Project DO1-268/16.12.2019 and the Academy of Finland grant nr. 320045 is gratefully acknowledged. This work was also supported by the Spanish Centro de Excelencia "Severo Ochoa" (SEV-2016-0588, CEX2019-000920-S), the Unidad de Excelencia "María de Maeztu" (CEX2019-000918-M, MDM-2015-0509-18-2), and the CERCA program of the Generalitat de Catalunya; by the Croatian Science Foundation (HrZZ) Project IP-2016-06-9782 and the University of Rijeka Project 13.12.1.3.02; by the DFG Collaborative Research Centers SFB823/C4 and SFB876/C3; the Polish National Research Centre grant UMO-2016/22/M/ST9/00382; and by the Brazilian MCTIC, CNPq and FAPERJ.
VERITAS is supported by grants from the U.S. Department of Energy Office of Science, the U.S. National Science Foundation and the Smithsonian Institution, by NSERC in Canada, and by the Helmholtz Association in Germany. We acknowledge the excellent work of the technical support staff at the Fred Lawrence Whipple Observatory and at the collaborating institutions in the construction and operation of the instrument. This research used resources provided by the Open Science Grid, which is supported by the National Science Foundation and the U.S. Department of Energy's Office of Science, and resources of the National Energy Research Scientific Computing Center (NERSC), a U.S. Department of Energy Office of Science User Facility operated under Contract No. DE-AC02-05CH11231.
D.F.T. acknowledges support by grants PGC2018-095512-B-I00, SGR2017-1383, and AYA2017-92402-EXP.
This research has made use of data obtained from the Chandra Data Archive and the Chandra Source Catalog; it has made use of data obtained from the Suzaku satellite, a collaborative mission between the space agencies of Japan (JAXA) and the USA (NASA); it is based on observations obtained with XMM-Newton, an ESA science mission with instruments and contributions directly funded by ESA Member States and NASA; it made use of data from the NuSTAR mission, a project led by the California Institute of Technology, managed by the Jet Propulsion Laboratory, and funded by the NASA.
Facilities: Swift - Swift Gamma-Ray Burst Mission, XMM-Newton - , CXO - , Suzaku - , NuSTAR - , MAGIC - , H.E.S.S. - , VERITAS - , CFHT - , OAO:1.88m - .
Software: Astropy (version 3.01, Astropy Collaboration et al. 2013, 2018), CIAO (v.4.9, Fruscione et al. 2006) Eventdisplay (v4.83, Maier & Holder 2017), HEAsoft (v6.22, HEASARC 2014), IRAF (Tody 1986), PyAstronomy (version 0.13, Czesla et al. 2019), xrtpipeline (v.0.13.4), XSPEC (v12.9.1 m, Arnaud 1996).
Availability of Data
The data sets generated and analyzed during the current study are available through the websites of the HESS J0632 + 057 121 , MAGIC 122 , and VERITAS 123 Instruments and from the Zenodo data repository at https://doi.org/10.5281/zenodo.5157848.
Appendix A: Determination of Orbital Period
Literature provides a variety of methods for periodicity analysis of sparse astronomical data (e.g., Graham et al. 2013). The performance of the different techniques depends on quality, coverage, and shape of the given light curves. There is no clear guidance which technique is best for a given data set. For these reasons, the following methods are evaluated using Monte Carlo-generated light curves: discrete correlation functions (DCF, Edelson & Krolik 1988; Robertson et al. 2015), 124 correlation analysis comparing the light curves with a binned-average light curve (PCC, Malyshev et al. 2019), Lomb–Scargle periodograms (Lomb 1976; Scargle 1982), 125 and the phase dispersion minimization method (PDM, Stellingwerf 1978). 126
The Monte Carlo-generated light curves are based on the phase-binned average profiles of the observed fluxes in X- or gamma-rays and are generated assuming the same distribution in time as the measurements, with flux values randomly altered according to the corresponding uncertainties. As the phase-binned averaged profile removes variability that is not due to statistical uncertainties of the measurement, additional power-law noise following a  spectrum is added (Timmer & Koenig 1995).
Figure 11 shows the results of the different techniques applied to 1000 Monte Carlo-generated light curves based on the Swift-XRT and gamma-ray data sets assuming a true orbital period of 321 days. The search region is restricted to a ±30 day interval around the true orbital period. This prior is necessary, because the PDM method tends toward reconstructing from a significant fraction (>20%) of light curves an orbital period that is roughly half the true orbital period. Applying the method of Lomb and Scargle to the generated light curves leads to inconsistent results, because the largest peak in the periodograms for most light curves is at half the true period. This result is also obtained when applying this method to the Swift-XRT data. Folding the light curve with such short periods leads to inconsistent solutions, because both the PDM and Lomb–Scargle methods ignore its nonsinusoidal shape and in particular the very low fluxes or nondetections of the system visible at orbital phases of ≈0.4 (assuming an orbital period of 317.3 days).
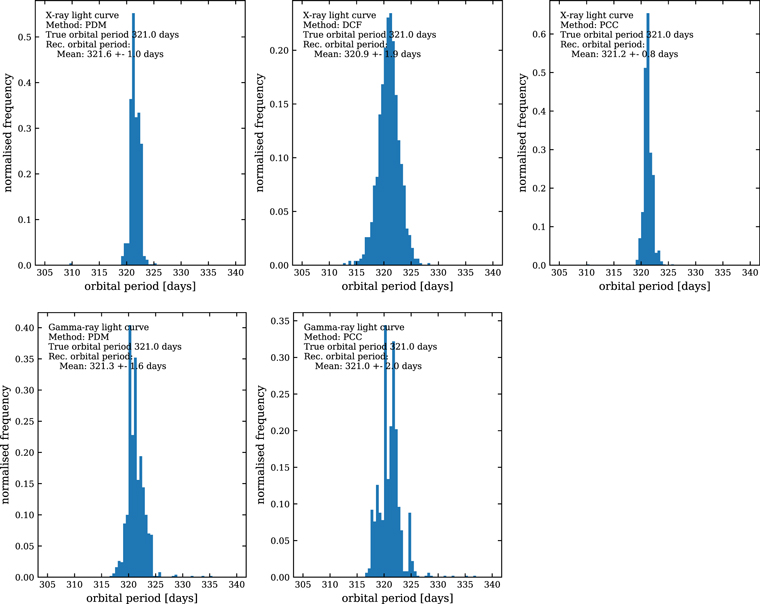
Figure 11. Outcome of the analysis of 1000 Monte Carlo-generated light curves using the following data sets as templates for the toy MC. Top: Swift-XRT; bottom: VERITAS and H.E.S.S. In all cases a true orbital period of 321 days is assumed. Different techniques for periodicity analysis, as indicated in the figure panels, have been applied to the same MC-generated light curves. Results are given as both mean and 68% fiducial interval for all methods.
Download figure:
Standard image High-resolution imageAll shown methods are able to reconstruct, for the majority of the MC light curves, the true orbital period with an uncertainty of less than 2 days for the Swift-XRT and gamma-ray data set. The DCF method does not provide reliable estimations when applied to the gamma-ray measurements or to the toy MC based on the gamma-ray data. This is probably due to the sparsity of the gamma-ray data set and the larger uncertainties of the flux measurements. Statistical uncertainties for the given data sets are derived from the 68% fiducial intervals of the corresponding toy MC analysis. Systematic uncertainties are derived from the largest difference to the expected values (0.6 days) and the impact of the choice of the bin width on the calculation of the averaged light curves. Bin widths from 0.025 to 0.1 in orbital phase are tested and the largest difference is used to estimate the contribution to the systematic uncertainties. The total systematic uncertainty for the determination of orbital period is estimated to be  days and
  days.
days.
Confidence limits on the correlation coefficients are obtained in a similar fashion: 1000 toy MC light curves with similar data structure to the one obtained by observations are used to calculate the 95% and 99% quantiles. Two null hypotheses are distinguished: a constant flux is assumed for the determination of the statistical significance of the correlation coefficients for the analysis of the orbital period (see Figure 12(c)). For the search for modulation periods other than the orbital period, toy MC light curves as described above, including the average observed orbital modulation pattern, are generated and analyzed with the different methods of determining the different periods (see Figure 12(d)).
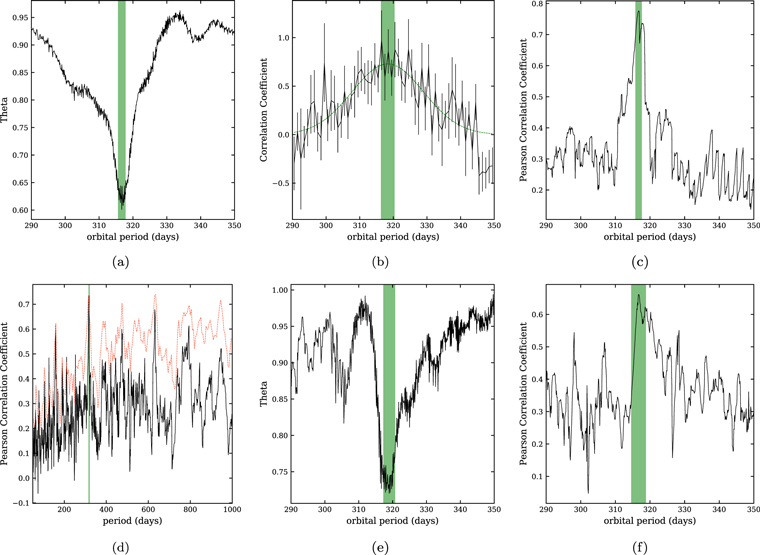
Figure 12. Results of the periodicity analysis of (a)–(d) Swift-XRT and (e)–(f) gamma-ray measurements, applying different methods: (a) Phase dispersion (PDM; Swift-XRT); (b) discrete correlation coefficient (DCF; Swift-XRT); (c) Pearson correlation coefficient (PCC; Swift-XRT); (d) search for periods other than the orbital period in the range 50 to 1000 days; Pearson correlation coefficient (PCC; Swift-XRT); the red dashed line indicates the 99% containment level obtained from Monte Carlo sets of the XRT light curve (to take spectral leakage into account, an orbital periodicity of 317.3 days is assumed in the Monte Carlo sets); (e) phase dispersion (PDM; gamma-ray energies); (f) Pearson correlation coefficient (PCC; gamma-ray energies). All coefficients are plotted as a function of orbital period. The green shaded areas indicate the 68% fiducial interval obtained by the analysis of MC-generated light curves (see text for details).
Download figure:
Standard image High-resolution imageFigure 12 shows the results of application of all three techniques on the Swift-XRT and gamma-ray light-curve measurements (see Figure 2). A summary of all obtained orbital periods together with those reported in the literature is given in Table 3.
Appendix B: Impact of Orbital Period Uncertainty on Phase-folded Light Curves
Uncertainties on the determination of the orbital period might lead to significant differences in the shape of the phase-folded light curves given the long total observation time of ≈15 yr for gamma-ray and ≈10 yr for X-ray measurements. To test this, four different orbital periods are assumed: P+ = 319.5 days, P− = 315.1 days, PM = 313 days, and PHα = 308 days. P+ and P− correspond to a change in the orbital period by 1σ statistical error plus the systematic uncertainty; PM and PHα correspond to the solutions presented in Moritani et al. (2018).
Figures 13 and 14 show the impact of the variation of the assumed orbital period: the three most prominent features of a peak around phases 0.3, a minimum around phase 0.4, and a second maximum region around phase 0.6 are clearly visible in all cases. This shows that the choice of Porb = 317.3 days does not influence the discussion of the physical properties presented in this work, except for the shortest period of 308 days. It should be noted that assuming such a short orbital period, as derived from optical Hα observations (Moritani et al. 2018), would change this picture significantly, because most of the discussed features disappear (Figures 13(d) and 14(d)).
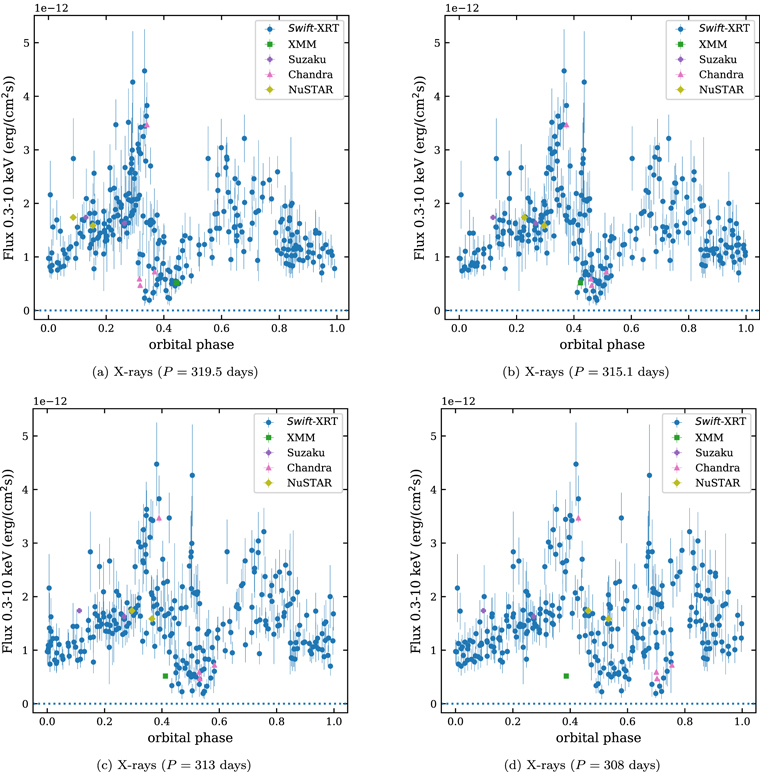
Figure 13. X-ray (0.3–10 keV) light curves as function of orbital phase assuming orbital periods as indicated below the plots. For further details, see Figure 3 and text.
Download figure:
Standard image High-resolution image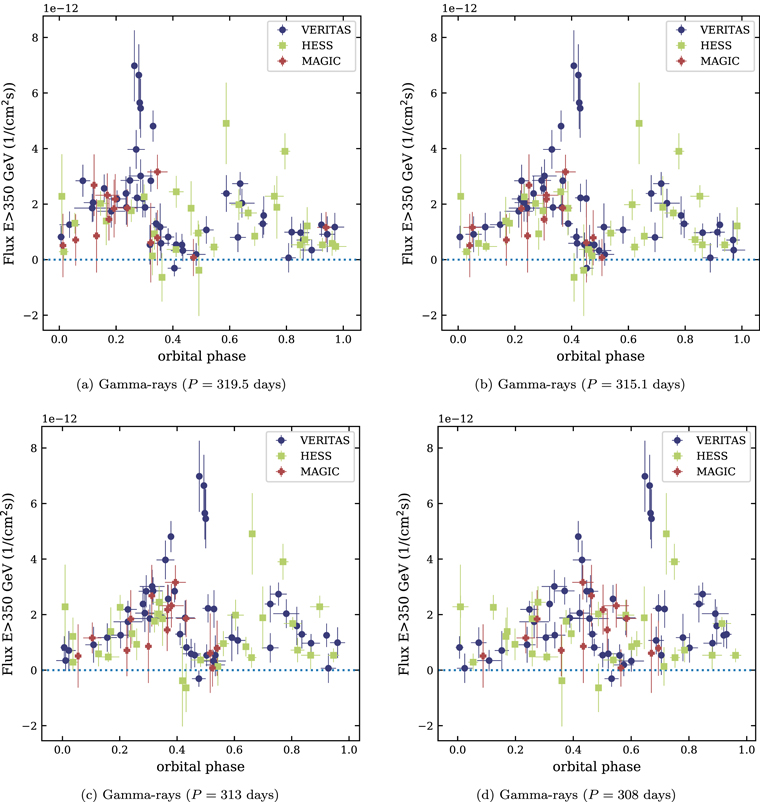
Figure 14. Gamma-ray (>350 GeV) light curves as a function of orbital phase assuming orbital periods as indicated below the plots. For further details, see Figure 3 and text.
Download figure:
Standard image High-resolution imageAppendix C: Light Curves per Orbital Cycle
The gamma-ray observations with H.E.S.S., MAGIC, and VERITAS sum up to a total observation time of ≈450 hr spanning 18 orbits of HESS J0632 + 057 covering the period 2004–2019. The X-ray observations by the Swift-XRT, Chandra, XMM-Newton, Suzaku, and NuSTAR are obtained during 14 orbits of the binary system. Despite this large amount of data, there is no good coverage along most of these orbital cycles due to observational constraints and the long binary period of 317 days. This is illustrated in Figures 15 and 16, which show the light curves per orbital cycle at both X-ray and gamma-ray energies assuming an orbital period of 317.3 days.
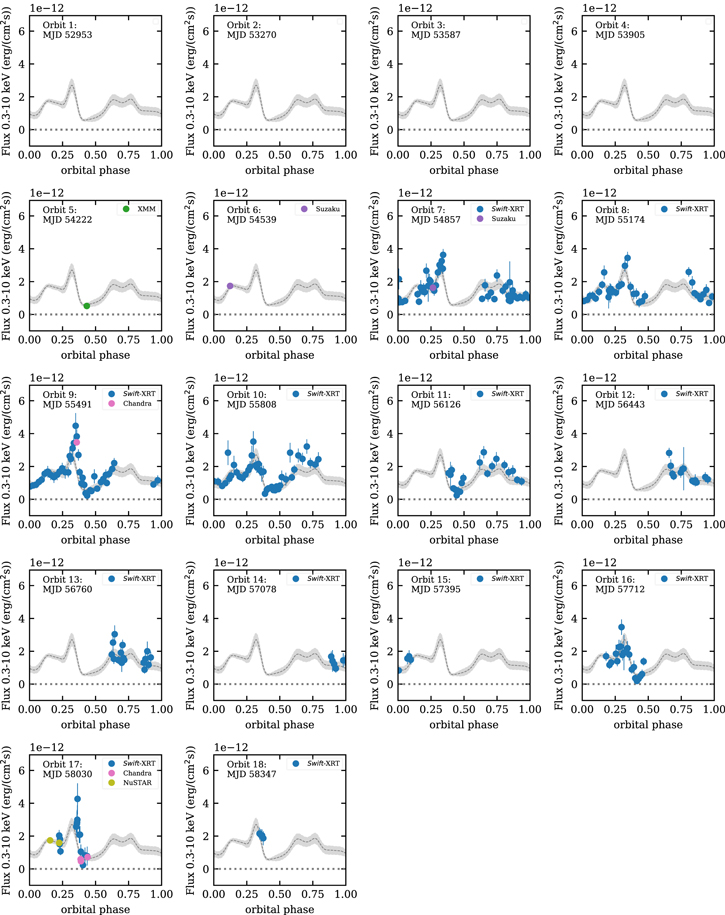
Figure 15. X-ray (0.3–10 keV) light curves as a function of orbital phase for each of the observed orbital cycles. Orbits are numbered following the start of the gamma-ray observations (no X-ray observations are available for the first four orbits; empty panels are shown for easier comparisons with Figure 16). The MJD given in each panel indicates the start of each orbit. An orbital period of 317.3 days is assumed. Vertical lines show statistical uncertainties; note that these are smaller than the marker size for all instruments but Swift-XRT. The thin blue line and gray shaded band in each plot indicates the average Swift-XRT light curve and its 68% containment region calculated from all measurements and smoothed by applying a cubic spline fit.
Download figure:
Standard image High-resolution image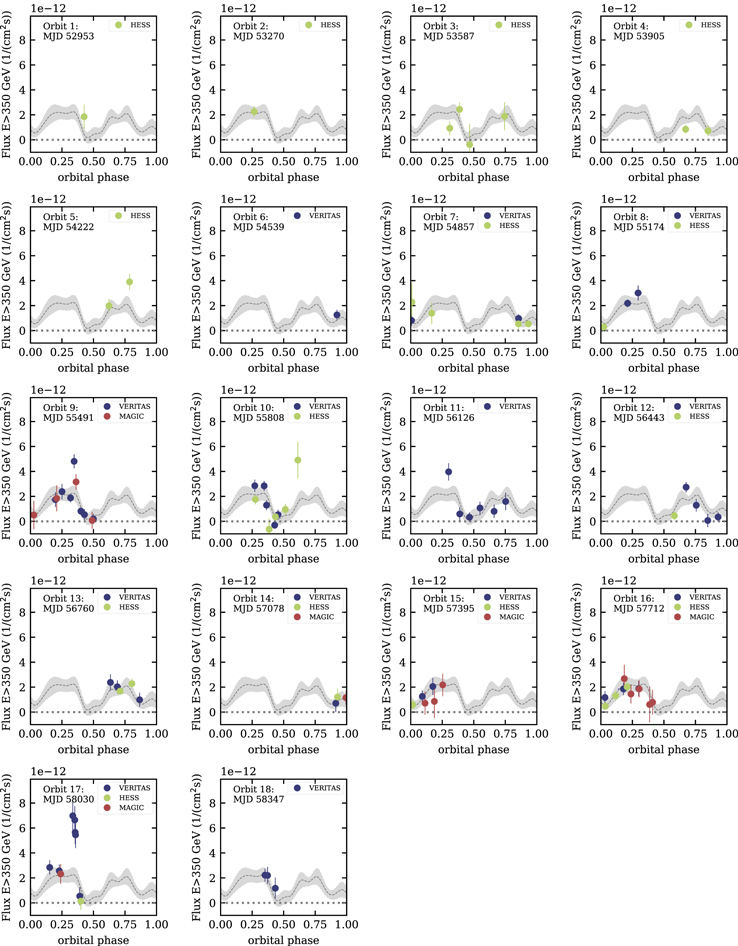
Figure 16. Gamma-ray (>350 GeV) light curves as a function of orbital phase for each of the observed orbital cycles (see Figure 15 for further details). The thin blue line and gray shaded band in each plot indicate the average gamma-ray light curve and its 68% containment region calculated from all measurements and smoothed by applying a cubic spline fit.
Download figure:
Standard image High-resolution image
Appendix D: Contemporaneous Spectral Energy Distributions
Contemporaneous X-ray and gamma-ray spectral energy distributions for 38 periods of VERITAS and Swift-XRT observations are available through the Zenodo data repository. 127
Footnotes
- 119
See the Swift-XRT User's Guide (https://swift.gsfc.nasa.gov/analysis/xrt_swguide_v1_2.pdf).
- 120
The current Subaru Telescope Okayama Branch Office.
- 121
- 122
- 123
- 124
The implementation of the DCF method in the Python package pyDCF (https://github.com/astronomerdamo/pydcf) is used.
- 125
The implementation of the Lomb–Scargle method in astropy is used (https://docs.astropy.org/en/stable/timeseries/lombscargle.html).
- 126
The implementation of the PDM method in the Python package PyAstronomy (https://github.com/sczesla/PyAstronomy) is used.
- 127