


Abstract
In the decay phase of solar energetic particle (SEP) events, particle intensities observed by widely separated spacecraft usually present comparable intensities (within a factor of 2–3) that evolve similarly in time. The phenomenon of SEP events is called a reservoir, which could be observed frequently in intensive gradual SEP events. In this work, we find the effects of the magnetic boundary could help to form the reservoir phenomenon in energetic proton and electron events. In the 1978 January 1 and the 2000 November 8 SEP events, we find the effects of the magnetic boundary associated with the reservoir phenomenon were observed simultaneously in the sheath of magnetic cloud/interplanetary coronal mass ejection. Based on the observations, we suggest that the effects of the magnetic boundary could be due to the magnetic mirrors and/or the small diffusion coefficients in the sheath region and they could help to form the reservoir phenomenon in both the energetic proton and electron events in some large SEP events.
Export citation and abstract BibTeX RIS
1. Introduction
Solar Energetic Particles (SEPs) are particles emitted by the Sun that consist of protons, electrons, and ions with energy generally spanning from a few tens of keV to a few tens of MeV, and rarely up to GeV. SEP events are related to both solar flares and coronal mass ejections (CMEs), and they could be roughly divided into two categories: impulsive SEP events and gradual SEP events. Impulsive events, with characteristics of short duration, low intensity, and enhanced He-3, are produced by solar flares. Gradual events usually last longer and they are related to CMEs.
During the decay phase, particle intensities of large SEP events observed by widely separated spacecraft (in latitude, longitude, and radial distance) usually present comparable intensities (within a factor of 2–3) that evolve similarly in time. The phenomenon was first noticed by McKibben (1972), then named the "reservoir phenomenon" (Roelof et al. 1992), and it has been discussed frequently in many papers (Reames et al. 1997; Maclennan et al. 2001; Lario et al. 2003; McKibben et al. 2003; Tan et al. 2009; Zhang et al. 2009; Dröge et al. 2010; Lario 2010; Dresing et al. 2012; Qin et al. 2013; Qin & Wang 2015; Zhao et al. 2017). Since the reservoir phenomenon can appear in different energy channels simultaneously, the spectra of SEP observed by widely separated spacecraft could be the same. Therefore, the reservoir phenomenon is also called "Spatial Invariance in the Spectra" of SEP events (Reames et al. 1997).
One possible explanation of the SEP reservoir phenomenon is an enhanced perpendicular diffusion (McKibben 1972; McKibben et al. 2001). Unlike the explanation by McKibben (1972), Roelof et al. (1992), and Reames et al. (1997), they suggest interplanetary coronal mass ejections (ICMEs) could play an important role in forming reservoirs during the decay phase of gradual SEP events. They proposed that the magnetic field is compressed by the ICME as it propagates in interplanetary space, which increases the magnetic field magnitude in the outer boundary of the ICME. Between the outer boundary of ICME and the Sun there forms a magnetic bottle and energetic particles could be mirrored by the strong magnetic field. As the magnetic bottle expands, SEP intensities gradually decrease due to the effects of adiabatic cooling and parallel diffusion, and energetic particles could be redistributed to become uniform throughout the entire heliosphere. A complete understanding of reservoir phenomenon is still under investigation.
In order to examine the two possible mechanisms, Lario (2010) used energetic electron data from the ACE and Ulysses spacecrafts to determine when and where these reservoirs were observed by the two spacecraft. The observations show the reservoir effect extends to all latitudes and over a wide range of longitudes. They found that perpendicular diffusion or redistribution of particles may be responsible for the formation of reservoir and the reservoir effect should be explained in a three-dimensional view. Recently, Wang et al. (2021) used energetic proton data from six spacecraft, including two Helios and IMP 8 spacecraft from 1976 January to 1980 March, and two STEREO and SOHO spacecraft from January 2010 to September 2014, to study the reservoir phenomenon over a range of longitudes. They suggested that the perpendicular diffusion in interplanetary space is an important mechanism to explain the uniform distribution of SEPs. Moreover, they also found the effects of magnetic boundary could also help to form the reservoir phenomenon in the energetic proton event on 1976 April 30. They suggested the reservoir phenomena are due to the effects of magnetic boundary and perpendicular diffusion throughout the heliosphere. However, there were many gaps in the plasma data, so they could not analyze the systematic configuration of magnetic field in detail.
We have checked all reservoir events of energetic protons, which were identified in our previous study (Wang et al. 2021), to study the effects of magnetic boundary on the formation of reservoir phenomenon. Among these events, the 1976 April 30 and 1978 January 1 events are of special interest to us because the intensities of 4–13 MeV protons suddenly dropped by a factor of over 10 in several hours, so that the magnetic boundary effects were more obvious than in other events. Furthermore, we checked all reservoir events of energetic electrons observed by Ulysses and ACE from 1997 January to 2006 December. Similar to the energetic proton events, in the 2000 November 8 event, the magnetic boundary effects were also very obvious according to the intensities of 53–103 keV electrons.
Since there were many gaps in the plasma data of the 1976 April 30 event, in this work we focus on the effects of magnetic boundary associated with the reservoir phenomenon in the energetic proton event on 1978 January 1 and the energetic electron event on 2000 November 8. The 1978 January 1 event was observed by the Helios 1, Helios 2, IMP 8, and Voyager 1 spacecraft at different longitudes and radial distances, and the 2000 November 8 event was observed by the Ulysses and ACE spacecraft at different latitudes, longitudes, and radial distances. In Sections 2 and 3 we present the observations of the two reservoir events. In Section 4 we discuss the effects of magnetic boundary. Finally, Section 5 summarizes the results of the present study.
2. The Energetic Proton Event on 1978 January 1
As shown in the Figure 1, during the period of 1978 January 1 to 7, Helios 1 was near 1 au, Helios 2 and IMP 8 were close to one another near 1 au, and Voyager 1 and Voyager 2 were close to one another near 2 au. The location information of Helios 1, Helios 2, the IMP 8, and Voyager 1 are listed in Table 1. Because Voyager 1 (at 0.9° longitude, 1.93 au) and Voyager 2 (at 1.4° longitude, 1.92 au) were very close, we only discuss observational data from Voyager 1 in this paper. For Helios 1 and Helios 2, we use solar wind data from the Plasma Experiment Investigation instrument and the Flux-gate Magnetometer instrument, and energetic proton data from the Cosmic Radiation Investigation instrument. For IMP 8, we use solar wind data from the MIT Faraday cup experiment, and energetic proton data from the Goddard Medium Energy experiment. For Voyager 1, we use solar wind data from the Triaxial Fluxgate Magnetometer and Plasma Spectrometer, and energetic proton data from the Low-energy Charged Particle instrument. In the event, Burlaga et al. (1981) analyzed the plasma data from five spacecraft (Helios 1, Helios 2, IMP 8, Voyager 1, and Voyager 2). They found a systematic configuration of the magnetic field and named it "magnetic cloud (MC)". MCs are a subset of ICMEs and could be identified on the basis of the following characteristics: (1) as the magnetic cloud moves past a spacecraft, the magnetic field direction rotates smoothly through a large angle, close to 180; (2) the magnetic field strength is higher than average; and (3) the temperature and plasma  (where PT
is the thermal pressure and PB
is the magnetic pressure) are low. All occur on a timescale of about 1 day. The positions of the five spacecraft are very favorable for the configuration of the magnetic field in the plasma because the widely separated spacecraft crossed different parts of the MC. Therefore, the 1978 January 1 event is of special interest (Burlaga et al. 1981; Zhang & Burlaga 1988; Burlaga et al. 1990) and has been used as a basis for a sketch of the global configuration of a magnetic cloud.
(where PT
is the thermal pressure and PB
is the magnetic pressure) are low. All occur on a timescale of about 1 day. The positions of the five spacecraft are very favorable for the configuration of the magnetic field in the plasma because the widely separated spacecraft crossed different parts of the MC. Therefore, the 1978 January 1 event is of special interest (Burlaga et al. 1981; Zhang & Burlaga 1988; Burlaga et al. 1990) and has been used as a basis for a sketch of the global configuration of a magnetic cloud.
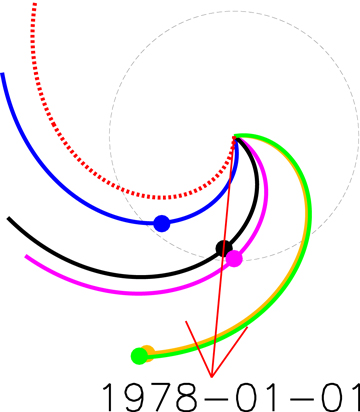
Figure 1. The locations of Helios 1, Helios 2, IMP 8, Voyager 1, and Voyager 2 are indicated by the blue, black, pink, green, and yellow dots, respectively. To use a Parker solar wind model with a speed of 400 km s−1, the longitudinal coordinates of the spacecraft magnetic footpoint are shown in the figure. The nominal Parker field line that originates from the solar flare is represented by the dotted red spiral and the longitude of the flare is indicated by the arrow. The orbit of the Earth is represented by the circle.
Download figure:
Standard image High-resolution imageTable 1. The SEP Event Observed by Helios 1/2, IMP 8, and Voyager 1
| Solar Event | Flare- | Spacecraft | Radial | Longitude | Shock Time | Drop Time | MC Time |
|---|---|---|---|---|---|---|---|
| (Date, HR) | SC (°) | Distance (au) | (°) | (day/hr/minutes) | (day/hr) | (day/hr) | |
| 1978/01/01, 21 | E23 | Helios 1 | 0.94 | 346 | 3/08/38 | 3/09 | 4/18 |
| E57 | Helios 2 | 0.93 | 20 | 3/14/50 | 4/06 | 4/17 | |
| E62 | IMP 8 | 0.98 | 25 | 3/20/41 | 4/09 | 4/17 | |
| E91 | Voyager 1 | 1.93 | 0.9 | 6/01/34 | No | 7/13 |
Note. Column 1: date, hour of solar flare. The time is universal time. Column 2: the angular distance between the solar flare and the magnetic footpoint of the spacecraft. E(W) indicates that the flare is East(West) to the magnetic footpoint of the spacecraft assuming the nominal Parker spiral with solar wind speed of 400 km s−1. "SC" is short for spacecraft. Column 3: the spacecraft who observed the reservoir event. Column 4 and 5: the radial distance and longitude of spacecraft which is measured in Heliographic Inertial Coordinate. Column 6: shock time (day/hour/minute). Column 7: the drop time of SEP intensity (day/hour). Column 8: the front boundary time of magnetic cloud (day/hour). "HR" and "MIN" are short for hour and minute. "No" indicates there is no obvious related phenomenon.
Download table as: ASCIITypeset image
In order to compare the particle intensities observed by different spacecraft, we choose observations of energetic protons provided by Helios 1, Helios 2, and IMP 8, with the similar energy channels: 4–13 MeV, 13–27 MeV, 27–37 MeV, 37–51 for Helios; and 4.2–13.6 MeV, 13.6–28.7 MeV, 28.7–35.2 MeV, 35.2–51.0 MeV for IMP 8. Due to the limit of energy channels, only the 3.4–17.6 MeV protons from Voyager spacecraft can be used in this work. In this paper, the unit of intensity is  . The data come from the CDAWeb.
1
We also use solar wind data near the Earth from the OMNIWeb.
2
. The data come from the CDAWeb.
1
We also use solar wind data near the Earth from the OMNIWeb.
2
In Figure 2, we plot the SEP event on 1978 January 1 observed by four spacecraft (Helios 1, Helios 2, IMP 8, and Voyager 1). For the neutron monitor data from OULU station, the local vertical geomagnetic cutoff rigidity is about 0.81 GV. Since the plasma data from IMP 8 have worse statistics, we use OMNI data instead. From Figure 1, it is shown that Helios 1 was well connected with the flare by the magnetic field lines; but the magnetic field line through Voyage 1 was far away from the flare. In Figure 2 one can see the following during the rising phase of the event. The SEP intensities observed by Helios 1 rose quickly and they were the most intense. At the same time, the SEP intensities observed by Voyager 1 increased more slowly and they were much smaller than that observed by Helios 1. The prompt increases of the SEP intensities observed by Helios 1 indicate the good magnetic connection between the source and the Helios 1. According to the 4–13 MeV protons, the SEP intensities observed by Helios 1 decreased gradually after the peak time before 1978 January 3 and they suddenly dropped by a factor of 10 in several hours since 06 UT on 1978 January 3. The sudden drops of SEP intensities were also observed by Helios 2 at 06 UT on 1978 January 4 and IMP 8 at 09 UT on 1978 January 4. At the same time, the reservoir phenomenon was observed by Helios 1, Helios 2, and IMP 8. The sudden drops of SEP intensities observed by IMP 8 were also accompanied by a Forbush Decrease (FD) as shown in the counting rates of neutron monitor.
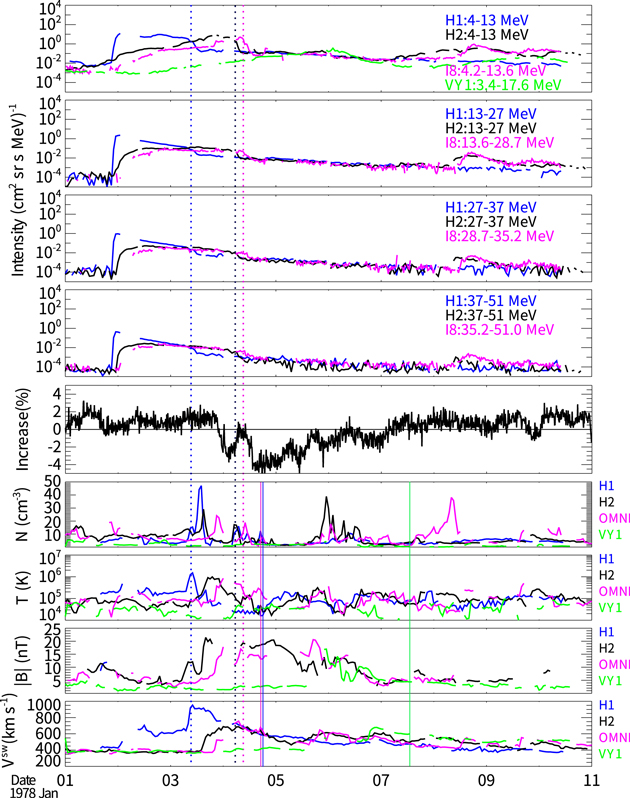
Figure 2. From top to bottom: energetic proton intensities (panel 1–4), neutron monitor count rates from OULU station (panel 5), plasma density (panel 6), proton temperature (panel 7), magnetic field intensity (panel 8), and solar wind speed (panel 9) in 1978 January 1 reservoir event. H1, H2, I8, and VY1 are short for Helios 1, Helios 2, IMP 8, and Voyager 1, respectively. The blue, black, and pink vertical dotted lines indicate the onset times of the sudden drops in the SEP intensities observed by Helios 1, Helios 2, and IMP 8, respectively. The blue, pink, and green vertical solid lines indicate the front boundary time of magnetic cloud observed by Helios 1, Helios 2/IMP 8, and Voyager 1, respectively.
Download figure:
Standard image High-resolution imageAs can be seen in Figure 2, the sudden drops of SEP intensities happened in all energy channels. Among the four spacecraft, the speed of solar wind observed by Helios 1 was the largest and that observed by Helios 2 and IMP 8 was smaller. The sudden drops were observed first by Helios 1, then by Helios 2 and IMP 8; but not observed by Voyager 1. The Voyager 1 was not well connected to the source. As a result, energetic particles arrived at Voyager 1 by the effects of perpendicular diffusion and SEP intensities observed by the Voyager 1 increased very slowly. At the same time, the effects of magnetic boundary also decreased as the shock propagated outward. Therefore, there was no drop observed by Voyager 1; although there was a shock passing. According to Table 1, the drop time for every spacecraft was between the shock time and MC time, which indicates the sudden drop happened in the sheath region. Since the front boundary of magnetic cloud was simultaneously observed by Helios 2 and IMP 8, we only use one pink vertical line to represent the two moments in Figure 2. In the sheath, the magnetic field was very turbulent and the intensity was much higher than the background. As a result, the sudden drops of SEP intensities might be due to the magnetic field in the sheath. In Table 1, the shock time was provided by Burlaga et al. (1981) and the MC time was provided by Burlaga et al. (1990).
3. The Energetic Electron Event on 2000 November 8
As shown in Figure 3, on 2000 November 8, ACE was near 1 au, Ulysses was at 2.4 au, longitude 148◦, and latitude 79◦. We choose observations of energetic electrons provided by ACE and Ulysses, with the similar energy channels: 53–103 keV, 103–175 keV, and 165–300 keV for ACE; and 50–90 keV, 90–165 keV, and 165–300 keV for Ulysses. For ACE, we use solar wind data from the Magnetometer, the Solar Wind Electron Proton, and the Alpha Monitor instrument, as well as energetic electron data from the Electron Proton and Alpha Monitor instrument. For Ulysses, we use solar wind data from the Vector Helium Magnetometer/Flux Gate Magnetometer and Solar Wind Observations Over the Poles of the Sun instrument, and energetic electron data from the Heliosphere Instrument for Spectra Composition and Anisotropy at Low Energies.
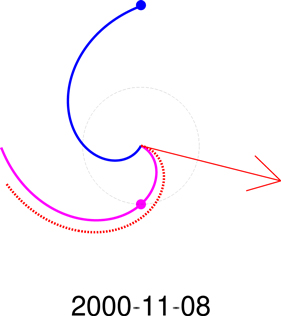
Figure 3. This figure shows a plot similar to Figure 1 except that the pink and blue dots represent the longitudes and radial distances of ACE and Ulysses, respectively.
Download figure:
Standard image High-resolution imageIn Figure 4, we plot the SEP event on 2000 November 8 observed by ACE and Ulysses. The local vertical geomagnetic cutoff rigidity of neutron monitor data from SOPO station is about 0.1 GV. Since the cutoff rigidity of the SOPO station is smaller than that of the OULU station, the Forbush decrease in this event was observed by the SOPO station but not by the OULU station. For this reason, we use the data from the SOPO station in this event. OMNI data are used instead of the plasma data observed by ACE to improve the statistics. ACE observed more intense and faster-rising SEP intensities than Ulysses did during the rising phase of the event. According to every energy channel of energetic electrons, the intensities observed by ACE decreased gradually after the peak time before 2000 November 11. The SEP intensities observed by ACE suddenly dropped by a factor of 10 in several hours since 04 UT on 2000 November 11. Afterwards the reservoir phenomenon was observed by ACE and Ulysses.
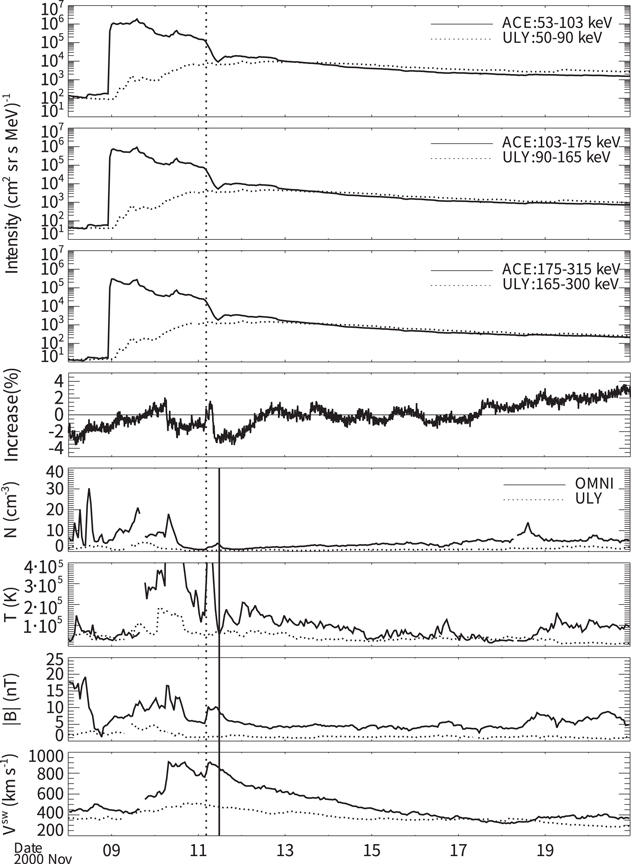
Figure 4. From top to bottom: energetic electron intensities (panel 1–3), neutron monitor count rates from SOPO station (panel 4), plasma density (panel 5), proton temperature (panel 6), magnetic field intensity (panel 7), and solar wind speed (panel 8) in 2000 November 8 reservoir event. Uly is short for Ulysses. The vertical dotted line indicates the onset time of the sudden drop in the SEP intensities observed by ACE. The vertical solid line indicates the front boundary time of ICME observed by ACE.
Download figure:
Standard image High-resolution imageAs shown in Figure 4, the sudden drops of SEP intensities happened in all energy channels at the shock passage at ACE. The sudden drops of SEP intensities observed by ACE were also accompanied by a Forbush decrease shown in the counting rates of neutron monitor. The sudden drops were observed by ACE but not observed by Ulysses. According to Table 2, the onset time of drop was close to the shock time and the SEP intensities decreased by a factor of 10 in the following several hours, which indicates the sudden drop happened in the sheath region. In the table, the shock time observed by ACE is provided by the ACE Lists of Disturbances and Transients on the web. 3 The front boundary time of ICME observed by ACE is provided by Richardson & Cane (2010). According to the shock list provided by Gosling and Forsyth, 4 the shock observed by ACE at 04 UT on November 11 was not detected by the Ulysses. Furthermore, according to the ICME list provided by Gosling and Reisenfeld, 5 the ICME observed by ACE at 08 UT on November 11 was not detected by the Ulysses.
Table 2. The SEP Event Observed by ACE and Ulysses
| Solar Event | Flare- | Spacecraft | Radial | Longitude | Shock Time | Drop Time | ICME Time |
|---|---|---|---|---|---|---|---|
| (Date, HR) | SC(°) | (°) | Distance (au) | (°) | (day/hr/minutes) | (day/hr) | (day/hr) |
| 2000/11/08, 23 | W20 | ACE | 0.99 | 330 | 11/04/01 | 11/04 | 11/08 |
| W122 | Ulysses | 2.4 | 148 | No | No | No |
Note. In this table, the parameters are the same as that in Table 1 except that the energetic electron event was observed by ACE and Ulysses spacecraft. The Ulysses was located at latitude 79◦, while ACE was located at the ecliptic plane.
Download table as: ASCIITypeset image
4. Effects of the Magnetic Boundary in the Forming of the Reservoir Phenomenon
As discussed in the previous sections and shown in Figures 2 and 4, due to the effects of magnetic boundary, the sudden drops of SEP intensities and the reservoir phenomenon were observed by multiple spacecraft simultaneously. The drops in the SEP intensities were observed in the region of sheath that was after the passages of the shocks but before the MC/ICME. In the 1978 January 1 event, a magnetic cloud was observed by all four spacecraft; but the sudden drops of SEP intensities were only observed by Helios 1, Helios 2, and IMP 8, whose solar distance was near 1 au but was not observed by Voyager 1 near 2 au. In the 2000 November 8 event, an ICME and the sudden drops of SEP intensities were observed by the ACE spacecraft but not by Ulysses. In the two events, magnetic boundary could be produced by the compression process between MC/ICME and ambient solar wind. Based on the observations, the effects of magnetic mirroring could be strong, and the diffusion process of SEPs might be weak, which led less particles to transport into the reservoir region. Because of such effects, the particle intensity gradients between different spacecraft suddenly decreased after the spacecraft passed the magnetic boundary. Furthermore, the effects of the magnetic boundary were also observed by the neutron monitor with an FD. The neutron monitor observed the decreased counting rates after the sudden drop of the SEP intensities. Therefore, one can assume there was a boundary for the energetic particles to propagate into the inner heliosphere.
According to the time profiles of 4–13 MeV protons in the 1978 January 1 event, the reservoir phenomenon was observed by Helios 2 and IMP 8 after the sudden drops of SEP intensities. Due to the sudden drops, the longitudinal gradients in the SEP intensities observed by Helios1 and Helios 2/IMP 8 decreased much more quickly than in the common conditions of interplanetary space without the magnetic boundary. In this event, the effects of magnetic boundary could be also observed in higher energy channels; but they became weaker as the energy increased. Therefore, we could assume that it would take more time to observe the reservoir phenomenon by Helios 2 and IMP 8 if there was no magnetic boundary, especially in the case of 4–13 MeV protons. In the 2000 November 8 event, for similar reasons, the effects of magnetic boundary could be important for forming the reservoir phenomenon in the energetic electron event. Consequently, the effects of the magnetic boundary may be important for forming the reservoir phenomenon. However, the reservoir phenomenon could not be produced solely by the magnetic boundary. In the 1978 January 1 and the 2000 November 8 events, the effects of the magnetic boundary were not obvious in the observations from the Voyager and the Ulysses spacecraft. Even in the 2000 November 8 event, the ICME was not detected by the Ulysses spacecraft. As a result, the reservoir phenomenon was not confined by the spatial scale of the ICME. It is suggested that the formation of reservoir phenomenon is helped by the magnetic boundary and perpendicular diffusion throughout the heliosphere in the two events. However, in many other reservoir events identified in our previous study (Wang et al. 2021), the effects of the magnetic boundary in forming the reservoir phenomenon were not obvious as that in the two events, in part because of the observation limitation. In the 1978 January 1 event, if we assume that there was another spacecraft with radial distance, longitude, or latitude far away from Helios 1, Helios 2, and IMP 8, the spacecraft might observe the reservoir phenomenon due to the perpendicular diffusion without the observation of the magnetic boundary. For example, the reservoir effects were observed by Voyager 1 but the effects of the magnetic boundary were not observed due to the large radial distance.
We plot a cartoon of the two SEP events in Figure 5 to illustrate the effects of perpendicular diffusion and magnetic boundary in the reservoir phenomenon. Because the effects of the magnetic boundary were not observed by Voyager 1 and Ulysses, the two spacecraft are not plotted in the Figure 5. In panel (a), the shock was first observed by Helios 1 and then was observed by Helios 2 and IMP 8. During the rising phase, the SEP intensities observed by Helios 1 were much higher than that observed by other spacecraft. The drops in the SEP intensities were observed in the region of sheath. After the drops of SEP intensities observed by Helios 2 and IMP 8, the intensities of energetic particles became uniform among the Helios 1, Helios 2, and IMP 8, and the reservoir phenomenon was observed by the three spacecraft in all four energy channels. According to the study provided by Burlaga et al. (1990), the end time of the MC observed by Helios 1, Helios 2, and IMP 8 were at 19 UT on January 5, 10 UT on January 5, and 14 UT on January 5, respectively. Therefore, the duration of the MC was about one day. After the drops of SEP intensities happened, energetic particles became uniform among different locations. The reservoir phenomenon lasted more than three days, which was longer than the duration of magnetic cloud.

Figure 5. A cartoon to illustrate the effects of the magnetic boundary and perpendicular diffusion in the reservoir phenomenon. In panel (a), the 1978 January 1 SEP event is plotted in the ecliptic plane. The blue, black, and pink big dots represent the locations of Helios 1, Helios 2, and IMP 8, respectively. The arrow represents the longitude of solar flare. In panel (b), the 2000 November 8 SEP event is plotted in the meridian plane. The black big dot represents the location of ACE. The small black dots indicate solar energetic particles and the densities of the dots represent the intensities of SEP. The arrow represents the latitude of solar flare. In the panels (a) and (b), the red lines indicate the magnetic field lines originating from the Sun. The dashed lines indicated the region of MC/ICME. The black line indicates the interplanetary shock driven by the MC/ICME. The region of sheath was between the shock and the MC/ICME.
Download figure:
Standard image High-resolution image
In panel (b), the shock and ICME were observed by ACE but were not observed by Ulysses. During the rising phase, the SEP intensities observed by ACE were much higher than that observed by Ulysses. The drops in the SEP intensities were observed in the region of sheath. After the drops of SEP intensities observed by ACE, the intensities of energetic particles became uniform between ACE and Ulysses, and the reservoir phenomenon was observed by the two spacecraft in all three energy channels. According to the ICME list provided by Richardson & Cane (2010), the start time of ICME was at 08 UT on November 11 and the end time was at 00 UT on November 12. Therefore, the duration of ICME was about sixteen hours. After the drops of SEP intensities happened, the energetic particles became uniform among different locations. The reservoir phenomenon lasted more than ten days, which was longer than the duration of ICME.
Energetic particles could diffuse across the field lines with the effects of perpendicular diffusion, so the differences in SEP intensities observed by different spacecraft would gradually decline as time goes by during the decay phase. As shown in the cartoon, a magnetic boundary could be produced by the compression process between the background solar wind and a fast MC/ICME. At the same time, behind the interplanetary shock, the diffusion coefficients could be much smaller than the common values due to the enhanced turbulence in the sheath. It is suggested that, with the effects of magnetic mirroring and/or the small diffusion coefficients, the ICME could build a magnetic boundary and reduce the intensities of SEPs behind it. Furthermore, energetic particles could travel throughout interplanetary space and magnetic field lines could undergo the random work (e.g., Shalchi & Qin 2010), so the SEP intensities observed by different spacecraft could be affected by the effects of magnetic boundary, which consequently contribute to the emergence of the reservoir phenomenon observed by multiple spacecraft.
5. Conclusions
In this work, the effects of the magnetic boundary on the reservoir phenomenon have been investigated in the solar energetic proton and electron events. The energy channels of energetic protons from the Helios 1, Helios 2, and IMP 8 spacecraft ranges from several MeV to 50 MeV, while the energy channels of energetic electrons from the Ulysses and ACE spacecraft ranges from 50–300 keV. The effects of the magnetic boundary were identified by the sudden drops in the SEP intensities, and it also appeared in the neutron monitor counting rates.
The effects of the magnetic boundary were observed in the energetic proton intensities in the 1978 January 1 event and they were also observed in the energetic electron intensities in the 2000 November 8 event. In the two SEP events, the effects of the magnetic boundary associated with the reservoir phenomenon were observed simultaneously in the SEP intensities. A magnetic boundary in the sheath could be produced by the compression process between the background solar wind and a fast MC/ICME. The drops in the SEP intensities happened in the sheath that was located at the region between the shock and MC/ICME. Behind the interplanetary shock, the diffusion coefficients could be much smaller than the common values due to the enhanced turbulence in the sheath. It is suggested that, with the effects of magnetic mirroring and/or the small diffusion coefficients, the ICME could build a magnetic boundary and reduce the intensities of SEPs behind it.
In conclusion, with the effects of perpendicular diffusion, energetic particles could diffuse across the field lines, so the differences in SEP intensities observed by different spacecraft would gradually decline as time goes by during the decay phase. The effects of magnetic boundary could affect different spacecraft observed SEP intensities because energetic particles could transport to the heliosphere. Therefore, it could help to form the reservoir phenomenon observed by multiple spacecraft. As shown in the two SEP events, the effects of magnetic boundary could help to form the reservoir phenomenon in both the energetic proton and electron events in some large gradual SEP events.
The authors thank the anonymous referee for valuable comments. We are partly supported by grants NNSFC 41774182, NNSFC 41874206, and NNSFC 42074206. We would like to acknowledge and express our gratitude to the energetic particle and plasma data provided by Helios, IMP 8, Voyager, ACE, Ulysses, SOPO station, and OULU station. We also give thanks to the CDA, NOAA, and NMDB webs for maintaining the data online.
Footnotes
- 1
- 2
- 3
- 4
- 5