


Abstract
The Parker Solar Probe mission (PSP) has completed seven orbits around the Sun. The Wide-field Imager for Solar Probe (WISPR) on PSP consists of two visible light heliospheric imagers, which together image the interplanetary medium between 13 5 and 108° elongation. The PSP/WISPR nominal science observing window occurs during the solar encounters, which take place when the spacecraft (S/C) is within 0.25 au from the Sun. During Orbit 3, an extended science campaign took place while PSP transited between 0.5 and 0.25 au (during both inbound and outbound orbit segments). PSP mission operations implemented a variety of 180° S/C rolls about the S/C-Sun pointing axis during the extended science window. The vantage of the PSP location, combined with the different S/C roll orientations, allowed us to unveil a circumsolar dust density enhancement associated with Venus's orbit. Specifically, we observed an excess brightness band of about 1% at its center over the brightness of the background zodiacal light in all PSP/WISPR images obtained during the extended campaign. We explain this brightness band as due to an increase in the density of the circumsolar dust orbiting the Sun close to the Venusian orbit. The projected latitudinal extent of the ring is estimated at about 0.043 au ± 0.004 au, exhibiting an average density enhancement of the order of 10%. Here, we report and characterize the first comprehensive, pristine observations of the plane-of-sky projection of the dust ring in almost its full 360° longitudinal extension.
Export citation and abstract BibTeX RIS
1. Introduction
The presence of dust particles orbiting the Sun, trapped by planetary gravitation, was suggested in the mid-1970s, in the prescient article of Gold (1975). In brief, planetary gravitational perturbations can capture the dust particles in the zodiacal dust cloud into exterior mean-motion resonances (see, e.g., Weidenschilling & Jackson 1993), thereby stabilizing their orbital decay due to drag forces, namely the solar wind drag (Minato et al. 2004, 2006) and the Poynting–Robertson effect (Poynting 1903; Robertson 1937). Jackson & Zook (1989), in particular, predicted the existence of a resonant dust ring near Earth's orbit, later confirmed by Dermott et al. (1994) using infrared (IR) observations from the Infrared Astronomical Satellite (IRAS; Neugebauer et al. 1984). In a subsequent work, Reach et al. (1995) also confirmed the existence of the dust ring using data from the Cosmic Ray Background Experiment satellite (Boggess et al. 1992). In addition, they also determined the azimuthal distribution of the excess dust density along the ring, finding the enhancement near Earth's orbit to be in agreement with the theoretical predictions (Dermott et al. 1994).
In a detailed reanalysis of observations of the Zodiacal Light Experiment (ZLE; Leinert et al. 1975) on board the Helios mission (Porsche 1981), Leinert & Moster (2007) found a slight increase in the zodiacal light brightness just outside the orbit of Venus as Helios A and B passed through an enhanced region of dust scattering. This local, excess dust density was later confirmed by Jones et al. (2013, 2017) using white-light observations from the heliospheric imagers SECCHI/HI-2A and -2B (Howard et al. 2008; Eyles et al. 2009) on board the STEREO mission (Kaiser et al. 2008). The brightness enhancements observed were only detected when the viewing geometry was such that the lines of sight were tangential to Venus's orbit. They attributed the brightness enhancement to dust particles orbiting the Sun in resonance with Venus. Both observations, i.e., Helios and STEREO, revealed the dust density enhancement only at particular spacecraft locations and/or line of sight (LOS) geometries.
In a recent work, Pokorný & Kuchner (2019) modeled the dust environment in the Venus's orbit by integrating the orbits of 10,000,000+ dust particles evolving from various possible sources exterior to the orbit of Venus (in particular, from Jupiter family comets and Venus's co-orbital asteroids) and subject to gravitational and nongravitational forces. Unlike Jones et al. (2013, 2017), they conclude that resonant trapping due to Venus's gravitational attraction is not enough to produce the circumsolar ring as observed by STEREO observations. According to their simulations, the source of the ring would be co-orbital asteroids along Venus's orbital path. Their interpretation is reinforced by the recent work of Sommer et al. (2020) regarding the effects of neighboring planets on the formation of resonant dust rings. They show that, while dust particles orbiting the Sun can potentially be trapped in resonance by any of the terrestrial planets, a significant ring was found to exist only for Earth when the gravitational effects of all the planets are considered.
In addition, despite the lack of a theoretical prediction, Stenborg et al. (2018) indirectly demonstrated the plausible existence of a circumsolar dust ring associated to Mercury's orbit using STEREO-SECCHI/HI-1 observations. All these observational works using imaging in visible wavelengths have in common the need for complex image processing techniques to make visible a discrete structure that barely exceeds the background brightness in which they appear embedded. The advent of the Parker Solar Probe (PSP) mission (Fox et al. 2016) traveling through regions never visited before by any man-made probe, allowed the discovery of properties of the zodiacal dust cloud long theorized but never proven. For instance, using observation of the Wide-Field Imager for Solar Probe (PSP/WISPR; Vourlidas et al. 2016) on board PSP, Howard et al. (2019) showed that the radial gradient of the images' background brightness gets shallower below about 17 solar radii, a necessary condition if a dust-free zone indeed exists, as postulated by Russell (1929).
The problem of revealing faint dust density structures embedded in the zodiacal dust cloud with the PSP/WISPR observations is exacerbated by the orbital geometry of the PSP mission. 4 The high speed of the PSP spacecraft (S/C) requires a different technique to remove the background scene compared to solar missions at about 1 au, for which a background could be established using an extended time period of observations (see, e.g., Morrill et al. 2006). In preparation for PSP/WISPR, Stenborg & Howard (2017) introduced an advanced technique to obtain the background brightness of heliospheric images without the need to exploit the time domain. A customized version of this methodology has been successfully applied to the images being returned from PSP/WISPR to reveal dynamic K-corona structures (see, e.g., Hess et al. 2020; Poirier et al. 2020; Rouillard et al. 2020; Wood et al. 2020) and allowed us to reveal a dust trail along the orbit of 3200 Phaethon (Battams et al. 2020) as well as a clear view of the dust trail associated with the short-period comet 2P/Encke (G. Stenborg & B. Gallagher 2021, private communication; see, e.g., Stenborg et al. 2018, and references therein).
In this paper, we present the first pristine, white-light observations of the Venus's associated dust ring obtained by the PSP/WISPR telescopes. In Section 2, we describe the observations and methods. In Section 3, we describe our findings and present the first comprehensive observation of a circumsolar ring in almost its full 360° extension. In Section 4, we (1) discuss the observations and methodology employed, (2) elaborate on its location near Venus's orbital path, (3) characterize some of the ring's properties, and (4) discuss our results in the context of previous works. Finally, we summarize our findings and conclude in Section 5.
2. Observations and Methods
PSP/WISPR is a heliospheric imager placed on the ram side of the S/C, consisting of two white-light telescopes akin to the STEREO/SECCHI heliospheric imagers. The filter passbands of the inner (hereafter WISPR-I) and outer (hereafter WISPR-O) telescopes range between 490–740 nm and 475–725 nm, respectively. Their fields of view (FOVs) extend from 135 to 535° elongation (WISPR-I) and from 50° to 108° (WISPR-O). As per the prelaunch observing plan, the nominal science observing window occurs during the so-called solar encounters, when the S/C is within 0.25 au from the Sun (power constraint is one of the main reasons for such a schedule). Postlaunch, it became clear that there is room to obtain some PSP/WISPR observations almost all around the orbit, except when data are being downlinked. In particular, there are orbits during which the nominal science window can be extended and synoptic observations can take place inside 0.5 au. This was the case for Orbit 3.
During the times of the extended science window in Orbit 3 (2019 August 17–27, and September 7–18), PSP mission operations 5 commanded S/C rolls around the S/C-Sun axis. The PSP/WISPR synoptic observing program consisted of images taken regardless of the S/C orientation. For the purposes of this work, we consider two basic roll configurations, namely "unrolled" (absolute value of S/C roll within ±10°, the rotation axis being the Z-axis, i.e., the S/C-Sun line) and "rolled" (170° < S/C roll < 190°). The scene in PSP/WISPR images is such that the Sun is always to the left, with heliographic north pointing approximately up (down) in the "unrolled" ("rolled") images. The left panel of Figure 1 shows the typical scene observed by WISPR-I in the "unrolled" configuration. The scene is dominated by the light scattered by the dust particles in orbit around the Sun (i.e., the F-corona; see, e.g., Howard et al. (2019)) and hence must be removed to reveal both the discrete K-corona structures and/or discrete dust density inhomogeneities that might exist in the zodiacal dust cloud.

Figure 1. Left panel shows a (calibrated) WISPR-I image recorded on 2019 August 23 at 04:00 UT. This scene is dominated by the F-corona brightness. Right panel shows an S/C Roll at the times of the WISPR synoptic observations during the extended and nominal science campaign in Orbit 3. See text for details.
Download figure:
Standard image High-resolution imageThe right panel of Figure 1 shows a detail of the S/C roll angles at the time of any of the PSP/WISPR images obtained during the whole science window. In the plot, we notice the two basic roll configurations, namely with the S/C "unrolled" (data in dark and light blue colors with y-axis on the left) and with the S/C "rolled" (data in dark and light green colors with y-axis on the right). Data in dark (light) colors pinpoint the WISPR-O (WISPR-I) observations. Note that the typical S/C roll configuration during the nominal science windows of any orbit is for the roll to be within ±4°.
The orbital path of PSP introduces several observational challenges. For example, the high eccentricity and small perihelion of the orbit (which translate into a very high and varying speed of the S/C during the data science acquisition) impose a continuous change of the background scene. This precludes the use of conventional image processing techniques to create background models exploiting the time domain. However, even if such techniques were to be an option, they are not suitable to reveal stationary features (such features will exist in both the image and the background model—and hence will be removed along with the background).
Therefore, a suitable technique aimed at revealing a subtle, stationary feature in a white-light image dominated by a strong (and smooth) background (which, in addition, is dependent on the observer's location in the heliosphere) requires a two-step process: first, gross removal of the smooth background signal (e.g., computed by exploiting the spatial domain), followed by the removal of the remnant pseudo-stationary background signal (e.g., computed by exploiting the time domain). The first step is needed to account for the variable brightness and orientation of the smooth component as PSP changes its distance to the Sun. The second step accounts for remnant stationary features in the scene of either real or instrumental nature. Unfortunately, as already stated previously, the exploitation of the time domain may also remove pseudo-stationary and discrete K- or F-signal.
To estimate the background brightness for each individual PSP/WISPR image, we exploit the spatial characteristics of the background scene, and benefit from the known "break" in spatial scales between a discrete feature (due to either an electron- or dust-density inhomogeneity) and the broad contribution of the smooth component of the F-corona signal (e.g., Stenborg & Howard 2017). In this way, the background model follows the smooth gradient of the background brightness, and hence the corrected images will reveal discrete structures regardless of their nature, i.e., whether they are real K- or F-corona features, or instrumental in nature (e.g., the effect of a speck of dust in the optics, inhomogeneities in the detector resulting from the fabrication process, etc.)
Then, to remove remnant stationary features, the usual approach is to create a model of the instrumental background by computing, e.g., the minimum of the background-corrected images taken during similar S/C rolls covering an extended period of time. This "grand-minimum model" will include the stationary features in the time sequence (both instrumental and real). In this work, to disentangle instrumental from real stationary features—and hence be able to unveil faint stationary features that would otherwise wash off—we exploit (1) the change in S/C roll angle between the extended and nominal science windows (hereafter Case 1), and (2) the change in S/C roll between the inbound and outbound segments of the extended science campaign (hereafter Case 2). The separation of the different S/C rolls into a two-case scenario is aimed at minimizing the possibility of a misinterpretation of the findings.
All the images used in this work have been calibrated into Mean Solar Brightness (MSB) units based on the optical properties of the detector at 1 au and are released as the Level 2 data product at the NRL WISPR home page. 6 The calibration procedure has been submitted for publication (Hess et al. 2021). In brief, it includes correction for various instrumental artifacts including the bias, vignetting correction, and photometric calibration of the system. The latter is determined on-orbit using stellar photometry.
3. Results
3.1. Unveiling of an Extended Brightness Enhancement
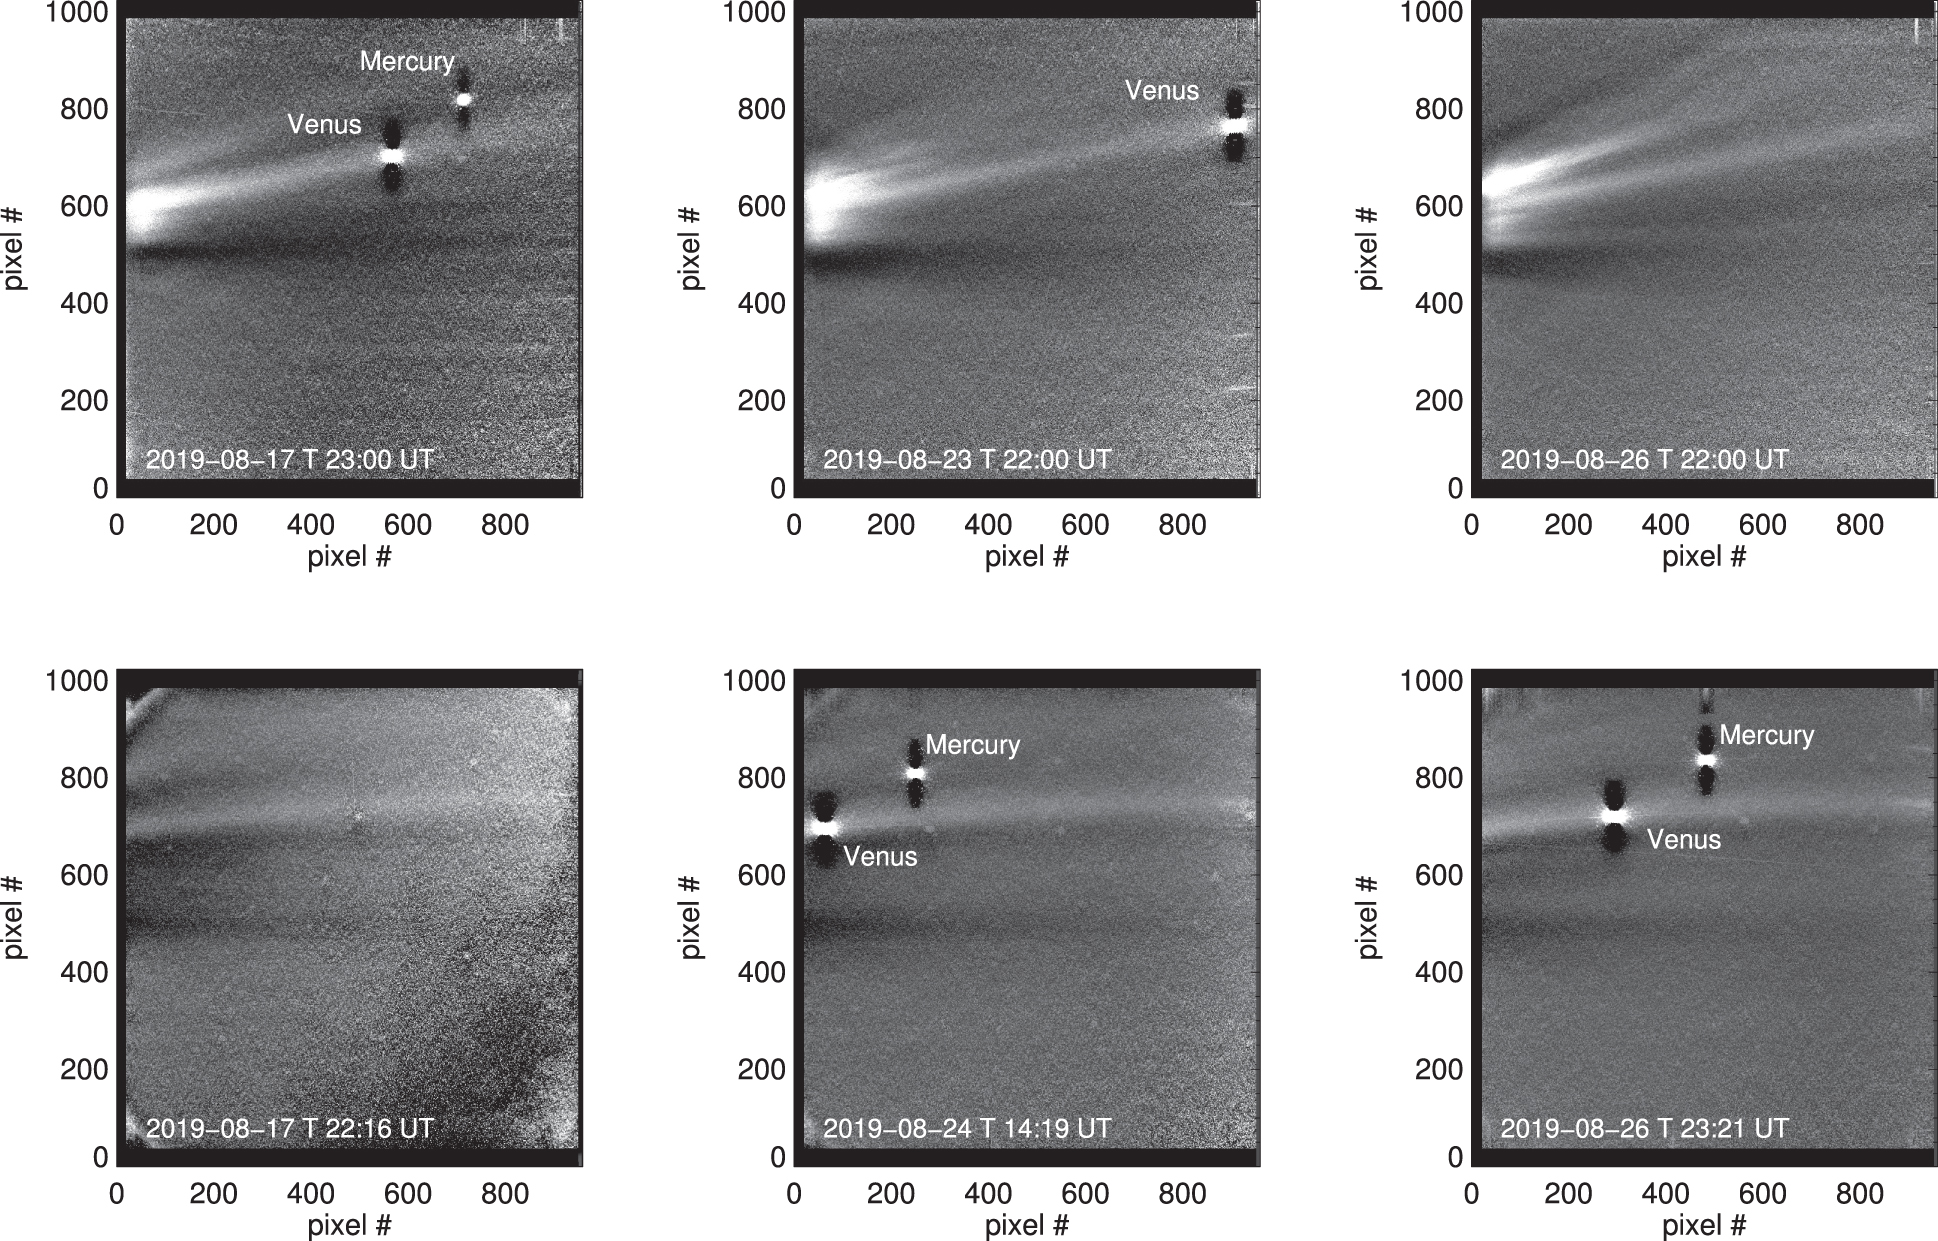
Between 2019 August 17 and 27, PSP approached the Sun from 0.5 to 0.25 au, its roll angle switching between the "rolled" and "unrolled" orientations (see the right panel of Figure 1 for an illustration, and refer to Section 2 for further details). In the upper panels of Figure 2, we show three background-difference snapshots (already corrected by the instrumental artifacts) recorded by WISPR-I on 2019 August 17, 23, and 26, obtained while the S/C was in in the "unrolled" orientation. Corresponding WISPR-O images obtained close in time are shown in the bottom panel. The models to account for the instrumental artifacts on each telescope have been created by taking the minimum of all corresponding "unrolled" background corrected images taken during the nominal science campaign (i.e., here we exploit Case 1).
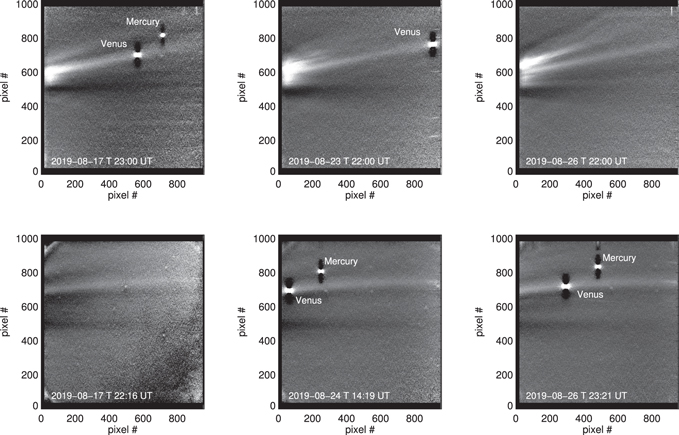
Figure 2. Sample of WISPR-I (upper panel) and WISPR-O (bottom panel) observations recorded during the extended science window of Orbit 3 (inbound segment; see Figure 1). Bright feature extending all across the FOV of both telescopes is the signature of a localized density enhancement matching Venus's orbital path. Star field has been removed with the "sigma_filter" routine of the IDL SolarSoft package.
Download figure:
Standard image High-resolution imageOn WISPR-I images, we notice the presence of a straight ray extending all the way to the outer edge of the FOV. An extended brightness enhancement is also observed in the WISPR-O frames. A bright object (the planet Venus) wanders along the excess brightness band. The other bright object is Mercury. The black features seen above and below both planets are artifacts of the image processing technique used to estimate the background scene of each individual frame due to the excessive brightness of the object compared to the background. (Here, we want to stress the fact that this extended, stationary, brightness enhancement could be unveiled in all the images taken by both telescopes in the time period between August 17 and 27, regardless of the S/C roll angle). As will be shown next, this ray is seen to continue seamlessly into the WISPR-O frames.
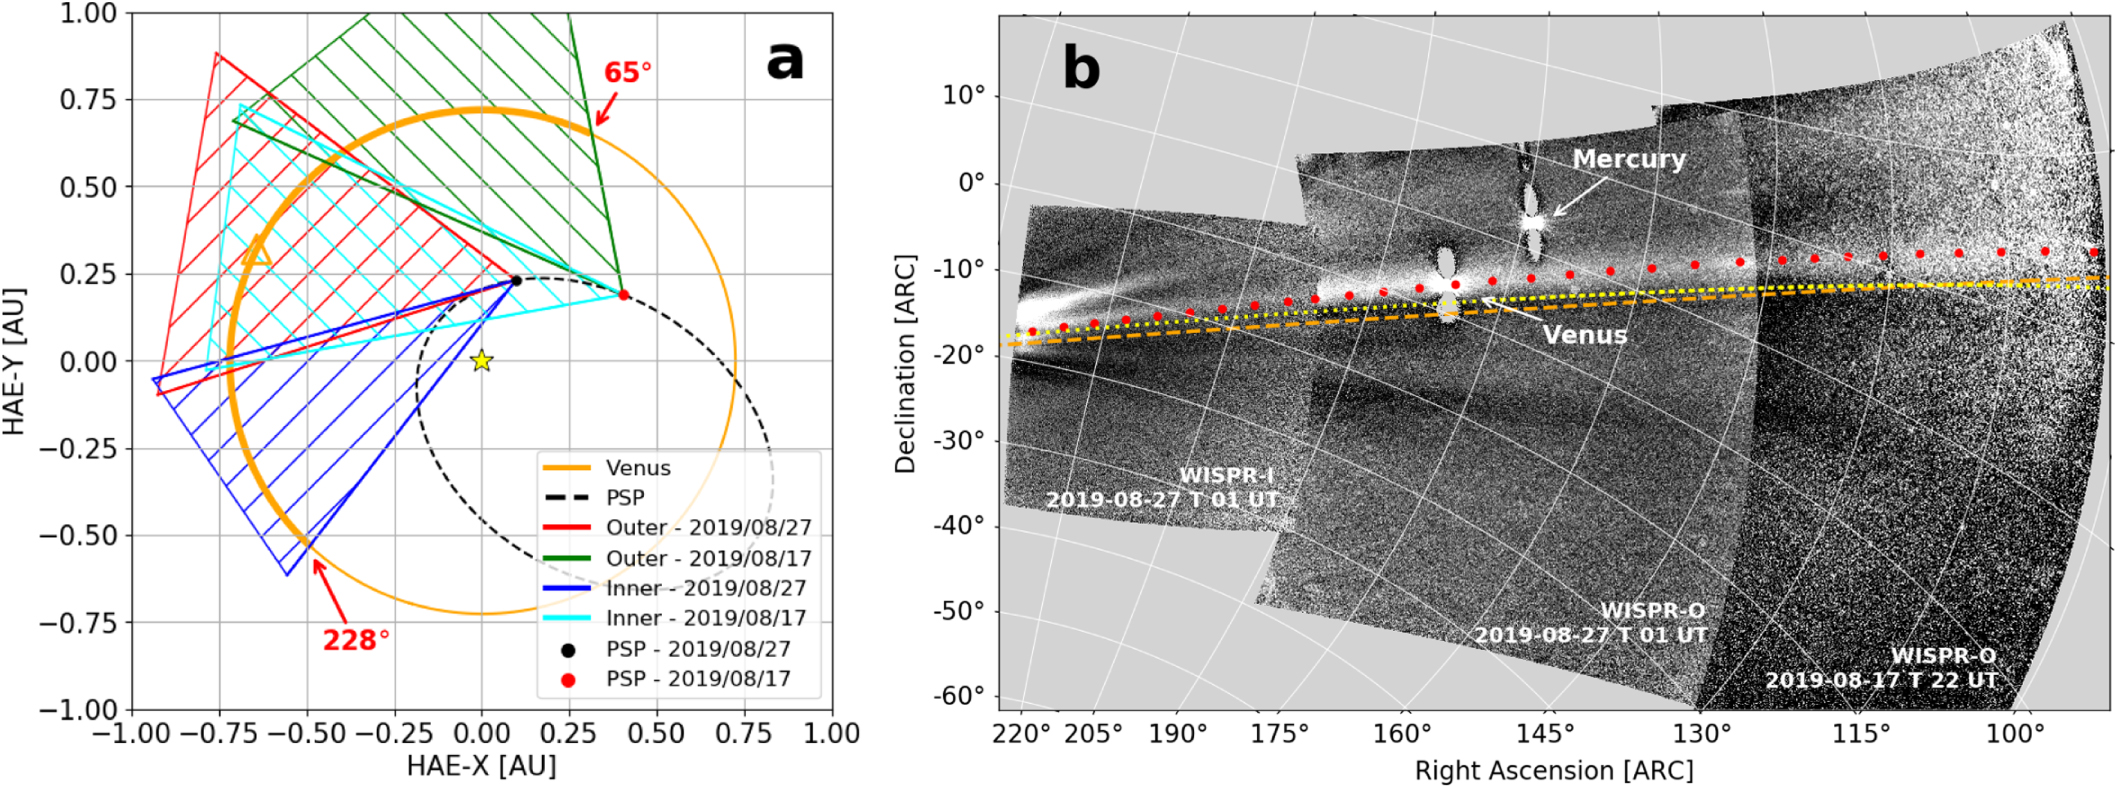
The 2D schematic representation on Figure 3(a) indicates the region of space covered by the PSP/WISPR telescopes in the "unrolled" S/C orientation during this 11 day time frame. The region comprises a section of Venus's orbit between about 65° and 228° ecliptic longitude. The PSP locations at the two extremes are 23° longitude at 0.46 au from the Sun (red dot) and 67° longitude at 0.25 au (blue dot). The green and light blue, hatched regions delineate the FOVs of WISPR-O and -I, respectively, on August 17, while the red and blue hatched regions indicate the respective FOVs on August 27. In Figure 3(b), we show the corresponding PSP/WISPR image composite (one WISPR-I and two WISPR-O) in a celestial coordinate system (GEI; Geocentric Equatorial Inertial), with the orbit of Venus delineated by the red dots. The projection of the invariable plane (inclination iip = 158 and ascending node Ωip = 10758; see Souami & Souchay (2012)) and of the ecliptic plane are depicted by the yellow dotted line and the orange dashed line, respectively. We choose this inertial coordinate system to display the full coverage of the excess brightness feature in the 11 day time period. The composite reveals a plausible association between the brightness enhancement and the 2D projection of Venus's orbit in the longitude range covered.

Figure 3. Combined PSP/WISPR FOV ("unrolled" S/C orientation) between 2019 August 17 and 27. Panel (a): 2D schematic representation of the region of space covered. Orange triangle pinpoints the location of Venus on August 22. Portion of Venus's orbit observed in this time period is delineated with the thicker orange line. The two numbers in red indicate the ecliptic longitude in the HAE (Heliospheric Ares Ecliptic) coordinate system of the extremes of the portion covered. Panel (b): PSP/WISPR mosaic covering the region of space between 65° and 228° ecliptic longitude displayed in a celestial coordinate system (R.A.-decl.). Venus's orbit, invariable plane, and ecliptic are delineated with the red dots, the yellow dotted line, and the orange dashed line, respectively.
Download figure:
Standard image High-resolution imageThe faint and diffuse nature of the excess brightness observed does not allow us to discern a noticeable change in its location between the beginning and end of the 11 day time window (notice, e.g., the matching of the location of the brightness enhancement at the outer edge and inner edge of the frames from August 27 and 17, respectively, in the composite displayed on Figure 3(b)). This can be simply explained by interpreting the brightness enhancement as the signature of an extended, continuous feature, whose projected location in the FOV of the PSP/WISPR telescopes matches the projected orbital path of Venus.
There is a three-day gap in data coverage between August 20 and 22 (see right panel of Figure 1). Therefore, in the following, we restrict the analysis to the observations taken in the S/C "unrolled" orientation between August 23 and early 27 (37 WISPR-I, 16 WISPR-O images). In this time period, the orbit of Venus shifts, in detector coordinates, [6, 9, 11] pixels in the N-S direction at [15°, 45°, 100°] elongation. Under the premise that the brightness enhancement follows the projected orbital path of Venus, this shifting amounts to only a few percent of the observed width of the feature—and therefore allows us to construct a time median image for either telescope, to increase the signal-to-noise and hence help elucidate its spatial extension. In Figure 4, we display a WISPR-I/WISPR-O composite of the median of the images in the time period considered. The composite (displayed in the HPLN-ARC representation (Calabretta & Greisen 2002; Thompson 2006)) highlights the excess brightness along the projected Venus's orbital path (depicted by the red dots). The Sun is to the left of the image, at 0° elongation. The two broken dashed red lines guide the eye to the region of space extending ±0.025 au from Venus's orbital path (a more accurate determination is carried out in Section 4.2). This band places a limit on the width of the brightness enhancement, which is interpreted as the linear, projected extension of the cross section of an excess density feature. The linear extent of the feature in the N-S direction is similar to the value of the cross section of the circumsolar dust ring near Venus orbit detected with both HELIOS (0.048 au; Leinert & Moster 2007) and STEREO (0.055 au; Jones et al. 2013, 2017) observations. The inset is a zoom-in of the region delimited by the red rectangle showing the location of the portion of Venus's orbital path as seen on August 23 (top red line) and 27 (bottom red line). The average N-S displacement in this region is <11 pixels, which corresponds to less than <0.008 au at the location of Venus's orbit.
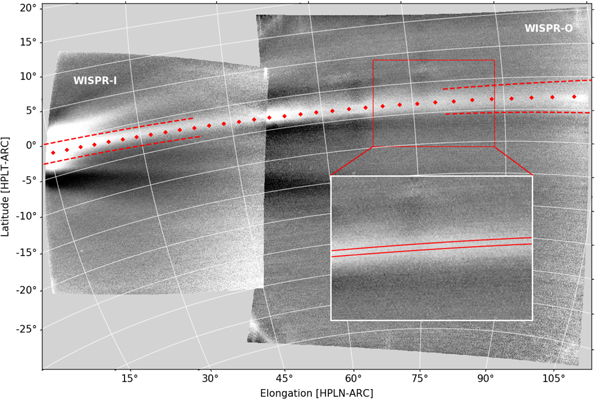
Figure 4. WISPR-I/WISPR-O composite of the median of the images acquired between 2019 August 23 and 27. The Sun is to the left of the image, at 0° elongation. Red dots depict the average location of Venus's orbit in this time period, and the two broken dashed red lines delimit a projected region of space extending ±0.025 au from Venus orbital path. Inset is a zoom-in of the region delimited by the red rectangle, showing the location of the portion of Venus's orbital path as seen on August 23 (top red line) and 27 (bottom red line).
Download figure:
Standard image High-resolution image3.2. Cotemporal Observations of an Extended Brightness Enhancement on Opposite Sides of the Sun
During both the inbound and the outbound segments of the extended science window, a few PSP/WISPR images were recorded in the "rolled" S/C orientation (see the right panel of Figure 1). This allowed us to check the consistency of the findings presented in Section 3.1. In this case, to remove the instrumental artifacts from the background-corrected images that were obtained in the S/C "rolled" orientation, we use "grand-minimum" models (one per telescope) created from all the PSP/WISPR images obtained during the inbound segment of the extended science window to treat the images taken during the outbound segment and vice versa (there exists a ∼10° S/C roll difference between the two segments; see the right panel of Figure 1). In other words, we exploit Case 2.
In Figure 5, we show the 2D representation of the viewing geometry of a combined set of "rolled" and "unrolled" observations on August 25 (panel (a)) and on September 12 (panel (b)). On the former date (at 14:00 UT), PSP was located at an heliocentric distance of about 0.284 au (56307 ecliptic longitude, −1872 latitude), and on the latter (at 22:30 UT), at about 0.373 au (257391, 0741). The portion of Venus's orbit in bold orange delineates the part of the orbit captured by the FOVs of the telescopes.

Figure 5. Combined PSP/WISPR FOV ("unrolled" and "rolled" S/C orientation) on 2019 August 25 (inbound, panel (a)) and September 12 (outbound, panel (b)). Portion of Venus's orbit covered by the observations is delineated by the thicker orange line. See text for details.
Download figure:
Standard image High-resolution imageThe corresponding PSP/WISPR composite observations for the two days indicated above are shown in Figure 6, displayed in a helioprojective HPLN-ARC representation. The projected orbital path of Venus is depicted with the red dots, and is seen to match the brightness enhancement (the ecliptic is delineated by the dashed line in orange, and the invariable plane by the dotted line in yellow). Above the images, along the top, we show two additional x-axes. The uppermost top x-axis displays the distance of the observer to Venus's orbit, and the lower top x-axis displays the ecliptic longitudes of the corresponding parts of the orbit in the HAE (Heliospheric Ares Ecliptic) coordinate system. Note that the brightness enhancement caused by the responsible particles is being projected onto the flat detector plane, and apparently follows the projection of the almost circular orbit of Venus. Therefore, under a preliminary assumption that the excess particle density is indeed along Venus's orbit, it appears at a varying distance from the observer depending upon the elongation of the LOS (see the uppermost top x-axis). This would cause some foreshortening at the outer edges, hence the wider, projected latitudinal extension of the feature at larger elongations (Figure 4 clearly shows this effect—compare the latitudinal extent of the region delimited by the dashed red lines at the shortest and longest elongations). On a similar line of argument, and in particular at ∼105° elongation (i.e., the maximum elongation covered by the WISPR outer telescope) the angular latitudinal width corresponding to a portion of a circumsolar ring with a projected cross section of about 0.05 au located at 0.6 au (0.53 au) from the observer is ∼48 (∼54). This explains the slightly wider and more diffuse aspect of the brightness enhancement observed on September 12 compared to August 25 (bottom and upper panels of Figure 6, respectively).
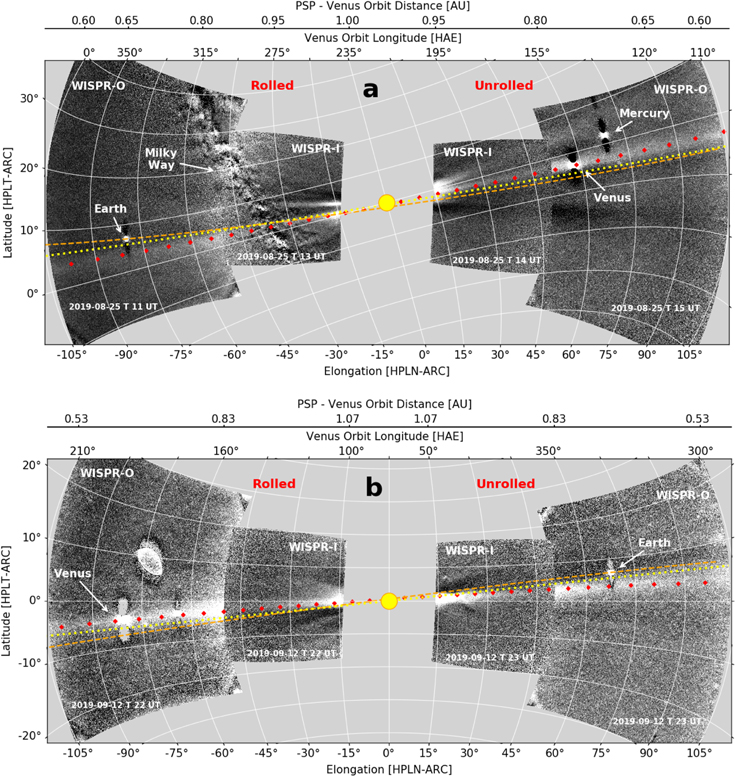
Figure 6. Combined PSP/WISPR observations of a circumsolar dust ring near Venus's orbit on August 25 (panel (a)) and September 12 (panel (b)); see also Figure 5. Images are projected onto the surface of a sphere with observer at the center (PSP S/C) and radius equal to the heliocentric distance of the observer (HPLN-ARC representation; see Calabretta & Greisen (2002) and Thompson (2006)). Sun is not to scale. Gray areas surrounding the bright point-like objects (Mercury, Venus, and Earth) are artifacts of the image processing due to the saturation caused by their excessive brightness. The odd oval-shaped object and its surrounding area are caused by reflections in the optics of the very bright Venus. Red dots delineate Venus's orbital path, dashed orange line the ecliptic, and yellow dotted line the invariable plane.
Download figure:
Standard image High-resolution image3.3. Further Evidence for a Circumsolar Feature
As a final test to check the consistency of our findings, we create a panorama covering a full 360° range using all the WISPR-I and WISPR-O (both "rolled" and "unrolled") images taken during both the inbound and outbound segments of the extended science window (see right panel of Figure 2). Toward this aim, we map each individual image into a virtual frame in the GEI system, the frame covering [−180°, 180°] in R.A. (akin to longitude) and [−60°, 60°] in decl. (akin to latitude). We then stack the individual frames and take the median.
The resulting panorama is displayed in Figure 7. The blue (red) dots delineate the projection of Venus's (Earth's) orbit. The vertical dashed–dotted lines at 764 and −1036, respectively, mark the ascending and descending nodes of Venus's orbit. The horizontal dashed lines at ±234 mark the inclination of the ecliptic with respect to the Earth equatorial plane (i.e., the obliquity of the ecliptic). The time direction of the observations is indicated by the two dates on the top axis. The beginning of the sequence starts on 2019 August 17 (the edge of the image at about 100°) and end on 2019 September 18 (edge of the image at about 80°).

Figure 7. PSP/WISPR panorama. This 360° panoramic view of the solar corona around the ecliptic is created from all PSP/WISPR images taken during this interval (rolled/unrolled, inner/outer telescopes). Blue dots delineate the orbit of Venus. Red dots depict the orbit of Earth. Horizontal red line represents the Earth's equatorial plane. Dashed blue lines give the extremes of the obliquity of the ecliptic at ±234. Dotted–dashed black lines indicate the nodes of Venus's orbital plane. The two green arrows point out the limits of the region dominated by a coronal streamer rather than by the circumsolar feature.
Download figure:
Standard image High-resolution imageThe panorama confirms the coincidence of the excess brightness feature with the projected orbital path of Venus. Note that there seems to be a slight disagreement in the excess brightness and the orbit of Venus between 40° and 80° (as pointed out by the two green arrows). This is because that range is covered in the panorama by WISPR-I images alone, the signal in the inner part of its FOV being dominated by a streamer rather than the circumsolar feature.
4. Discussion
The fortuitous S/C rolls were the key ingredients that facilitated the unveiling of a stationary brightness enhancement in both PSP/WISPR telescopes that is seen to extend all the way to the end of the WISPR-O FOV. The different S/C roll orientations allowed us to create instrumental background models with a slightly different viewing geometry with respect to that of the images of interest, therefore making it possible to reveal faint, stationary features that otherwise would have been removed after instrumental background correction.
The excess brightness in the form of a straight ray unveiled in WISPR-I images continues seamlessly into the WISPR-O frames (see, e.g., Figures 3, 4, and 6). This is reminiscent of a K-corona streamer, which results from the Thomson scattering of electrons located along a current sheet. There are, however, three difficulties with this interpretation:
- 1.The incident solar photospheric flux onto the solar wind electrons falls off as r−2 (r being heliocentric distance). No visible gradient brightness has been observed, other than at the beginning of the WISPR-I FOV, where the scene might be dominated by K-corona features (see, e.g., the upper panels of Figure 2). Note that the outer edge of the WISPR-O FOV extends to an equivalent elongation of ∼187 R☉ on August 17 (∼101 R☉ on August 27).
- 2.The locus of points along the observer's lines of sight where the electron scattering efficiency is maximum follows the so-called Thomson surface (TS; Vourlidas & Howard 2006), which is the surface of a sphere whose diameter extends from the Sun to the observer. The TS defines the location of the "plane of the sky" (POS). As the distance of PSP to the Sun decreases, the distance along any LOS where the scattering efficiency is greater than a certain threshold (e.g., one half of the maximum) also decreases (i.e., the Thomson sphere becomes smaller). Therefore, for large elongations, the POS is very localized. At larger elongations in particular, it is close to the S/C, and hence the visibility of K-corona structures at far distances from the LOS decreases significantly. This would cause additional radial variations on top of the radial fall-off variation (r−2). This is not observed (see, e.g., the bottom panels of Figure 2).
- 3.The heliospheric current sheet location is routinely estimated from the solar magnetic field observations of the Wilcox Solar Observatory using a Potential Field Source Surface 7 extrapolation (see, e.g., Hoeksema et al. 1983, and references therein). In particular, the synoptic chart (not shown here) for Carrington rotation (CR) 2221 (2019 August 23–September 19) shows that there is a noticeable excursion from the flat dipole configuration at about 280° Carrington longitude that extends from about 220° to 330°. The maximum excursion correction corresponds to about 71° ecliptic longitude (HAE), extending from about 16° to 126°. As can be seen in both panels of Figure 6, this warping is not observed.
Therefore, the excess brightness cannot be interpreted as scattering from a K-corona structure. Instead, we interpret it as a signature of scattering from a localized volume of excess dust density covering a large region in longitudinal extent but small in latitudinal extent.
An obvious question is whether the brightness enhancement detected could be an artifact generated by the particular technique employed to estimate the background brightness in the images. This is very unlikely, simply because the enhancement is present in the same heliospheric position for all of the images for both telescopes, regardless of S/C distance or pointing. Nevertheless, to investigate this issue, we applied two different, yet very simple filters to a WISPR-O (calibrated) image taken on 2019 August 24 at 14:19 UT (S/C roll angle = −697, S/C-Sun distance = 0.305 au). These filters are: (1) a Laplacian,
8
and (2) an "edge_dog"
9
filter (as implemented in IDL; Interactive Data Language
10
). Both filters are intended to enhance extended brightness inhomogeneities, such as edges. The resulting WISPR-O images (cropped to a region around the excess brightness) are shown in Figure 8. Regardless of which process is used, the excess brightness still shows up in both data products. This demonstrates that the brightness enhancement is not an artifact of the particular processing technique employed, but rather a signature of a real feature.
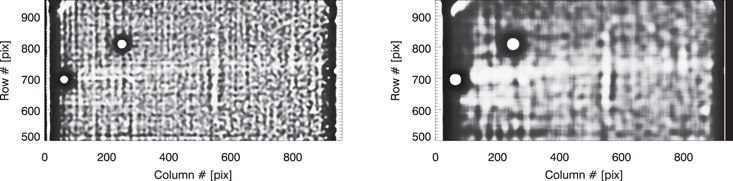
Figure 8. Snapshots showing the appearance of the brightness enhancement in a WISPR-O image processed with two straightforward image processing techniques: with a Laplacian filter in the left panel, and on the right as the difference of two low-pass (Gaussian) filtered versions of the image (with respective kernel sizes of 21 and 25 square pixels).
Download figure:
Standard image High-resolution imageTherefore, this extended, real feature is visible practically all along 360° ecliptic longitude (the only gap in coverage is between 240° and 255° longitude), hence the signature of the circumsolar dust ring. The viewing geometry only allowed for a measure of the apparent inclination and orientation of the orbital plane of the ring and projected latitudinal extension, not of the radial extension. Figure 7, in particular, shows that both the line of nodes and inclination of the orbital plane of the ring is in agreement, to first order, with those of Venus's orbit.
The PSP/WISPR observations alone do not allow the shape of the ring's cross section to be fully constrained. As we will show in Section 4.2, the projected, full width at half maximum (FWHM) average latitudinal extension is about ∼0.043 au, a value that, although slightly lower, is on the order of the projected latitudinal extension of the circumsolar dust ring near Venus's orbit observed by Helios (Leinert & Moster 2007) and STEREO Jones et al. (2013, 2017).
4.1. A Circumsolar Dust Ring: Where?
The brief analysis above showed that the excess brightness is a signature of a real feature. Moreover, as projected onto the plane of the sky, we have shown that this excess brightness is a signature of a circumsolar dust ring whose projection matches the orbital path of Venus. Thus, without further analysis, we would be tempted to claim that it is indeed a circumsolar dust ring near Venus's orbit. In the following, we will examine the possibility of other alternatives.
The PSP/WISPR images utilized in our study have all been taken from heliocentric distances <0.5 au, i.e., from within the orbit of Venus, comprising a view between about 135 and 108° elongation. Therefore, the lines of sight extend toward the outer Solar System. In the outward direction lie: (1) the circumsolar dust ring associated with Venus's orbit (e.g., Leinert & Moster 2007; Jones et al. 2013, 2017); (2) the Earth's resonant dust ring (Jackson & Zook 1989; Dermott et al. 1994; Reach et al. 1995); and (3) the asteroid dust bands (e.g., Dermott et al. 1984; Low et al. 1984; Reach et al. 1997; Nesvorný et al. 2006a, 2006b), all major dust structures (also circumsolar) whose appearance might resemble the pattern observed in our analysis.
The methodology followed is not sufficient to constrain the exact orbital parameters of the ring (such analysis is beyond the scope of the present work and will be reported elsewhere). It is worth mentioning, however, that a dust ring with orbital parameters such as those reported by Jones et al. (2013, 2017), i.e., i = 21 and ΩA
= 685, displays a projected orbital path in WISPR images that can still be considered to be matching the excess brightness band at the image resolution shown, although not as well.
Our analysis revealed an excess brightness band of the order of 1% in WISPR-O images with respect to the F-corona background, corresponding to a circumsolar feature of about 0.043 au ± 0.004 au in latitudinal extension at FWHM if at the orbit of Venus (see Section 4.2). No other band could be detected at a similar or different brightness level. A close overlap of the brightness band with the projected orbital path of a potentially associated planet/asteroid to a given circumsolar dust ring is the minimum necessary condition to claim that the excess brightness observed is its likely observational signature. All the examples shown in this work clearly show the overlapping of the projected orbital path of Venus with the brightness enhancement, Figures 6 and 7 in particular revealing the matching with Venus's projected orbit and not the ecliptic nor the invariable plane all along the ring's longitudinal extension.
Nesvorný et al. (2006b) showed that the main-belt dust bands are symmetrical with respect to the invariable plane. Although the orbital plane appears very close to the projected orbit of Venus in Figures 3 and 6, the dust band observed (signature of the circumsolar feature) is not aligned with the invariable plane. In particular, Nesvorný et al. (2006b) also showed that the dust bands originating from the Karin asteroid family exhibit a latitudinal extent of ∼42, which corresponds to about 0.2 au. To highlight the nonassociation of the dust band observed in WISPR images with such asteroidal dust bands, we display in Figure 9 a selected couple of frames from Figure 2 (WISPR-I on the left panel and WISPR-O on the right panel) with the projection of a circumsolar ring along: (1) Venus's orbit with a latitudinal extent of 0.043 au (in red color); and (2) an orbital path at the average heliocentric distance of Karin's orbit, inclination of the invariable plane, and 0.2 au latitudinal extent (in yellow color).

Figure 9. WISPR-I and WISPR-O frames on 2019 August 23 at 22:00 UT (left panel) and 2019 August 24 at 14:19 UT (right panel), respectively, with the projection of a circumsolar ring along (1) Venus's orbit, in red (latitudinal extent 0.043 au); and (2) an orbital path at an heliocentric distance of matching the average distance of Karin's orbit, in yellow (latitudinal extent of 0.2 au and inclination equal to that of the invariable plane).
Download figure:
Standard image High-resolution imageEven though PSP/WISPR is looking outward, no other brightness enhancement extending all the way to the end of view of WISPR-O is distinguishable in our images. We give here a plausibility argument as to why the dust ring associated with Earth's orbit is not visible. For instance, at 1.1 au, i.e., a reasonable, average heliocentric distance of Earth's associated dust ring (e.g., Dermott et al. 1994; Kelsall et al. 1998; Reach 2010), the local brightness of the F-corona is only about 38% of the brightness at Venus's average orbital distance, assuming a brightness falloff with heliocentric distance r−2.3 (the local dust density is about 58%, assuming a falloff r−1.3). Thus, a dust density enhancement along any LOS from the WISPR instruments would have to be much bigger than the one computed in this work (see Section 4.3) the farther away from the observer they are. For Earth's case, the reported value in the literature is only about 16% of the local dust density value of the zodiacal dust cloud (Kelsall et al. 1998), which, as we saw in the images, will not produce a discernible brightness enhancement.
A similar argument can be applied to explain the absence of the zodiacal dust bands sourced in the asteroid belt. In a direct comparison comprising only a couple of ecliptic longitudes of the asteroidal dust bands in both white light and IRAS IR intensities, Ishiguro et al. (1999) found that the relative brightness increases were below 2% above the background. Further, the location of the relative brightness maxima in the visible and IR were not necessarily at the same ecliptic latitudes. Likewise, the intensity of the relative maxima of each IR wavelength analyzed had wavelength dependence. In spite of these observational findings, we can use their measurements of the absolute white-light intensity of the band closest to the ecliptic to explain why they are not visible in our observations. Ishiguro et al. (1999) reported in their Figure 3 the absolute white-light intensity of several bands at about 1 to 4 S10 units. For a proper comparison with WISPR observations, we first convert the reported intensity of the most intense band (the one closer to the ecliptic) into MSB units (4 S10 = 1.8 × 10⁻¹⁵ MSB). Next, we choose a representative LOS in the FOV of the WISPR telescopes. For simplicity, we choose the same LOS used for the discussion in Section 4.2, i.e., at 67° elongation. (However, the reasoning and conclusion hold regardless of the elongation considered). For the S/C at about 0.3 au (a representative PSP heliocentric distance for the purposes of this argument), this LOS corresponds to an equivalent elongation of about 75 R☉ or 0.35 au (see, e.g., Stenborg et al. 2021). Therefore, since the absolute brightness of the F corona/zodiacal light at 75 R☉ is about 2.03 × 10⁻¹² MSB (as inferred from Stenborg et al. (2021)), the effect of the band is not greater than 0.09% of the background brightness; a relative increase that could be too low to be above the digitization threshold of the WISPR detectors (especially of WISPR-I).
4.2. A Circumsolar Dust Ring: Latitudinal Extension
The removal of the instrumental artifacts via the approach followed in this article affects the radiometric calibration. Therefore, to measure the relative excess brightness of the observed band and hence help establish the latitudinal extent of the dust ring, we use straight background ratio images (no instrumental background correction) that have been calibrated into physical units in order to keep the processing as simple as possible. Moreover, since the WISPR-I images are much more affected by the K-corona signal, we limited the analysis to WISPR-O data. Note that the determination of the brightness along the band, i.e., of the azimuthal density structure along the ring, is beyond the scope of this work.
A caveat of utilizing this intermediate data product is that the signal is affected by instrumental effects (e.g., row-to-row or column-to-column variations not properly accounted for by the bias correction). In addition, in the rectangular coordinates of PSP/WISPR detectors, the wide-angle optics of the telescopes introduce a certain amount of distortion or warping, which results in an apparent curvature of otherwise linear features. This is especially significant in WISPR-O, which has a much more distorted FOV. In particular, this effect will cause, e.g., a feature that is straight in reality or a structure that is moving straight (in both cases, parallel to the orbital plane of the S/C) to appear increasingly curved as it gets farther from the center of the optical system (see, e.g., the bottom panel of Figure 2).
To remove this artificial curvature and get a more accurate representation of the physical features observed, we can create a rectangular grid 11 in the Helioprojective coordinate system, in which every row and column represents a fixed latitude and elongation that covers the entire FOV of the image. Then, we can use the modeled optical properties of the detector to determine the latitude and elongation of each pixel. Using these values, the original image can be interpolated onto the rectangular grid, creating a more accurate representation of the heliosphere as a Cartesian grid. In a sense, these images can be considered "undistorted," as in these images the distortion effects caused by the optics of the instrument are accounted for.
In this new representation, the projected orbital path of Venus in WISPR-O "unrolled" images obtained, e.g., in the time period between August 23 and 27, appears as a straight line inclined ∼15 with respect to the horizontal. We remove this slight inclination by simply rotating the resulting frames by −15. We then stack all these new frames and take the median, in a similar fashion to what we did in Section 3.1. The "undistorted" median image, cropped to a region around the dust band, is displayed on the left panel of Figure 10. On the right panel, we display the median brightness (continuous black line) at each row of the cropped image. The red line delineates a Gaussian fit to the brightness profile (see Equation (1))


Figure 10. Left panel: "Undistorted" WISPR-O median snapshot (computed from the "unrolled" WISPR-O images taken between 2019 August 23 and 27) cropped to a region around the excess brightness band. Right panel: Median brightness profile (black line) and Gaussian fit (red line). See text for details.
Download figure:
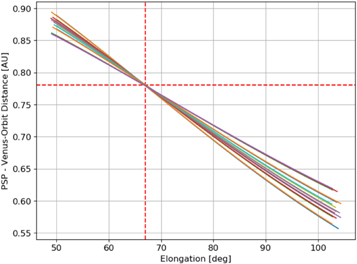
Standard image High-resolution imageThe standard error of the fit amounts to 0.1. The amplitude A0 is an estimate of the median excess brightness ΔI/I at the center of the brightness band. The FWHM of the band is 57 pixels (this extent is indicated on the left panel by the blue dashed lines), which is representative of the median latitudinal extent of the projected dust ring's cross section. To estimate the median latitudinal extent in au, we need both the median distance of the observer and the elongation of the corresponding LOS that would correspond to that distance to the portion of Venus's orbit covered by the WISPR-O FOV in the time period of interest. Figure 11 shows a plot of the PSP–Venus orbit distance as a function of LOS elongation for all the unrolled images in such a time period. We note that, for an LOS at about 67° elongation, the distance is the same regardless of the time of the observation. Therefore, we adopt 0.78 au (at 67° elongation) as the representative distance to estimate the projected latitudinal extent of the ring.
Figure 11. Distance along the LOS to the portion of Venus's orbital path at each elongation comprised by the FOV of WISPR-O observations in the "unrolled" orientation between 2019 August 23–27. Each line represents a different time instance. See text for details.
Download figure:
Standard image High-resolution image
Under these assumptions, the FWHM = 57 pixels corresponds to 0.043 au ± 0.004 au. (The error is estimated by taking into account the number of pixels the orbital path of Venus shifts in the time period comprised by the images utilized to compute the median image, i.e., 11 pixels; see Section 3.1.) For purposes that will be clearer at the end of this section, 1σ = 24.5 pixels corresponds to about 0.018 au.
4.3. A Circumsolar Dust Ring: How Dense?
The white-light F-coronal brightness can be modeled as the integration along any given LOS of the product of the dust density distribution (ρ[r, β], with r denoting the heliocentric distance and β the latitudinal displacement from the symmetry axis) and a factor related to the efficiency of the scattering at each scattering angle (hereafter Φ[θ], with θ the scattering angle). Lamy & Perrin (1986) showed that the observations from the ZLE on the Helios S/C could be modeled extremely well using an empirical Volume Scattered Function (VSF) to account for the factor Φ[θ]. The physics of the scattering process, the size and composition of the particles, the indices of refraction, etc., are all embedded in this empirical function, the Sun–particle–observer angle being its only dependence. Therefore, to compute the brightness of the F-corona, one only needs to know the dust density distribution along any given LOS. For the modeling of the zodiacal light, several dust density models have been proposed (see, e.g., Giese et al. 1986; Misconi & Rusk 1987). The main difference among these models resides in the radial and latitudinal dependency of the density distribution.
Therefore, to estimate the overdensity along the LOS due to the dust ring, if ΔI/I = 0.01, we can write
where Δρ represents the overdensity in the ring necessary to produce a relative increase in brightness of ∼1%. For simplicity, we assumed β = 0 and expressed the parameters involved as a function of the distance  along the LOS, explicitly denoting the dependence of the VSF with the scattering angle Φ through
  . The limits
  and
and  of the integral indicate the extension of the ring along the LOS.
To estimate the excess dust density necessary to produce a 1% brightness increase, we (1) assume it to be uniform in the ![$[\tilde{{r}_{0}},\tilde{{r}_{1}}]$](https://content.cld.iop.org/journals/0004-637X/910/2/157/revision2/apjabe623ieqn5.gif) interval and symmetrically distributed along the LOS from Venus's orbital path (i.e.,
interval and symmetrically distributed along the LOS from Venus's orbital path (i.e.,  constant); and (2) consider the VSF
  as defined in Lamy & Perrin (1986) (this choice is motivated by its use in reproducing the observations performed by the ZLE on the Helios spacecraft). Therefore, for our rough estimate, we can consider it constant and hence write
where C is a constant representing the approximate constant value of the scattering function in the integration range. The PSP orbit—in particular, the WISPR viewpoint from inside the orbit of Venus—only allows us to estimate the extension of the ring in the direction transverse to its plane. Therefore, to estimate the extent  of the ring along the LOS, we assume it to be similar to the extent exhibited by the latitudinal cross section measured at 2.58σ (i.e., 99% of the dust ring population along the LOS). We estimate this extent as
  ≈ 126 pixels ≈ 0.093 au (0.108 au if we consider the extent of the overdensity defined at 3σ, i.e., 99.7%). We note that, at the range supposedly covered by the density enhancement, the scattering angle θ varies from 1536 to 1574 (or 1514 to 1594 for 3σ). This range of scattering angles implies a relative variation of ±1.8% (or ±2.0% for 3σ) in the VSF between the extremes
  and
and  . Under all these assumptions, the Δρ overdensity necessary to produce a relative brightness increase of ∼1% ranges between about 8.6% and 10.8% of the local density of the smooth component of the zodiacal dust cloud, depending upon at which location the extent of the ring is defined.
As we can see, the disentanglement of the fractional contribution of the dust distribution along a given LOS is a difficult (if at all possible) process. However, both the spatial localization (Section 4.1) and restricted extension along the LOS of the dust enhancement facilitate the analysis, and under certain assumptions, allow us to constrain the excess density necessary to explain the observed excess brightness.
Theoretical modeling of resonant dust rings (e.g., Kuchner & Holman 2003), predicts an asymmetric azimuthal distribution of dust particles as well as a preceding and trailing gap in dust density following the planet. The manner in which we have analyzed the images, however, restrains us from elaborating on the analysis of the azimuthal dust density distribution, which is nevertheless beyond the scope of this work. A more detailed, quantitative analysis supported by modeling is underway and will appear elsewhere. Therefore, at this stage, we cannot elaborate on the nature of the ring, i.e., whether it is a resonant dust ring (an interpretation in agreement with, e.g., Jones et al. (2013, 2017)), or simply due to Venus's co-orbital dust particles, as in Pokorný & Kuchner (2019).
5. Conclusions and Outlook
This paper reports the first comprehensive imaging of a circumsolar dust ring formed by dust particles orbiting the Sun, apparently along Venus's orbit. These are the first pristine, comprehensive, white-light observations that made the dust ring visible in practically its whole extension (the only gap in coverage is between 240° and 255° ecliptic longitude).
In this work, we have used PSP/WISPR observations acquired during PSP's third solar encounter. The fortuitous S/C rolls along with the location of PSP inside the orbit of Venus were the key ingredients that facilitated the visualization of the ring. In particular, the former (combined with a customized image processing methodology) allowed us to create instrumental background models with a slightly different viewing geometry with respect to that of the images of interest, therefore making it possible to reveal faint, stationary features that otherwise would have been removed after instrumental background correction. The latter allowed us to view the ring from within, WISPR-O looking outward into regions of decreasing dust and electron densities. This favored the detection of a faint band of excess brightness of about 1% over the brightness of the zodiacal light, extending about 0.043 au in latitude, which we interpreted as a signature of a dust density enhancement in apparent co-orbital motion with Venus. A simple estimation showed that the ring is on the order of 10% denser than the local density of the zodiacal dust cloud, in general agreement with Leinert & Moster (2007) and Jones et al. (2013, 2017).
As previously stated, all the observations used in this work were obtained from inside Venus's orbit. Both the unique orbital path of PSP (see, e.g., http://parkersolarprobe.jhuapl.edu/) and mission operational restrictions preclude the systematic, long-term, WISPR observation of the region near Venus's orbital path from outside. The latter restricts our ability to carry out a study of similar characteristics with observations from outside the orbit comparable to what we have presented here. Such a study is necessary to address the study of the radial extension of the ring (in this work, we only analyzed the latitudinal extension). The recently launched Solar Orbiter Heliospheric Imager (SoloHI; Howard et al. 2020) investigation being carried aboard the Solar Orbiter mission (Müller et al. 2020) will ultimately go out of the ecliptic into a six-month elliptic orbit about the Sun at about 30° latitude. The perihelia will range from 0.28 to 0.5 au with aphelia between 0.72 and 1.0 au. Since it does not have the same power constraints at the orbital aphelia as PSP, SoloHI should be well-suited to make measurements of the radial extent of the dust ring.
Parker Solar Probe was designed, built, and is now operated by the Johns Hopkins Applied Physics Laboratory as part of NASA's Living with a Star (LWS) program (contract NNN06AA01C). Support from the LWS management and technical team has played a critical role in the success of the Parker Solar Probe mission. We gratefully acknowledge the efforts and dedication of Nathan Rich in operating the WISPR instrument. This work was supported by the NASA Parker Solar Probe Program Office for the WISPR program (contract NNG11EK11I).
Facility: PSP(WISPR). -
Footnotes
- 4
- 5
At the Applied Physics Lab of the Johns Hopkins University.
- 6
- 7
The corresponding source surface synoptic charts can be found at http://wso.stanford.edu/synsourcel.html.
- 8
The Laplacian operator is defined as the the divergence of the gradient.
- 9
Difference of two Gaussian filters.
- 10
- 11
The virtual frame created is 1000 pixels2 with an effective pixel scale of 0
06.