


Abstract
Observations at intermediate redshifts reveal the presence of numerous compact, weak Mg ii absorbers with near to supersolar metallicities, often surrounded by extended regions that produce C iv and/or O vi absorption, in the circumgalactic medium at large impact parameters from luminous galaxies. Their origin and nature remain unclear. We hypothesize that undetected satellite dwarf galaxies are responsible for producing some of these weak Mg ii absorbers. We test our hypothesis using gas dynamical simulations of galactic outflows from a dwarf galaxy with a halo mass of 5 × 10⁹ M⊙, as might be falling into a larger L* halo at z = 2. We find that thin, filamentary, weak Mg ii absorbers (≲100 pc) are produced in two stages: (1) when shocked core-collapse supernova (SN II)–enriched gas descending in a galactic fountain gets shock compressed by upward flows driven by subsequent SN II and cools (phase 1) and, later, (2) during an outflow driven by Type Ia supernovae that shocks and sweeps up pervasive SN II–enriched gas, which then cools (phase 2). The Mg ii absorbers in our simulations are continuously generated by shocks and cooling with moderate metallicity ∼0.1–0.2 Z⊙ but low column density <1012 cm−2. They are also surrounded by larger (0.5–1 kpc) C iv absorbers that seem to survive longer. Larger-scale (>1 kpc) C iv and O vi clouds are also produced in both expanding and shocked SN II–enriched gas. Observable ion distributions from our models appear well converged at our standard resolution (12.8 pc). Our simulation highlights the possibility of dwarf galactic outflows producing highly enriched multiphase gas.
Export citation and abstract BibTeX RIS
1. Introduction
Galactic outflows appear to regulate the structure and evolution of galaxies, as they heat, ionize, and chemically enrich the surrounding circumgalactic medium (CGM) and even drive unbound winds that can reach the intergalactic medium (IGM; see, e.g., Somerville & Davé 2015; Heckman 2017, for reviews). A robust understanding of the stellar feedback processes driving these outflows, however, remains elusive. The observed properties of the outflows and outflow–CGM interaction at multiple wavelengths must be used to constrain theoretical models of the physics governing the outflows and outflow–CGM interaction. The most prominent observed properties are metal absorption lines, seen in the spectra of background quasars, that are believed to arise from inhomogeneities in the CGM. Numerical simulations are required to predict and interpret the observational signatures of these systems (e.g., Oppenheimer et al. 2012; Suresh et al. 2015; Keating et al. 2016; Turner et al. 2017; Oppenheimer et al. 2018; Peeples et al. 2019).
Analysis of metal absorption line observations reveals the presence of numerous compact (1–100 pc), low-ionization gas clouds traced by weak Mg ii lines ( 0.3 Å), often associated with larger (0.5–1 kpc) regions of higher-ionization gas traced by C iv and O vi lines in the halos of L* galaxies at intermediate redshifts of 1 ≲ z ≲ 2.5 (Rigby et al. 2002; Charlton et al. 2003; Simcoe et al. 2004; Milutinovic et al. 2006; Lynch & Charlton 2007; Schaye et al. 2007; Misawa et al. 2008; Narayanan et al. 2008; Turner et al. 2014, 2015; D'Odorico et al. 2016; Lehner et al. 2016; Muzahid et al. 2018). The derived metallicities of weak Mg ii absorbers are almost always greater than 10% solar and often as high or even higher than the solar value, even though luminous or poststarburst galaxies are rarely found within a 50 kpc impact parameter. Some of them are even iron-enhanced compared with solar (Rigby et al. 2002; Charlton et al. 2003; Lynch & Charlton 2007; Misawa et al. 2008; Narayanan et al. 2008).
Weak Mg ii systems are optically thin in neutral hydrogen and produce metal lines that are relatively narrow, with Doppler parameter b < 10 km s−1 (Churchill et al. 1999; Narayanan et al. 2008). With the observed high metallicity (>0.1 Z⊙), they are usually associated with sub-Lyman limit systems (sub-LLSs) with NH ii < 1017 cm−2.
In addition, analyses of low-redshift absorbers show that there are fewer absorbers at present than in the past (Muzahid et al. 2018). Galactic outflows carry metals and are less active in the modern universe, but the absence of star-forming or poststarburst galaxies nearby, together with all of the measured properties above, suggests that galactic outflows from dwarf satellite galaxies may produce some of the weak Mg ii absorbers. This hypothesis is supported by several observations. First, weaker Mg ii absorbers at larger impact parameters are symmetrically distributed, while strong Mg ii absorbers at impact parameters <35 kpc are commonly observed along the minor axis (Bordoloi et al. 2014). Second, spatially extended line-emitting nebulae on scales of up to 100 proper kpc, not associated with any detected galaxies, are found in galaxy groups around active galactic nuclei (Epinat et al. 2018; Johnson et al. 2018).
The covering fraction of the weak absorbers is estimated to be ≳30% in the CGM of galaxies brighter than 0.001L*(Narayanan et al. 2008; Muzahid et al. 2018). There would be on the order of a million tiny, weak absorbers per galaxy if a spherical geometry were assumed (Rigby et al. 2002). It has been argued, however, that weak absorbers instead reside in filamentary and sheetlike structures (Milutinovic et al. 2006).
Many of these systems show absorption by multiple high-ionization species at the same velocity, often with additional components offset by 5–150 km s−1 (Milutinovic et al. 2006). It has been suggested by C iv surveys at z ≈ 2 ∼ 3 in the environments of sub-LLSs that C iv clouds are more diffuse (nH ii ∼ 10−4–10−3 cm−3) and larger than Mg ii clouds, with sizes between 0.1 and 10 kpc (Simcoe et al. 2004; Schaye et al. 2007; Lehner et al. 2016). Some of the C iv clouds may have expanded from denser, more compact Mg ii clouds (Schaye et al. 2007). These C iv systems may be interpreted as being in photoionization equilibrium at T ∼ 104 K, and their metallicities are found to be ∼1% solar to even solar or more (Simcoe et al. 2004; Schaye et al. 2007; Lehner et al. 2016). There are also many O vi absorption systems, which are more likely to have an origin in photoionized gas (rather than collisionally ionized gas) at z ∼ 2 due to the greater intensity of the extragalactic background radiation. The detections of O vi by Turner et al. (2014, 2015), however, suggest the presence of a collisionally ionized gas phase for impact parameters ≲100 proper kpc of large, star-forming galaxies at z ∼ 2.4.
We specifically choose a dwarf galaxy for our study, as we want to test the hypothesis that galactic outflows from undetected dwarf satellite galaxies are responsible for producing some of the observed weak Mg ii absorbers in halos of larger, passive L* galaxies at intermediate redshift. By contrast, recent work on cooling multiphase outflows from galaxies has focused on substantially more massive galaxies with halo masses exceeding 5 × 10¹⁰ M⊙ to Milky Way mass (Sarkar et al. 2015; Fielding et al. 2017; Schneider & Robertson 2018; Schneider et al. 2020).
The bursty nature of star formation is observed in dwarf galaxies at z = 0–2 and even at higher redshift, z ≳ 3, often with multiple episodes of starbursts (Anders & de Grijs 2004; McQuinn et al. 2009, 2010; Tolstoy et al. 2009; Atek et al. 2014; Simon 2019). The starburst duration seems to be long, ≳0.5 Gyr in local dwarf galaxies (McQuinn et al. 2009, 2010), and multiple starbursts are observed in satellite dwarf spheroidal galaxies over cosmic time (≳a few gigayears) depending on the orbits around their host galaxy in the Local Group (Nichols et al. 2012).
We note that we are not placing our dwarf galaxy in the CGM of a host galaxy or its gravitational potential. Although halo pressure from a host galaxy can be dynamically important, we show later that the thermal pressure of a supernova (SN)-driven outflow is greater than the characteristic halo gas pressure of a host galaxy, ∼10−14 dyn cm−2 at z = 2 (Tvir = 105−6 K; Fujita et al. 2004), and the pressure depends on the location of the satellite galaxy and possibly its orbit in and around the halo (Meiksin et al. 2015). The pressure from the halo of a massive galaxy may have some dynamical importance at late stages, but in this paper, we try to clarify the role of radiatively cooling galactic outflows in a dwarf galaxy in generating weak Mg ii clouds surrounded by C iv and O vi clouds in the absence of host halo pressure. We will consider nonnegligible external pressure in a subsequent paper.
There are other physical mechanisms that may produce weak Mg ii absorbers in larger halos where active star formation is absent, such as condensation in the hot corona and ram pressure stripping of dwarf satellite galaxies. For example, the analyses of two high-metallicity, weak Mg ii absorbers and stronger absorbers in the halos of massive luminous red galaxies suggest their origin through condensation in the hot corona (Thom et al. 2012; Prochaska et al. 2017; Chen et al. 2018, 2019; Zahedy et al. 2018; Berg et al. 2019; Fossati et al. 2019; Nelson et al. 2020). On the other hand, the analyses of strong Mg ii absorbers in halos of star-forming galaxies, particularly in group environments, suggest their origin in tidally stripped gas from nearby galaxies or ram pressure stripped gas through the intragroup corona (Chen et al. 2014; Nielsen et al. 2018; Dutta et al. 2020), so ram pressure stripping of dwarf satellite galaxies moving through the host halo is also an intriguing idea.
In this paper, we focus on testing our hypothesis that galactic outflows from satellite dwarf galaxies, too dim to detect in the halo of a larger L* galaxy, produce compact weak Mg ii absorbers surrounded by larger regions that produce C iv and O vi absorption. Using a small-scale hydrodynamical simulation of a dwarf galaxy, we find that such structures are produced by repeated shocks and radiative cooling in the gaseous halo of the galaxy. We will highlight the important physical processes at work that regulate the production of low- and high-ionization clouds, to be explored in larger-scale simulations in the next paper.
We describe our numerical method in Section 2 and the dynamics of Type II (SN II) and Type Ia supernova (SN Ia)–driven outflows and their interaction with surrounding gas, including the production of dense clumps and filaments, in Section 3. In Section 4, we study the distributions of weak Mg ii absorbers and surrounding C iv and O vi absorbers in our simulation and compare them to the properties of observed systems, followed by a resolution study (Section 5) and a summary (Section 6).
2. Numerical Method
We use the adaptive mesh refinement hydrodynamics code Enzo (Bryan et al. 2014) to simulate repeated SN explosions in the disk of a dwarf galaxy. We solve the equations of hydrodynamics using a direct Eulerian piecewise parabolic method (Colella & Woodward 1984; Bryan et al. 2014) and a two-shock approximate Riemann solver with progressive fallback to more diffusive Riemann solvers in the event that higher-order methods produce negative densities or energies. Our simulation box has the dimensions (Lx , Ly , Lz ) = (6.5536, 6.5536, 32.768) kpc, initially with (32, 32, 160) cells. Only half the galactic disk above its midplane is simulated. We refine cells to resolve shocks with a standard minimum pressure jump condition (Colella & Woodward 1984) and resolve cooling at turbulent interfaces where the sound-crossing time exceeds the cooling time. We use four refinement levels, resulting in a highest resolution of 12.8 pc (standard simulation). We also ran the same simulation with three refinement levels as a comparative resolution study (low-res simulation) and by applying six refinement levels in a region where Mg ii filaments form in order to test the effects of resolution on fragmentation (high-res zoom simulation). We assume a flat ΛCDM cosmology with the 2018 Planck Collaboration measured parameters Ωm = 0.315, ΩΛ = 0.685, h = 0.674, and Ωb = 0.0493 (Planck Collaboration et al. 2020a, 2020b).
2.1. Galaxy Model
We model a dwarf galaxy at redshift z = 2 with a halo mass Mhalo = 4 × 10⁹ M⊙ and a virial radius Rvir = 17.3 kpc. This model has a disk gas mass Mg = 5.2 × 10⁸ M⊙. We adopt a Burkert (1995) dark matter potential with a core radius r0 = 848 pc and central density ρ0 = 1.93 × 10⁻²³ g cm−3, although this potential profile is a fit to the observed rotation curves of nearby dwarf galaxies rather than those at z = 2. Our choice of r0 and ρ0 ensures that the resulting potential profile reproduces a Navarro et al. (1997) dark matter potential with c = 12.2 for the same dwarf halo at r > 400 pc. The gas is described as a softened exponential disk,

where Mg is the total mass of gas in the disk, and ag and bg are the radial and vertical gas disk scale heights (Tonnesen & Bryan 2009). We chose ag = 621 pc based on the exponential disk approximation of Mo et al. (1998) with λ = 0.05 and bg = 160 pc based on the thin disk approximation (Toomre 1963) with an effective sound speed cs,eff = 11.3 km s−1 (Fujita et al. 2009). Given this gas density distribution in the disk, the gas temperature and pressure are calculated to maintain the disk in hydrostatic equilibrium with the surrounding halo potential in the z-direction, and the rotational velocity of the gas disk is set to balance the radial gravitational force and the pressure gradient. The disk temperature varies between 103 and a few × 104 K, and the maximum circular velocity is  km s−1 with the escape velocity from the potential vesc = 69.0 km s−1. Our model galaxy is placed in a static halo background with ρbg = 1.83 × 10⁻²⁸ g cm−3 so that the gas mass within the virial radius is Mhalo(Ωb/Ωm). The metallicity is initially set to a uniform value of Z = 0.001 with a mean molecular weight μ = 0.6. The gas-phase metallicity for a galaxy with stellar mass M* ∼ 105−7
M⊙ is estimated to be 0.01–0.05 Z⊙ based on 25 nearby dwarf irregulars (Lee et al. 2006) and is predicted to be 0.04–0.02 Z⊙ at z = 2 based on the galaxy mass–metallicity relations studied in cosmological simulations (Ma et al. 2015). We chose a very low metallicity as an initial condition to delineate the effects of metal contribution by our simulated starburst alone.
km s−1 with the escape velocity from the potential vesc = 69.0 km s−1. Our model galaxy is placed in a static halo background with ρbg = 1.83 × 10⁻²⁸ g cm−3 so that the gas mass within the virial radius is Mhalo(Ωb/Ωm). The metallicity is initially set to a uniform value of Z = 0.001 with a mean molecular weight μ = 0.6. The gas-phase metallicity for a galaxy with stellar mass M* ∼ 105−7
M⊙ is estimated to be 0.01–0.05 Z⊙ based on 25 nearby dwarf irregulars (Lee et al. 2006) and is predicted to be 0.04–0.02 Z⊙ at z = 2 based on the galaxy mass–metallicity relations studied in cosmological simulations (Ma et al. 2015). We chose a very low metallicity as an initial condition to delineate the effects of metal contribution by our simulated starburst alone.
2.2. Cooling
Figure 1 shows the cooling curves used in our simulations. We use radiative cooling curves as a function of temperature above 104 K for gas in collisional ionization equilibrium with various metallicities: [Fe/H] = −3, −2, −1.5, −1, −0.5, 0, and +0.5 (Sutherland & Dopita 1993). A radiative cooling rate for gas in a cell with a metallicity is computed by interpolating between the cooling curves. Cooling of gas below 104 K is approximated with the cooling curve of Rosen & Bregman (1995) computed for solar metallicity. Although, for example, Maio et al. (2007) showed that the cooling rate stays approximately the same between 103 and 104 K for gas with a metallicity below Z = 10−3, we justify the simplification below 104 K by noting that cooling below 104 K has a negligible effect on the formation and fragmentation of dense clouds, as cooling in shocked gas and turbulent mixing layers is limited by numerical resolution rather than radiative cooling (Fujita et al. 2009; Gronke & Oh 2018, 2020). We justify the assumption of collisional ionization equilibrium because past simulations show that the effects of nonequilibrium ionization do not boost high ion distributions much, even in shocked coronal gas (Kwak & Shelton 2010; Armillotta et al. 2016; Cottle et al. 2018). We do not include the effects of metagalactic UV background radiation in our simulation, but we incorporate it when we postprocess the simulations to compute the ion distributions (see Section 4). The modification of the ionization fraction by a UV background would affect only the lower-density gas that does not dominate the cooling.

Figure 1. Radiative cooling functions used in our simulations as a function of temperature T from Sutherland & Dopita (1993) for T ≥ 104 K for different metallicities and Rosen & Bregman (1995) for T < 104 K for solar metallicity.
Download figure:
Standard image High-resolution image2.3. Starburst
In our study, we set up an instantaneous starburst of stellar mass 107
M⊙ at the disk center. We assume this mass corresponds to ∼14% of the total stellar mass that could be produced in the future based on the stellar-to-halo mass relation for low-mass galaxies at z < 1 (Miller et al. 2014). We intend to model a single starburst event at an earlier stage of the history of the dwarf galaxy with a very low initial gas-phase metallicity of 10−3
Z⊙. We use Stellar Yields for Galactic Modeling Applications (SYGMA; Ritter et al. 2018) to model the chemical ejecta and feedback from simple stellar populations. SYGMA is part of the open-source chemical evolution NuGrid framework (NuPyCEE).
7
We compute the average mechanical luminosities and metal ejection rates for MSSP = 107
M⊙. They are LSN II = 3.5 × 1041 erg s−1 and  M⊙ yr−1 for the initial 40 Myr, which is the lifetime of the smallest B star to go core-collapse SN II, and LSN Ia = 7 × 1038 erg s−1 and
  M⊙ yr−1 at times ≥40 Myr powered by SN Ia. The metals produced by SN II and Ia are followed and advected separately.
To drive a constant-luminosity outflow, during every time step Δt, we add mass ( ) and energy (LSN IIΔt and LSN IaΔt) to a spherical source region with a radius of 102.4 pc. We choose to increase the amount of mass added from the SYGMA values to ensure that the temperature of the hot gas in the outflows is 108 K, which is far from the peak of the cooling curve at ∼105 K but well below the value implied by only accounting for the ejecta. This additional mass accounts for the mass evaporated off the swept-up shells in the absence of an implementation of thermal heat conduction. Therefore, we use
  M⊙ yr−1 for the SN II–driven outflow and 2.1 × 10⁻⁴
M⊙ yr−1 for the SN Ia–driven outflow. Metals produced by SN II and Ia are separately traced in our simulations, but the fractions of elements are computed from the bulk metallicity field, assuming solar abundances. The total mass added for 1 Gyr is only 4.3 × 10⁶
M⊙, which is less than 1% of Mdisk.
M⊙ yr−1 for the SN II–driven outflow and 2.1 × 10⁻⁴
M⊙ yr−1 for the SN Ia–driven outflow. Metals produced by SN II and Ia are separately traced in our simulations, but the fractions of elements are computed from the bulk metallicity field, assuming solar abundances. The total mass added for 1 Gyr is only 4.3 × 10⁶
M⊙, which is less than 1% of Mdisk.
2.4. Ion Analysis
We use the TRIDENT analysis tool (Hummels et al. 2017) to calculate the ionization fractions of the species of interest based on the cell-by-cell density, temperature, and metallicity. First, the estimation for the number density of an element X is

where Z is the metallicity from the simulation, and  is the solar abundance by number. Ionization fractions are precalculated over a grid of temperature, density, and redshift in photoionization equilibrium with the metagalactic UV background radiation by Haardt & Madau (2012) coupled with collisional ionization, using the photoionization software CLOUDY (Ferland et al. 2013). Thus, by linearly interpolating over the precalculated grid, TRIDENT returns the density of an ion, i, of an element, X, as

where  is the ionization fraction of the ith ion.
To generate an absorption profile along a ray through the simulation box, the absorption produced by each grid cell is represented by a single Voigt profile at its instantaneous velocity v, with a Doppler b parameter specified by the temperature in the cell.
We are not computing the effects of UVB radiation in our simulations, so some gas tends to overcool to a lower temperature, ≲104 K. We show later that this overcooled, low-density (≤10−4 cm−3) gas contributes very little to the total ion budgets. In addition, denser clouds that produce Mg ii absorbers have nH ≳ 5 × 10⁻³ cm−3, which is comparable or greater than the self-shielding density threshold at z = 2 (6.1 × 10⁻³ cm−3) calculated by Rahmati et al. (2013). Thus, most of our weak Mg ii absorbers are likely to be self-shielded to the surrounding UVB radiation, and overcooling will not significantly affect our analysis (see the Appendix). We also assume that dust depletion of gas-phase magnesium is not important, since the neutral hydrogen column density of weak Mg ii systems in our sample ( ) is not large enough to make dust reddening remarkable even if we consider their relatively high metallicity (e.g., Kaplan et al. 2010).
3. Results
Figure 2 shows density, temperature, pressure, total velocity, and metallicity slices along the y–z plane at the disk center and a neutral hydrogen column density distribution along the x-axis in the y–z plane at t = 40 Myr. The H i distribution is calculated with TRIDENT.

Figure 2. Sliced density, temperature, pressure, velocity magnitude, and metallicity (left to right) distributions and a projected hydrogen column density distribution along the x-axis (rightmost) of the SN II–driven outflow at the box center (y–z plane) when the last SN II goes off at t = 40 Myr. The fourth panel denotes regions (a) expanding SN II–enriched gas, (b) shocked SN II–enriched gas, (c) swept-up CGM, and (d) ambient CGM.
Download figure:
Standard image High-resolution imageThe swept-up shell driven by repeated SN II explosions cools quickly due to its high density. Because it is expanding into a stratified atmosphere, it accelerates and fragments into multiple clumps and shells due to the Rayleigh–Taylor (RT) instability. Figure 2 shows that the hot, thermalized interior gas expands freely through the fragments. This occurs in any dense, accelerating shell, where the high-pressure interior gas overtakes the dense shell and expands beyond it (Mac Low et al. 1989). This outflow continues to expand to shock the CGM, and a classic superbubble (Weaver et al. 1977; McCray & Kafatos 1987) forms in the CGM, as seen in Figure 2, where region (a) is the expanding SN II–enriched gas at v ∼ 400–1000 km s−1; region (b) is the shocked, pressurized SN II–enriched gas at P ≳ 10−13 dyn cm−2; region (c) is the swept-up CGM shell, which is low density because of the low ambient density being swept up; and region (d) is the ambient CGM beyond the outer shock front at z ∼ 17 kpc. Expanding SN II–enriched gas and shocked SN II–enriched gas are divided at the inner shock front at z ∼ 12 kpc, and shocked SN II–enriched gas extends out to a contact discontinuity with the CGM. Note that the pressure of the shocked SN II–enriched gas that drives the outflow to the halo is greater than the characteristic halo gas pressure of a host galaxy, ∼10−14 dyn cm−2 at z = 2.
In our simulations, the high-density, low-temperature fragments of swept-up interstellar medium (ISM) material are not resolved after t = 40 Myr with our refinement criteria of strong pressure gradients or the sound-crossing time exceeding the cooling time. The survival and growth of these fragments ultimately depends in detail on the magnetic field structure of the wind, as well as its cooling time (McCourt et al. 2015; Armillott et al. 2017; Gronke & Oh 2018; Li et al. 2020; Sparre et al. 2020). They correspond to observed Lyman limit systems (LLSs) and subdamped Lyα absorbers (DLAs) with NH ii ≳ 1018−20 cm−2 that will likely produce strong Mg ii absorbers (see rightmost panel in Figure 2). However, the focus of this study is instead on weak Mg ii absorbers that are observed to be associated with sub-LLSs with NH ii < 1017 cm−2. These unresolved swept-up ISM fragments in the outflow quickly mix with the surrounding hot, metal-enriched gas, but the total amount of disk gas mixed in the outflow is only 3%–5% of the disk mass initially placed on the grid. We also note that the powerful SN II–driven outflow leaves the box starting at t ∼ 20 Myr; by t = 40–300 Myr, 38%–58% of the metal-carrying gas has left the box.
After the last SN II goes off at t = 40 Myr, SN Ia drive the outflow but with a mechanical luminosity that is more than 2 orders of magnitude smaller. The SN Ia–enriched gas expands at v ∼ 400 km s−1 through the tunnel created by the previous SN II outflow, but by t ∼ 80 Myr, the disk gas being pushed aside by the SN II outflow flows back to the central source region, blocking the passage for SN Ia–enriched gas. Meanwhile, the shocked SN II–enriched gas (region (b)) near the inner shock front (z ∼ 12 kpc) begins to descend toward the disk, while the outer shock front (the outer edge of region (c)) keeps moving at v ∼ 400 km s−1 in the CGM and soon leaves the box. By t ∼ 100 Myr, descending shocked SN II–enriched gas accumulates at the inner shock front and cools to form denser, cool shells that eventually fragment by RT instability.
The sliced density distribution in the y–z plane at x = +1.42 kpc from the disk center at t = 160 Myr (left panel in Figure 3) shows the formation of such fragments in the form of clumps and filaments. They are also visible as clumps and filaments in a projected distribution of neutral hydrogen along the x-axis at t = 160 Myr (left panel in Figure 4). These clumps and filaments will potentially produce weak Mg ii absorbers (we discuss our ion analysis in the next section). We call this process phase 1 formation. They are made of SN II–enriched outflow gas, and their metallicity is ∼0.1–0.2 Z⊙. The size of the clumps and the thickness of the filaments are ∼100 pc. This size may be limited by our numerical resolution of 12.8 pc (Fujita et al. 2009; Gronke & Oh 2018). We discuss the effects of resolution further in Section 5.
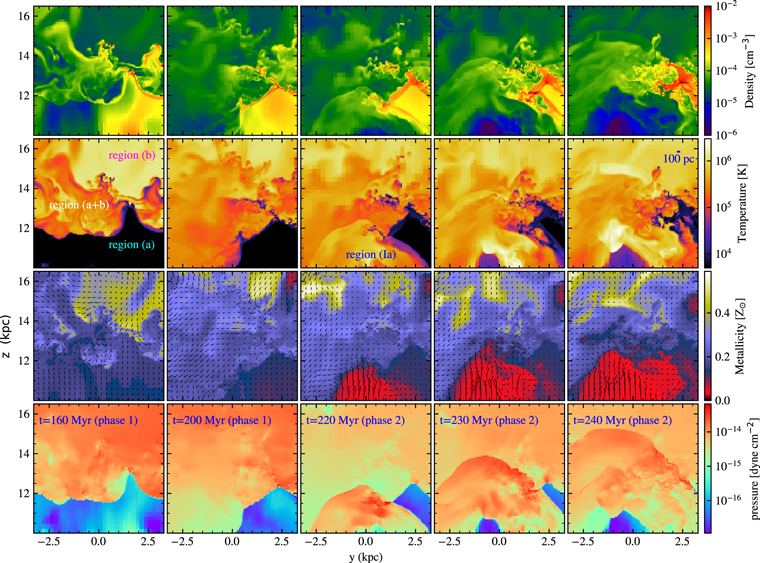
Figure 3. Sliced density, temperature, metallicity, and pressure (from top to bottom) distributions of cool, dense clouds at x = +1.42 kpc from the disk center in the y–z plane at phase 1 (t = 160 and 200 Myr) and phase 2 (t = 220, 230, and 240 Myr) from left to right. Phase 1 formation begins when descending shocked SN II–enriched gas (region (b)) collides with the expanding SN II–enriched gas (region (a)) at the inner shock front, and phase 2 formation begins when SN Ia–driven outflow (region (Ia)) rams into the rest of the SN II–enriched gas and the clouds made at phase 1. The arrows in the third row show the direction of gas flow with  km s−1.
Download figure:
Standard image High-resolution image
Figure 4. Projected neutral hydrogen distributions at t = 160 (left), 200 (middle), and 240 Myr (right) along the x-axis in the y–z plane. The SN Ia–driven outflow is visible as a cavity (region (Ia)).
Download figure:
Standard image High-resolution imageShortly after t = 160 Myr, a superbubble created by repeated SN Ia explosions blows out of the dense ISM and the SN Ia–enriched gas regains a tunnel for expansion, forming an SN Ia–driven outflow traveling at v ∼ 400–500 km s−1. In the projected distribution of neutral hydrogen at t = 200 Myr (middle panel in Figure 4), fragments of swept-up ISM after blowout are visible framing a tunnel for outflow, and hot, low-density SN Ia–enriched gas in the outflow is seen as a cavity with NH ii ≲ 1013 cm−2 (we define SN Ia–enriched gas as region (Ia)).
By t = 220 Myr, this SN Ia–driven outflow (region (Ia)) expands into the cooled SN II–enriched gas and the clumps and filaments of shocked SN II–enriched gas (region (b)), shocking and sweeping them and forming more clumps and filaments. Figure 3 clearly shows such a process in a selected region at z > 10 kpc. These are potential candidates for weak Mg ii absorbers, too; we call this process phase 2 formation. Their metallicity and size are likewise ∼0.1–0.2 Z⊙ and ∼100 pc. Hotter and lower-density shocked SN II–enriched gas extends above z ∼ 14 kpc with Z ∼ 0.4–1 Z⊙.
The pressure surrounding the clumps and filaments is ≲10−14 dyn cm−2, the characteristic halo gas pressure of a host galaxy at z = 2. Thus, the pressure from the halo of a massive galaxy may have some dynamical importance at these late stages, although it does not seem so important for the initial stage following the starburst (Figure 2). We will study the effects of host halo pressure in our next planned simulation.
The SN Ia–driven outflow continues to shock and sweep gas, as well as clumps and filaments, to the sides, and by t ∼ 300 Myr, all of the clumps and filaments, as well as 58% of the SN II outflow gas and 8% of the SN Ia outflow gas, have left the box. Then, there is only very low density gas with nH < 10−4 cm−3 left above the disk in the box. The metallicity of SN Ia–enriched gas is Z ≪ 0.1 Z⊙, as the metal production rate is about 2 orders of magnitude smaller than that of SN II, so it is still too early for any significant enrichment by SN Ia. We stopped computing at t ∼ 450 Myr.
With a realistic star formation history with multiple star clusters scattered in time and place, we expect phase 1 and 2 formation to be repeated in time and place to produce more clumps and filaments. We will test this scenario in a larger simulation box in our next paper.
4. Weak Mg ii Absorbers and C iv/O vi Absorbers
4.1. Overview
Figure 5 shows projected density distributions of Mg ii, C iv, and O vi ions along the x-axis in the y–z plane at t = 160, 200, and 240 Myr, when weak Mg ii absorbers associated with sub-LLSs with NH ii < 1017 cm−2 begin to form. Figure 6 shows sliced density, temperature, metallicity, Mg ii, C iv, and O vi ion density distributions at x = +1.92 kpc from the disk center in the y–z plane at t = 200 Myr. This sight line was selected as an example with a large path length through low-ionization gas.

Figure 5. Projected Mg ii (top), C iv (middle), and O vi density (bottom) distributions at t = 160 (left), 200 (middle), and 240 Myr (right) along the x-axis in the y–z plane.
Download figure:
Standard image High-resolution image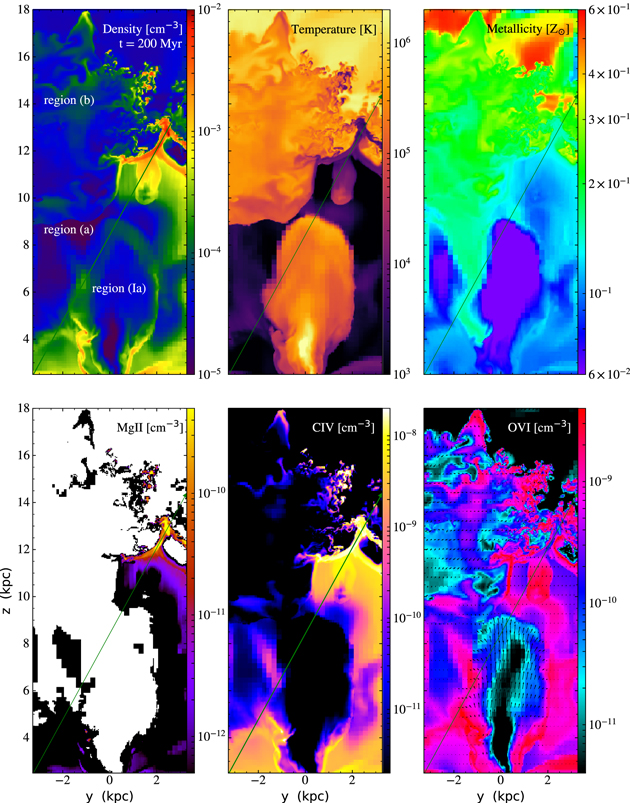
Figure 6. Sliced density, temperature, and metallicity (top row, left to right), and Mg ii, C iv, and O vi (bottom row, left to right) density distributions at x = +1.92 kpc from the disk center in the y–z plane at t = 200 Myr. A line of sight from [x, y, z] = [+1.92, −3.28, +2.45 kpc] to [+1.92, +3.28, +14.4 kpc] is shown by a green line. The arrows in the bottom right panel show the direction of the gas flow with vmax = 353 km s−1.
Download figure:
Standard image High-resolution imageThe clumps and filaments have hydrogen number densities nH = 10−3–10−2 cm−3 and sizes/thicknesses of ∼100 pc, which is the smallest scale our simulation can resolve, as discussed in Section 3. Visual inspection of image sequences shows that individual weak Mg ii absorbers survive for ∼60 Myr before they are mixed and diluted with the surrounding warmer, lower-density gas, but they are continuously produced through phase 1 to phase 2 formation for over 150 Myr from a single instantaneous starburst source. Weak Mg ii absorption with NMg II > 1011 cm−2 is also found in a blob of gas that carries a swept-up ISM shell fragment in the expanding SN II–enriched gas seen at, e.g., [y, z] = [+2, 10 kpc] (see top left panel in Figure 5) and in fragmented shells of ISM swept up by the SN Ia–driven outflow at, e.g., z = 2–4 kpc (see top middle panel in Figure 5). The blob has cooled slowly without fragmentation, and its size is about a kiloparsec. It is expanding into the phase 1 shells in region (b) above, but the SN Ia–driven outflow will shock and sweep up expanding SN II–enriched gas, including the blob in region (a) and the phase 1 shells in region (b), to produce phase 2 shells and fragments (see top right panel in Figure 5).
Higher ion absorbers are found in region (a), where expanding SN II–enriched gas cools, and region (b), where shocked SN II–enriched gas cools in phases 1 and 2. In both cases, the hydrogen number density of the absorbers is nH ∼ a few × 10−4 cm−3, but the absorbers in region (a) extend over 1–4 kpc, while the absorbers in region (b) are smaller, 500 pc–1 kpc. The sizes of the high ion absorbers agree with the observed estimates for C iv absorbers by Misawa et al. (2008) and Schaye et al. (2007). They are ∼100 pc–5 kpc in a sub-LLS (1014.5 cm−2 < NH ii < 1016 cm−2) or Lyα forest environment (NH ii < 1014.5 cm−2).
The C iv absorbers in region (b) are clumpy and filamentary, and some surround weak Mg ii absorbers, so both of them arise from the same clumps and filaments created in phase 1 and 2 formation. However, C iv ions in these clumps and filaments survive longer than Mg ii ions by another 20–30 Myr based on visual inspection of image sequences. Our simulations suggest that clouds that produce Mg ii absorbers also produce C iv absorbers, and Mg ii absorbers probe the densest parts of the clouds while C iv absorbers extend out to more diffuse, larger regions. In the process of mixing, the regions that produce Mg ii absorption disappear first due to dilution, so our simulations agree with a picture proposed by Schaye et al. (2007) that expanding Mg ii absorbers with high metallicity (Z ≲ Z⊙) produce C iv absorbers.
We find that 1%–3% of high ions by mass are from collisional ionization by comparison with the ion fractions computed without background radiation; they are found in coronal O vi absorbers in region (b). This is consistent with observational analyses showing that photoionization dominates in sub-LLS and Lyα forest environments at intermediate to high redshift (e.g., Simcoe et al. 2004; Schaye et al. 2007; Lehner et al. 2016).
Figure 7 shows physical values along a line of sight through the simulation box, which is noted in green in Figure 6, and Figure 8 shows mock spectra created along the sight line with TRIDENT, convolved with an instrumental line-spread function (resolving power R = 45,000) consistent with Misawa et al. (2008). Noise is not added, as our purpose is to demonstrate that the observed and simulated spectra qualitatively resemble each other by comparing appearances (i.e., strength and profiles), not to reproduce them quantitatively. As an example of the observed spectra, we choose the weak Mg ii system at z = 1.75570 toward HE 2243–6031 (system 3) in Misawa et al. (2008), since the system has the largest  , with an absorption depth almost comparable to the simulated one. For a full comparison, we need larger samples of both observed and simulated spectra, which we will pursue in future work.

Figure 7. Hydrogen density (top left), sight-line velocity (top middle), temperature (top right), Mg ii density (bottom left), C iv density (bottom middle), and O vi density (bottom right) distributions along the line of sight from [x, y, z] = [+1.92, 0, 2.45 kpc] to [+1.92, 6.55, 14.4 kpc] (green line in Figure 6) at t = 200 Myr.
Download figure:
Standard image High-resolution image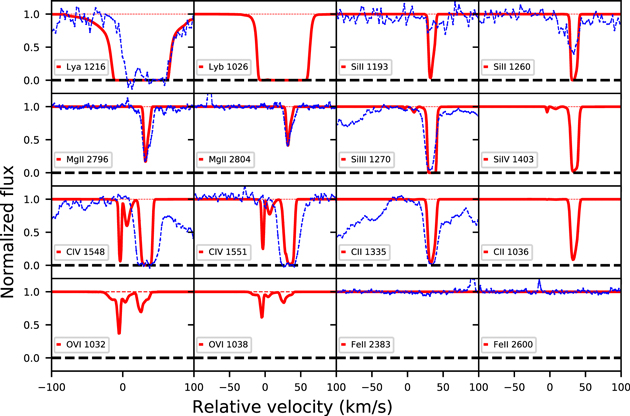
Figure 8. Mock spectra along the line of sight (green line in Figure 6) at t = 200 Myr, compared to the observed profiles of system 3 at z = 1.75570 (blue dashed line; Misawa et al. 2008). They are convolved with the instrumental line-spread function (R = 45,000) consistent with the observation.
Download figure:
Standard image High-resolution imageAlong the sight line, there are two Mg ii absorbers that correspond to two peaks in Figure 6 and the bottom left panel of Figure 7. They are shocked cooling shells in region (b) and are only separated by a small velocity in the spectrum, despite their spatial separation (Δv ∼ 2 km s−1 at v ∼ 38 km s−1), which is visible in the absorption profile as a slight asymmetry (Figure 8).
The same shells produce C iv absorption but no O vi absorption. The O vi absorbers in region (b) are in a different, coronal phase. The C iv absorbers in region (a) are more than a few kiloparsecs in size: one is at z ∼ 2.5 kpc with a positive velocity (v ∼ 10 km s−1), one is at z ∼ 2.5–4 kpc with a negative velocity (v ∼ − 5 km s−1), one is at z ∼ 10–11 kpc (cooler, v ∼ 30 km s−1) and one is at z ∼ 11–12 kpc (warmer, v ∼ 40 km s−1), both below the cooling shell (v ∼ 38 km s−1). The first two absorbers produce the double absorption profiles in Figure 8, and the last two absorbers produce the saturated absorption profile at v = 20–45 km s−1, together with the C iv absorbers in region (b).
The O vi absorbers in region (a) arise from the same cold clouds, producing two sets of double absorption profiles, but the sight line also passes through a shell swept up by the SN Ia–driven outflow at height z = 5–9 kpc with temperature T ≳ 105 K. The signal is buried in the double absorption profiles at v ∼ 10 km s−1. The O vi absorber in region (b) is coronal and turbulent with v ∼ −10 to 40 km s−1 but weak compared with the other O vi absorbers.
We note that some SN II outflow gas in region (a) cools to temperatures below 104 K by t ≳ 200 Myr; however, this overcooled, low-density (≤10−4 cm−3) gas only makes a small contribution to C iv and O vi column densities (see the Appendix). We also note that we are only picking one line of sight through one of the most prominent weak Mg ii absorbers at a given time in the analysis of Figures 7 and 8. In the next section, we show that our current simulations cannot account for all of the observed weak Mg ii absorbers with an ∼5% covering fraction in the dwarf halo. With the analysis, we ensure that our model spectra do not produce too much metal absorption and only suggest that they may be representative of observed metal systems. Beyond that, we are limited in making any firm predictions on incidence.
4.2. Comparison to Observations
4.2.1. Column Densities and Metallicities
Figure 9 shows the average column densities and total masses of Mg ii, C iv, and O vi ions as a function of time in the simulated box. The total Mg ii mass peaks at t = 40 Myr, the end of the SN II–driven period with swept-up ISM shells and fragments as strong Mg ii absorbers in LLS and sub-DLA environments. It quickly falls off by a few orders of magnitude as the shells and fragments mix with the hot outflow gas. Then, there are two small peaks in the total Mg ii mass at around t = 160 Myr with phase 1 formation and t = 240 Myr with phase 2 formation (see Figure 3). The total masses of the C iv and O vi ions peak at t ∼ 80 Myr, as the swept-up ISM shells and fragments mix with the hot outflow gas, and gradually decrease only by a factor of a few. As we mentioned in Section 3, 38% and 58% of metal-enriched gas escapes the simulation box by t = 40 and 300 Myr, respectively. Our simulations are too small to reliably predict column density statistics that may be compared with observations. Any time evolution would only relate to the evolution of column density within the simulation volume.
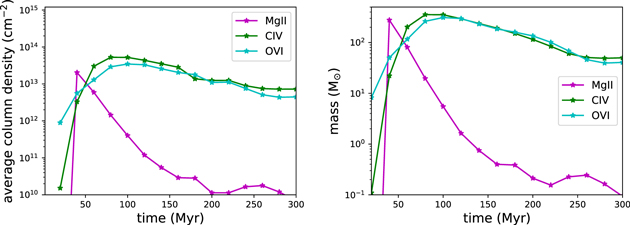
Figure 9. Average column densities (left) and total masses (right) of Mg ii (magenta), C iv (green), and O vi (cyan) ions as a function of time.
Download figure:
Standard image High-resolution imageIn Figure 10, we show the relation between ion and H i column densities in our simulation at t = 200 Myr in sight lines parallel to each of the three cardinal axes at 2.5 kpc < z < 17.5 kpc and compare them with the observed relations. The colors indicate the Mg ii, C iv, and O vi density-weighted metallicities on the left and the height above the galactic disk on the right. This relation looks very similar at different times. Effective lower limits to the Mg ii, C iv, and O vi column densities are 3.5 × 10⁸, 7.5 × 10⁸, and 4.7 × 109 cm−2 in our simulations. The Mg ii, C iv, and O vi absorbers in our simulation are enriched to z = 0.1–0.2 Z⊙ by SN II from an instantaneous starburst, as the SN Ia contribution is negligible at this point.
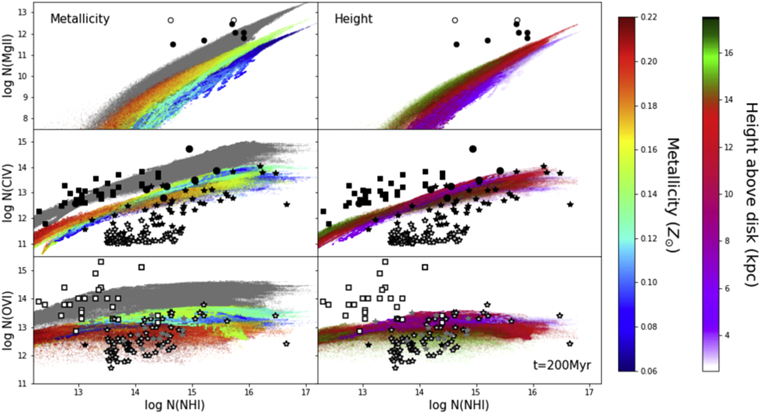
Figure 10. The Mg ii (top row), C iv (middle row), and O vi (bottom row) vs. H i column densities in sight lines parallel to each of the three cardinal axes at t = 200 Myr with different colors indicating Mg ii, C iv, and O vi density-weighted metallicities (left column) and height above the disk (right column), to be compared to the observed Mg ii/C iv clouds by Misawa et al. (2008; circles) and the observed C iv/O vi observations by Schaye et al. (2007; squares) and D'Odorico et al. (2016; stars, but gray stars for detection of only one member of the doublet). Note that O vi densities from Schaye et al. (2007; open squares) and C iv and O vi densities from D'Odorico et al. (2016; open stars) are upper limits. Gray points indicate the ion vs. H i column density distributions expected when all of the gas in our simulation is assumed to have solar metallicity. System 3 at z = 1.7557 toward HE 2243–6031 (Misawa et al. 2008) could have a very large metallicity, Z > 7.9 Z⊙, or a moderate value, ∼1.0 Z⊙, depending on two different photoionization models (open circles).
Download figure:
Standard image High-resolution imageThe top panels in Figure 10 show that sight lines with higher metallicities have higher Mg ii column densities at given H i column densities, and they are compared to the Mg ii–H i observations from three Mg ii absorbers at z ∼ 1.7 from Misawa et al. (2008) and four Mg ii absorbers at lower redshift (z = 0.65–0.91) from Charlton et al. (2003) and Ding et al. (2005). Only seven out of 26 single-cloud weak Mg ii systems (Misawa et al. 2008, Table 7) are modeled in detail to produce NH ii to be plotted in Figure 10. The Mg ii column densities in our simulation are up to an order of magnitude smaller than the observed values at the given H i column densities, NH ii > 1015 cm−2 (i.e., sub-LLS). The top right panel in Figure 10 shows that absorbers with the highest column density arise in region (b) where shocked SN II–enriched gas cools (red).
We suggest several reasons for this discrepancy in Mg ii column density. First, we are only modeling a single starburst, but repeated bursts of star formation will continue to load more mass and metals in the outflows, increasing the column densities of the cold, dense clouds forming within it. We also have assumed that all of the energy is deposited in the center of the galaxy. However, star formation may be more distributed, and at late times, the SN Ia progenitors will have drifted significant distances from their birthplaces in the starburst. Such distributed energy input contributes to mass loading of outflows in both dwarf (Fragile et al. 2004) and massive (Schneider et al. 2020) galaxies. This could result in denser cold clouds at late stages than found in our simulation.
We also set the initial metallicity of our dwarf disk and halo gas to be z = 10−3 Z⊙ to study the effects of metal contribution by our simulated starburst alone. Thus, we are likely underestimating the metallicities of Mg ii absorbers. If we assume that all of the gas in our simulation box has a solar metallicity, the boosted Mg ii column densities (gray points in Figure 10) agree better with the observed values.
We also note that the structures in which weak Mg ii lines form are at the limit of our numerical resolution, with only 5–10 zones resolving them in their thinnest direction, so some further increase in density could occur at higher resolution.
At lower NH ii < 1015 cm−2 (i.e., sub-LLS to Lyα forest), there is no dense cloud formation in our simulation and thus no Mg ii clouds with NMg II > 1011 cm−2. There are two Mg ii absorbers observed with NH ii < 1014.5 cm−2 at z ∼ 2 (Misawa et al. 2008), and their Mg ii column densities are larger than predicted by our simulations for sight lines with this NH ii by 2 orders of magnitude. This might also be due to lower metal enrichment or the limited resolution in our simulation. The estimated metallicities for the two absorbers are very high, Z = 0.63–0.79 Z⊙, and even supersolar, Z > 7.9 Z⊙, respectively. We hope to study the possible formation of supersolar, weak Mg ii clouds with future global simulations.
Simulated C iv column density distributions appear to agree better with the observed column densities of C iv absorbers that are found in the same sight lines with the Mg ii absorbers studied by Misawa et al. (2008). These C iv absorbers are in sub-LLS environments and have similar metallicities, Z = 0.1–0.3 Z⊙, to our simulation values, except for one absorber with Z = 0.8 Z⊙; this metal-rich C iv absorber is in a structure related to the supersolar, weak Mg ii absorber with Z > 7.9 Z⊙.
On the other hand, our simulated C iv column densities are smaller than those of the C iv absorbers studied by Schaye et al. (2007); the disagreement is by an order of magnitude. This is probably because these absorbers are selected for the high metallicities of at least Z ∼ Z⊙. Since only upper limits to H i are determined, only lower limits to the metallicities may be inferred. Although the systems are found in Lyα forest environments, it is possible that they originate in the CGM of galaxies too dim to detect. From photoionization models, they infer a median lower-density limit of nH > 10−4 cm−2, corresponding to an overdensity of 15 at z = 2.3, and median cloud radius upper limit of 1.5 kpc, although some upper limits are as high as 7 kpc for such high overdensities. In our simulation, smaller C iv clouds are found in region (b) and arise from the same clouds that currently host or used to host even smaller, weak Mg ii absorbers in sub-LLS to Lyα forest environments. Our metallicity-boosted values better agree with the observations (Figure 10). The upper limits for O vi column densities associated with the observed C iv absorbers (Schaye et al. 2007) are also above what our simulation predicts and lie in the metallicity-boosted gray area, just like most of the observed weak Mg ii and C iv absorbers. It may be that these systems arise in regions that have been exposed to multiple enrichment phases.
The observed C iv column densities by D'Odorico et al. (2016) appear to agree with our simulated values at NH ii > 1014.5 cm−2; however, at NH ii < 1014.5 cm−2, they are much lower than our simulated values, by up to an order of magnitude. These C iv absorbers are observed at a higher redshift, z ∼ 2.8, and the majority of them have their estimated metallicities between 10−2.5 and 10−2 Z⊙, much lower than our simulated values. Assuming the metals are homogeneously mixed with the H i, photoionization modeling suggests that the observed systems have overdensities of about 1–15. The corresponding sizes, for systems in photoionization equilibrium, lie in the range 1–300 kpc for NH ii > 1014 cm−2, typical of systems showing C iv features.
There is no further information about the physical properties available for the C iv and O vi absorbers observed by D'Odorico et al. (2016). The data for O vi column densities are mostly upper limits except for three detections, one of which shows a very weak C iv line and another of which shows none. Out of 15 possible O vi detections with single lines, six of them do not show an associated C iv line. Despite the estimated low metal contents, the observed O vi column densities and their upper limits appear to agree better with our simulated values in all H i environments. The right panels in Figure 10 show that C iv and O vi absorbers of all strengths appear both in cooling outflow gas (region (a)) and cooling shocked SN II–enriched gas (region (b)).
We note that the observed estimates and upper limits for C iv and O vi column densities at given H i column densities vary over 4 orders of magnitude. This may be due to the presence of H i–dominated gas in observed sight lines that lies in regions that are not covered by our simulations. However, for Mg ii absorbers and associated C iv absorbers, a major reason for the discrepancy seems to be a lack of metal enrichment, as well as the low initial metallicity of disk and halo gas in our simulation. We speculate that galactic outflows from repeated bursts of star formation for a longer duration (∼1 Gyr) will eventually create high-metallicity, complex structures of multiphase gas.
4.2.2. Covering Fractions
Figure 11 shows fractions of sight lines that occupy our simulation box above the galactic disk and within the virial radius as functions of Mg ii, C iv, and O vi column densities along the x-, y-, and z-axes at three different times. Weak Mg ii absorbers with column densities greater than the observed minimum NMg II ∼ 1011 cm−2 occupy only about fMg II ∼ 5% of the dwarf halo in our simulation, while the total covering fraction of weak Mg ii absorbers in L* galactic halos is estimated to be ∼30% by observations (Narayanan et al. 2008; Muzahid et al. 2018). The gray region in Figure 11 depicts the predicted fractions of sight lines as a function of the column densities of the observed weak Mg ii absorbers at various redshifts by Rigby et al. (2002), Charlton et al. (2003), Ding et al. (2005), Misawa et al. (2008), and Narayanan et al. (2008), based on an assumption that they cover 5%–30% of a halo. If a sight line goes through N dwarf satellite galaxies in an L* halo, the covering fraction in each dwarf halo would need to be approximately 0.3/N to be consistent with the observations.
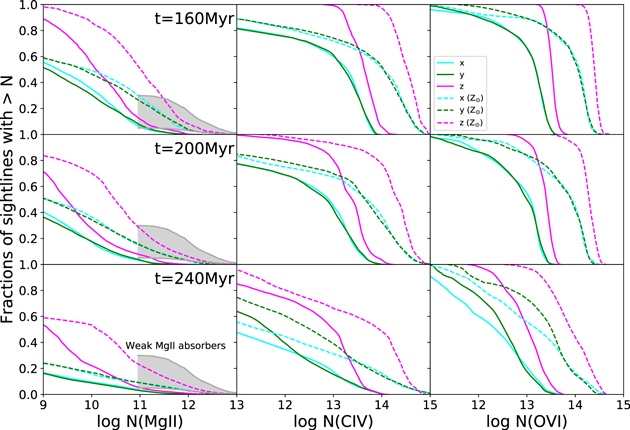
Figure 11. The Mg ii (left), C iv (middle), and O vi (right) covering fractions as functions of column densities along each of the three cardinal axes at t = 160 (top), 200 (middle), and 240 Myr (right). All sight lines between z = 2.5 (disk edge) and 17.5 (virial radius) kpc are included. The dashed lines show the covering fractions when all of the gas is assumed to have solar metallicities. The gray regions indicate the estimated fractions of sight lines as a function of Mg ii column densities when we assume that the observed weak Mg ii clouds at various redshifts (Rigby et al. 2002; Charlton et al. 2003; Ding et al. 2005; Misawa et al. 2008; Narayanan et al. 2008) cover 5%–30% of a halo. The observed Mg ii column densities are ≥1011 cm−2.
Download figure:
Standard image High-resolution imageThe covering fraction of weak Mg ii absorbers in our simulations is significantly smaller than the observed estimate. However, this is a lower limit for the covering fraction because 38%–58% of SN II outflow gas leaves the box by t = 40–300 Myr. Boosting the metallicities of all of the gas to Z⊙ (see dashed lines in Figure 11) raises the fractions of sight lines with NMg II ≳ 1011 cm−2 to fMg II ∼ 30%, but there is still a deficiency of Mg ii clouds with higher column densities NMg II ≳ 1012 cm−2. Most observed weak Mg ii absorbers have column densities NMg II ≳ 1012 cm−2.
As we argued in the previous section, repeated bursts of star formation will likely create more clumps and filaments, like the brightest structures in Figure 5, through cycles of phase 1 and 2 formation. Then, a larger fraction of the dwarf galaxy halo may be covered with moderately dense Mg ii absorbers. However, the formation of denser, high column density, weak Mg ii clouds may require other mechanisms that involve more gas and more metals with stronger shocks, as the shell density scales like the square of the Mach number in the expected isothermal shocks, so more powerful outflows may be responsible for the higher column density Mg ii absorbers. In addition, the interaction of outflows with cosmological infall will likely produce stronger shocks, so possibly denser clouds. Note we have a static background in our simulations. In addition, denser cloud formation may be inhibited by a lack of numerical resolution (see Section 3).
We can estimate the number density of weak Mg ii absorbers per unit comoving path length to be  0.060 assuming fMg II
∼ 5% for NMg II
≥ 1012 cm−2 when metallicity is boosted to Z = Z⊙, 0.32 Mpc−3 for a halo comoving number density with Mhalo ≥ 4 × 10⁹
M⊙ at the z = 2 Planck 2018 normalization (Reed et al. 2007; Collaboration 2020), and π(17.52 − 2.52) kpc2 for a halo proper cross section. This yields a value that is a factor of 5–7 smaller than the
0.060 assuming fMg II
∼ 5% for NMg II
≥ 1012 cm−2 when metallicity is boosted to Z = Z⊙, 0.32 Mpc−3 for a halo comoving number density with Mhalo ≥ 4 × 10⁹
M⊙ at the z = 2 Planck 2018 normalization (Reed et al. 2007; Collaboration 2020), and π(17.52 − 2.52) kpc2 for a halo proper cross section. This yields a value that is a factor of 5–7 smaller than the  at 1.4 < z < 2.4 found by Narayanan et al. (2008) and
  at 〈z〉 = 2.34 by Codoreanu et al. (2018) and shows that the model does not overpredict the number of Mg ii absorbers. Likewise, the number density of high-ionization clouds (C iv and O vi) per unit comoving path length is estimated to be
  and
and  with fC IV
= fO VI
∼ 50%. As a reference, it is
with fC IV
= fO VI
∼ 50%. As a reference, it is  at z ∼ 3 based on Figure 6 of D'Odorico et al. (2016), which includes all C iv systems along a line of sight, not necessarily only those confined to the CGM of galaxies. The covering fractions of C iv and O vi ions are measured to be 0.3–0.8 at impact parameters ≲1 proper Mpc around star-forming galaxies at z ∼ 2.4 (Turner et al. 2014). It is interesting to note that the comoving Mg ii mass density seems to increase by nearly a factor of 10 from 〈z〉 = 2.34 to 4.77 (Codoreanu et al. 2018) with a large number of weak Mg ii absorbers even up to z ∼ 7 (Bosman et al. 2017). This high incidence of Mg ii absorbers suggests that they are associated with dwarf galaxies, including smaller, numerous galaxies during the epoch of reionization, and the presence of the abundant weak Mg ii absorbers may be explained without more powerful outflows from larger galaxies.
We consider a thought experiment. (1) An SN II–driven outflow is launched from a star cluster every 100 Myr, the time by which gas flows back to the central source region in our simulation, and it takes 50 Myr for an SN II–driven outflow with v = 200–400 km s−1 to reach the shocked enriched gas from previous outflows (region (b)). (2) The SN Ia drive a superbubble and an outflow after the SN II stop in 50 Myr (we choose 50 instead of 40 Myr for simplicity), and it takes 100 Myr for an SN Ia–driven outflow to reach region (b) based on our simulation result. (3) Repeated bursts last for 1 Gyr. (4) Interaction from a newly launched outflow produces weak Mg ii absorbers that cover 3%–6% of our dwarf halo, and those weak Mg ii absorbers survive for at least 150 Myr, based on our simulation result. Then, we estimate that the covering fraction of dwarf halos by weak Mg ii absorbers will be 12%–24%. This number should go up once the CGM is more metal-enriched, because the covering fraction of 3%–6% is computed when the metallicities of the absorbers are Z = 0.1–0.2 Z⊙. We hope to test this hypothesis with our future global simulation in a larger box with repeated bursts in time and space.
5. Resolution Study
Numerical simulations of the CGM show an increasing amount of structure as numerical resolution improves (Oppenheimer et al. 2018; Peeples et al. 2019; van de Voort et al. 2019). Cold structures in particular give rise to low-ionization absorbers like Mg ii and require subkiloparsec resolution or a baryonic mass resolution of at least ∼105 M⊙ (Suresh et al. 2019; Ho et al. 2020; Nelson et al. 2020). We ran a resolution study to seek numerical convergence. Our standard simulation employs a highest resolution of 12.8 pc with four refinement levels, thus resolving ∼100 pc structures for our purposes. We base the estimate of roughly eight cells being required to minimally resolve structures on two arguments. First, the numerical dissipation range for supersonic turbulence computed with Enzo extends over almost an order of magnitude (e.g., Figure 5 of Kritsuk et al. 2007), similar to most other grid codes (Kitsionas et al. 2009). Second, modeling of a cloud in a supersonic flow shows that a radius of six zones using a second-order method is insufficient to capture fragmentation by instabilities (Figure 4 of Mac Low & Zahnle 1994).
To study the extent to which the production of clumps and filaments, as well as their substructures and fragmentation, is dependent on numerical resolution, we ran the same simulation with three refinement levels (low-res simulation) and five refinement levels in a region where the largest filaments form at [Δx, Δy, Δz] = [(−0.5, 3.28 kpc), (−0.5, 3.28 kpc), (10, 15 kpc)] (high-res zoom simulation). We only ran the high-res zoom simulation up to t = 200 Myr.
Figure 12 shows the phase 1 formation of filaments and clumps computed with the three different resolutions and compares the degrees of fragmentation in high-res zoom and our standard simulations. In the high-res zoom simulation, gas fragments into thinner filaments and smaller clouds compared with our standard simulation. The smallest structures are resolved across about eight cells, so they are ∼50 pc in the high-res zoom simulation compared with ∼100 pc in our standard simulation. The cool gas in which the Mg ii lines forms has substantially different structures in the low-res simulation, with much larger clouds compared with the higher-resolution runs. However, these structures appear to be reasonably well converged at our standard resolution, with only small changes appearing in the high-res zoom model.
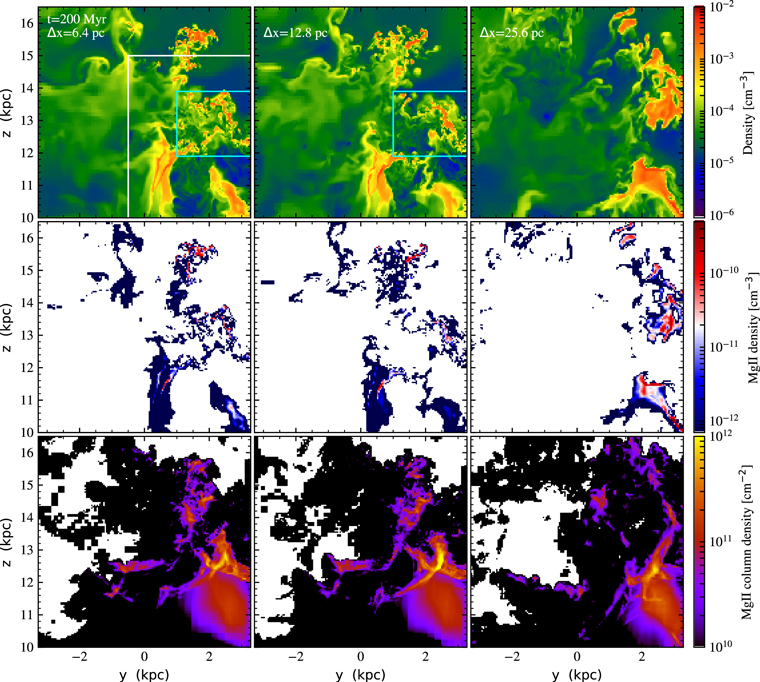
Figure 12. Sliced density (top) and Mg ii density (middle) distributions at x = +2.4 kpc from the disk center and projected Mg ii distributions (bottom) along the x-axis, all in the y–z plane, at phase 1 (t = 200 Myr), resolved with a highest resolutions of 6.4 in [Δx, Δy, Δz] = [(−0.5, 3.28 kpc), (−0.5, 3.28 kpc), (10, 15 kpc)] (white rectangle), 12.8 (our standard simulation), and 25.6 pc (from left to right). Regions enclosed in cyan rectangles are shown in Figure 13.
Download figure:
Standard image High-resolution imageDespite the differences in fragmentation seen in the low-res simulation, there is no significant difference in projected Mg ii distributions (Figure 13) or probability distribution functions for Mg ii, C iv, and O vi column densities (Figure 14). We see no change in the fraction of weak Mg ii absorbers with high column densities, and the probability distributions of weak Mg ii absorbers, as well as C iv and O vi absorbers, remain practically the same, with a marginal difference in the low-res simulation.

Figure 13. Same as the top panels in Figure 12 but showing only regions enclosed in cyan rectangles for the 6.4 (left) and 12.8 (right) resolutions.
Download figure:
Standard image High-resolution image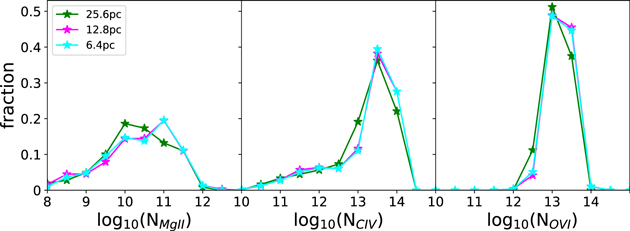
Figure 14. Probability distribution functions for Mg ii (left), C iv (middle), and O vi (right) column densities in standard (magenta), low-res (green), and high-res zoom (cyan) simulations.
Download figure:
Standard image High-resolution imageWe conclude that in our study, resolution has a visible effect in the fragmentation of clouds and filaments but seems to have little effect on the projected distribution of ions, suggesting that our results are numerically well converged for these observables (see also Figures 15 and 16 in the Appendix). There is a possibility that, at much higher resolution, filaments and fragments will further "shatter" into ∼parsec-sized cloudlets (Gronke & Oh 2018, 2020; McCourt et al. 2018), but to test this possibility requires cs tcool resolution in a galactic-scale simulation.
6. Summary
In this paper, we use hydrodynamical simulations of galactic outflows to explore the production of weak Mg ii absorbers and C iv and O vi absorbers in the CGM of a dwarf galaxy with a halo mass of 5 × 10⁹ M⊙ at z = 2, such as may populate the halo of a larger L* galaxy. With our standard numerical resolution of 12.8 pc, we model the formation of superbubbles and outflows from a galactic disk assuming a single instantaneous starburst in a simulation box with dimensions (6.5536, 6.5536, 32.768) kpc and study the interaction and cooling of metal-enriched outflowing gases. Although we ran the simulations for only ∼300 Myr, until most metal-enriched gas leaves the simulation box, our results highlight the possibility of dwarf galactic outflows producing transient Mg ii clouds, as well as larger C iv and O vi clouds, in sub-LLS and Lyα forest environments. Our modeled starburst only consumes 1.9% of the galactic gas disk, and the escape fraction of disk gas is less than 5%; thus, plenty of gas is available for further star formation.
Our main findings are as follows.
- 1.Thin, filamentary, weak Mg ii absorbers are produced in two stages.
- (a)Phase 1: shocked SN II–enriched gas loses energy and descends toward expanding SN II–enriched gas and is shocked, cools, and fragments.
- (b)Phase 2: SN Ia–driven outflow gas shocks the SN II–enriched gas, as well as phase 1 shells, which then cool and fragment.
- 2.The C iv absorbers are produced in expanding and shocked SN II–enriched gas. The C iv absorbers in the expanding SN II–enriched gas extend over 1–4 kpc, and C iv absorbers in the shocked SN II–enriched gas are smaller, 0.5–1 kpc, but they are both cool and photoionized. The smaller C iv absorbers originate from the same clouds that produce weak Mg ii absorbers, and they surround the dense Mg ii clouds. As the clouds get destroyed and mixed with the surrounding gas, Mg ii absorbers disappear first, but C iv absorbers survive for another 20–30 Myr.
- 3.The O vi absorbers are also produced in expanding and shocked SN II–enriched gas. The O vi absorbers in the expanding SN II–enriched gas originate from the same cool clouds that produce C iv absorbers, but O vi absorbers in the shocked SN II–enriched gas are not coincident with Mg ii or C iv absorbers. Their sizes are ≳1 kpc.
- 4.The C iv absorbers and most O vi absorbers are cool, photoionized clouds, while O vi absorbers arising in swept-up shells in region (b) are hotter and collisionally ionized. Photoionization dominates in the sub-LLS and Lyα environments found in our models.
- 5.The metallicities of Mg ii, C iv, and O vi absorbers are Z = 0.1–0.2 Z☉ by t = ∼200–300 Myr, after one moderate nuclear starburst forms in a dwarf disk and halo with a low initial metallicity Z = 0.001 Z⊙. We speculate that the clouds forming in shocked outflow gas will be progressively enriched with more metals when bursts of star formation are repeated.
- 6.The covering fraction of weak Mg ii absorbers in our dwarf halo is >3%–6%. This is a lower limit, as it represents the effects of only one moderate nuclear starburst, and more than half the metal-enriched gas leaves the simulation box before the end of the run. To reproduce the observed estimate for the covering fraction in an L* halo (30%) with outflows from such galaxies alone, the sight lines must go through the halos of multiple dwarf satellite galaxies. We also speculate that the covering fraction in a single dwarf halo will be boosted with repeated bursts with many cycles of phase 1 and 2 formation in a large simulation box that covers the entire halo.
There are two major problems in our current simulations: (1) a deficiency of weak Mg ii absorbers with high column density ≳1012 cm−2 and (2) the low metallicity of weak Mg ii absorbers.
The formation of denser, high column density, weak Mg ii absorbers may occur several different ways. Stronger starbursts could drive denser outflows. Dynamic infall could increase the density of the gas swept up in the weak Mg ii clouds seen in our models. Repeated starbursts will load more mass and metals and could sweep up gas from previous outflows that has neither escaped nor yet fallen back. Distributed energy sources, such as from SN Ia that have drifted from their birthplace, could drive more mass-loaded outflows, as was found in a dwarf galaxy by Fragile et al. (2004) and a more massive galaxy by Schneider et al. (2020). Numerical resolution seems less likely to matter, given that both we, in Figures 12 and 14 and the Appendix, and Schneider et al. (2020) found little variation with resolution in the range of 5–25 pc in outflow or ionization properties. Although our dwarf galaxy is not placed in the halo environment of a larger host galaxy, it is reasonable to expect repeated starbursts or a longer duration of starbursts in a dwarf satellite galaxy, as the median quenching timescale for star formation due to infall into the host halo is 2–3 Gyr in the Local Group (Wetzel et al. 2015).
The metallicity, less than solar, of our Mg ii absorbers is the result of our assumption of a single instantaneous starburst and the limited duration of our simulations (∼300 Myr) neglecting the SN Ia metal contribution. Starting with a higher initial metallicity for our dwarf disk and halo gas will also alleviate the problem.
This paper nonetheless highlights the possibility that galactic outflows from invisible dwarf satellite galaxies can produce highly enriched, multiphase gas consistent with observations of weak Mg ii absorbers in the halos of larger galaxies. We hope to address the remaining problems with our next, more global simulations.
A.F. was supported by Grants-in-Aid for Basic Research by the Ministry of Education, Science and Culture of Japan, grant No. 19K03911. The US National Science Foundation partly supported J.C.C. under grant No. AST-1517816 and M.-M.M.L. under grant No. AST18-15461. The UK Science and Technology Facilities Council Consolidated Grant ST/R000972/1 supported A.M. We acknowledge use of the Cray XC50 at the Center for Computational Astrophysics of the National Astronomical Observatory of Japan. We thank the anonymous referee for a detailed report that helped improve the presentation of our work. Computations described in this work were performed using the publicly available Enzo code (http://enzo-project.org), which is the product of a collaborative effort of many independent scientists from numerous institutions around the world. Their commitment to open science has helped make this work possible.
Facility: CfCA(NAOJ). -
Software: Enzo (Bryan et al. 2014), yt (Turk et al. 2011), TRIDENT (Hummels et al. 2017), SYGMA (Ritter et al. 2018).
Appendix
Figures 15 and 16 show that the projected distributions of ions in column density and covering fraction are very similar in our standard and low-resolution simulations, despite the visible effect seen in fragmentation of clouds and filaments (see the top middle and top right panels in Figure 12). They also show that overcooled, low-density (≤10−4 cm−3) gas contributes very little to the total ion budgets.
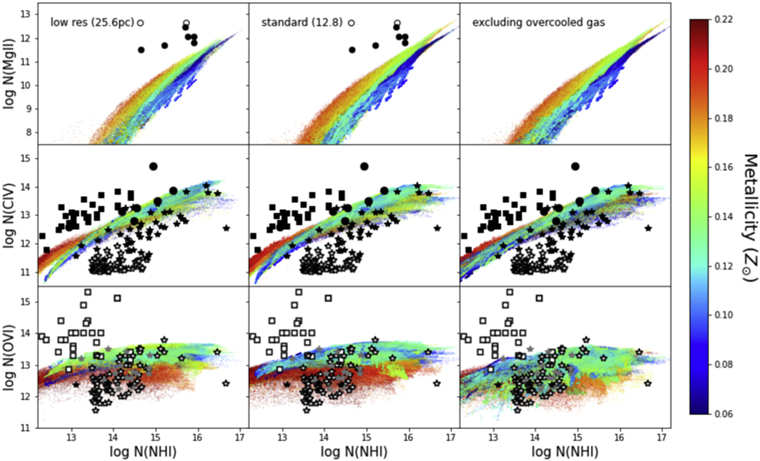
Figure 15. The Mg ii (top row), C iv (middle row), and O vi (bottom row) vs. H i column densities in sight lines parallel to each of the three cardinal axes at t = 200 Myr with different colors indicating Mg ii, C iv, and O vi density-weighted metallicities for the low-resolution simulation (left), our standard simulation shown in Figure 10 (middle), and our standard simulation without overcooled gas with nH ≤ 10−4 cm−3 and T < 104 K (right). In simulations with resolutions that differ by a factor of 2, there is no noticeable change for all ion distributions. With or without the overcooling gas, there is very little change for Mg ii and C iv distributions, while there is a marginal difference in the distribution of higher-metallicity O vi systems. The overcooled, low-density gas is metal-enriched outflow gas in region (a).
Download figure:
Standard image High-resolution image
Figure 16. The Mg ii (left), C iv (middle), and O vi (right) covering fractions as functions of column densities along each of the three cardinal axes at t = 200 Myr. All sight lines between z = 2.5 (disk edge) and 17.5 (virial radius) kpc are included for our standard simulation (solid lines; Figure 10), low-resolution simulation (dotted lines), and standard simulation excluding overcooled gas with nH ≤ 10−4 cm−3 and T < 104 K (dashed–dotted lines). There is very little difference between the standard and low-resolution simulations. With or without the overcooling gas, there is no noticeable difference in the covering fractions of the Mg ii and C iv systems, but there is a slight decrease in the covering fraction of the O vi systems at lower column density.
Download figure:
Standard image High-resolution image