


Abstract
We present an analysis of the formation and eruption of a filament and fast coronal mass ejection associated with a flare that occurred in active region 11429 using observations in the ultraviolet, extreme ultraviolet, X-ray, and radio wavelength bands. Precursor activity began as an interaction between two filaments, F1 and F2, that are identified as having twisted magnetic flux ropes (MFRs). Transient brightenings in all wavelengths are observed as a result of this interaction, likely the result of magnetic reconnection between the two filaments. This interaction results in a reconfiguration of the two filaments into a long overlying filament and a shorter low-lying filament. The upper filament subsequently undergoes a partial confined eruption. Plasma flows originating near the east footpoint of F1 lead to an extension of the upper filament into the filament channel to the west, resulting in a new active region filament (ARF). This new filament begins a slow rise and expansion. During its slowly rising phase, the MFR in which the filament is embedded becomes visible, with both the filament and flux rope rising and expanding simultaneously. The twist of the magnetic rope is determined as four turns. The erupting configuration changes from a twisted arch shape to a reversed γ shape within ∼75 s at the beginning of the fast-rise phase, representing a transformation from twist to writhe. The observations provide a clear example of filament formation via the tether-cutting reconnection of two nearby filaments. A helical kink instability may be the trigger of the ARF eruption.
Export citation and abstract BibTeX RIS

Original content from this work may be used under the terms of the Creative Commons Attribution 4.0 licence. Any further distribution of this work must maintain attribution to the author(s) and the title of the work, journal citation and DOI.
1. Introduction
Solar prominences, or filaments, are the visible manifestations of relatively cool, dense plasma suspended in the solar atmosphere. In general, solar prominences are seen in emission when observed above the solar limb, whereas they are seen in absorption against the solar disk in Hα and extreme ultraviolet (EUV) bands as dark, filamentary objects—hence, the term "filament," a term we use henceforth. Filaments usually form above magnetic polarity inversion lines (PILs; Babcock & Babcock 1955), which divide regions of positive and negative magnetic polarity in the photosphere. Martin (1990, 1998) summarized the conditions for the formation of a filament and proposed that the PIL is only a necessary, but not a sufficient, condition for filament formation. Gaizauskas (1998) proposed that for filament formation, a filament channel (FC) must exist at the height of the chromosphere. From an observational point of view, FCs are characterized by relatively long-lived, narrow lanes along the PILs at photospheric heights. In the chromosphere, FCs are regions characterized by the approximately parallel alignment of fibrils along the PIL. An FC may also extend to greater heights; in the low corona, it appears as a diffuse dark corridor (Schmieder et al. 2004). FCs provide the magnetic environment where filaments can form and be supported against gravity while being thermally shielded from the surrounding hot solar atmosphere. Several filaments may appear within the larger FC structure. However, not every FC contains a filament. An FC may survive a succession of filament formations and eruptions (Li & Zhang 2013). More details about filaments and FCs can be found in Vial & Engvold (2015).
Filament interactions have been studied observationally and in simulation. Linton et al. (2001) presented the details about the collision and reconnection of counter-helicity and co-helicity magnetic flux tubes through simulation. Their work demonstrates that under general conditions, parallel flux tubes with the same sense of twist can merge into a single flux tube near the point of contact. A simulation by DeVore et al. (2005) showed that two filaments of same chirality, juxtaposed along the same FC can merge into a single filament at their neighboring ends due to magnetic reconnection. Observational studies show that two nearby filaments located in the same FC or different FCs may interact to form a large filament when they come close to each other due to magnetic shearing and result in the formation of a new filament (Martin 1994; Schmieder et al. 2004; Aulanier et al. 2006; Jiang et al. 2014; Joshi et al. 2014, 2016) or the following filament eruption (Su et al. 2007; Bone et al. 2009).
Current evidence supports the view that filaments are embedded in a large-scale twisted magnetic flux rope (MFR), which is identified with the coronal cavity surrounding the filament (Chen 1989, 1996; Rust 1994; Low 1996, 2001; Tandberg-Hanssen 1995; Low 1994; Dere et al. 1999; Ciaravella et al. 2000). An MFR is characterized by a primary axial flux and a secondary component of azimuthal magnetic flux twisting about the primary axis. The MFR structure is the key physical ingredient for the formation and stability of the filament in its quiescent state and for its eventual eruption along with the larger magnetic structure, producing a coronal mass ejection (CME). It has been suggested that the filament weight is a means of anchoring its surrounding coronal fields (Low 1999, 2001; Fong et al. 2002; Low et al. 2003; Zhang & Low 2004). Observational studies have shown that a filament corresponds to the bright core of the three-component CMEs located near the bottom of the MFR (Dere et al. 1999; Riley et al. 2008). More recently, based on AIA observations, a hot plasma blob (Cheng et al. 2011) or hot channel (Cheng et al. 2013; Mitra & Joshi 2019) are identified as evidence of the MFR, which exists during the impulsive phase or even the pre-eruption phase. Additional details can be found in Cheng et al. (2017). Nindos et al. (2015) concluded, based on a sample of more than 140 flares, that nearly one-third contain hot flux ropes and that almost half of the eruptive flares contain a hot MFR. All the observational evidence indicates that hot blobs or hot channels are new evidence for the existence of MFRs.
Filament eruptions can be driven by an ideal process, such as a "helical kink" instability, or by a nonideal (resistive) process, such as magnetic reconnection. The helical kink instability occurs if the twist, a measure of the winding of the field lines about the flux-rope axis, exceeds a critical value. The erupting filament will develop a clearly helical axis shape in the course of the eruption, which is a characteristic property of the helical kink instability of a twisted MFR (Török & Kliem 2003; Török & Kliem 2005). Numerical MHD modeling suggests that a twist of 3.5, equivalent to 1.75 field-line turns, is a typical threshold value under coronal conditions (Fan & Gibson 2003; Török & Kliem 2003; Török et al. 2004). A helical flux tube with multiple turns (3–4 turns) associated with double flare and CME events has been reported by Gary & Moore (2004) and Liu et al. (2003). Alternatively, for the "tether-cutting" model (Moore & Labonte 1980; Moore et al. 2001), the eruption is triggered by reconnection of two inner legs of a sigmoidal magnetic structure, which produces low-lying shorter loops across the PIL and longer twisted loops linking the two far ends of the sigmoid. For an eruptive event, the unstable MFR is ejected, driving a CME, and producing a current sheet. Reconnection in the current sheet produces an arcade of post-flare loops.
In this paper, the Geostationary Operational Environmental Satellite (GOES) M8.4 soft X-ray (SXR) flare and eruptive event that occurred on 2012 March 10 at 17:15:00 UT in NOAA active region 11429 are presented. This active region was an "anti-Hale" β γ δ region that produced many confined and eruptive flares, including several X-class flares, during its transit across the solar disk and consequently has been the subject of numerous studies. An overview of the active region is provided by, e.g., Chintzoglou et al. (2015). We note that Dhakal et al. (2018) presented a study of this event, interpreting it in terms of a compound eruption of a preexisting "double-decker" filament structure (Liu et al. 2012). Here, we focus on the event precursor phase and show that, in contrast to the double-decker scenario, the precursor phase is characterized by dynamic processes of filament formation and a confined eruption. The observational data used in the present work are described in Section 2. The dynamic evolution of the event and a physical scenario are presented in Section 3. We conclude in Section 4.
2. Observations
The primary observations were made in ultraviolet (UV) and EUV wavelengths by the Solar Dynamics Observatory (SDO; Pesnell et al. 2012) Atmospheric Imaging Assembly (AIA; Lemen et al. 2012) and by the Solar Terrestrial Relations Observatory (STEREO) Sun Earth Connection Coronal and Heliospheric Investigation (SECCHI; Howard et al. 2008). SDO/AIA provides high resolution full-disk images of the corona and transition region up to 0.5 R⊙ above the solar limb in seven EUV bandpasses (centered on 94, 131, 171, 193, 211, 304, and 335 Å) with a cadence of 12 s and a pixel size of 0.6'' that span a temperature range from 6 × 10⁴ to ∼ 107 K. In addition, two UV bandpasses are observed (1600 and 1700 Å) with a cadence of 24 s. STEREO was originally comprised of two identical spacecraft orbiting the Sun at 1 au, one (A)head of the Earth (STEREO-A) and one (B)ehind the Earth (STEREO-B). On 2012 March 10, STEREO-A was 110° ahead of the Earth and STEREO-B was 118° behind. The SECCHI Extreme Ultraviolet Imager (EUVI; Wülser et al. 2004) observes the Sun in four EUV bandpasses with an angular resolution of 1.59'' and a temporal resolution of 75 s (171 Å) or 5 minutes (195 , 284, and 304 Å). The event reported here was seen as a limb event by STEREO-A (STA hereafter) but was not visible to STEREO-B. The associated halo CME was observed by SECCHI coronagraph COR1 (Thompson et al. 2003) with a temporal resolution of 150 s.
In this study, we have investigated all of the UV/EUV channels with a particular emphasis on 1600, 211, 171, and 131 Å. The 171 and 211 Å bandpasses are both sensitive to relatively cool coronal plasma (peak temperature responses of ∼1 and ∼2 MK, respectively); the SDO/AIA 211 Å bandpass is included because key features are more clearly visible in this bandpass than in other bandpasses. The SDO/AIA 131 Å bandpass is selected for the high temperature wavelength (peak temperature response of ∼11 MK in flaring regions). The STA/EUVI observations in 171 Å offer a different vantage point from that of SDO/AIA, albeit at a somewhat lower angular and temporal resolution than those made by SDO/AIA.
Simultaneous observations of the magnetic environment of the host active region were provided by the Helioseismic and Magnetic Imager (HMI) on board SDO (Schou et al. 2012). The HMI is designed to measure the Doppler shift, line-of-sight magnetic field, intensity and vector magnetic field at the solar photosphere using the 6173 Å Fe i absorption line (Norton et al. 2006). In order to study the temporal evolution of the magnetic field in the core region, full-disk line-of-sight magnetograms with a temporal resolution of 45 s and a pixel size of 0.6'' are used. In order to understand the three-dimensional magnetic field structure of the active region, we extrapolated the magnetic field by a nonlinear force-free field (NLFFF) model (Wiegelmann 2004; Wiegelmann et al. 2006). We use the Space-Weather HMI Active Region Patches (SHARP; hmi.sharp_cea) data at 16:48 UT as the boundary. The data were remapped from CCD coordinates to the heliographic cylindrical equal-area projection centered on the patch and with a pixel scale of 0.36 Mm (Bobra et al. 2014). The 180° ambiguity of the transverse field is resolved by using the Minimum Energy Code (ME0; Metcalf 1994; Leka et al. 2009). The extrapolation is performed in the cubic box of 300 × 220 × 220 uniformly spaced grid points with the spatial scale of 300'' × 220'' × 220''.
We have also made use of hard X-ray (HXR) observations by the Reuven Ramaty High Energy Solar Spectroscopic Imager (RHESSI; Lin et al. 2002), SXR observations by the GOES, and radio observations by the Radio Solar Telescope Network (RSTN). We used the standard RHESSI package in SSWIDL: solar software idl (SSWIDL) to get both the image and the light curve. For imaging of the RHESSI source region, we used the CLEAN (Hurford et al. 2002) algorithm with the natural weighting scheme for front detector segments 3, 4, 6, 7, and 8. The spatial resolution of the image is about 7'' and the integration time is 210 s. For this M8.4 flare, RHESSI uses A1 (thin attenuators) and A3 (thin plus thick attenuators) attenuators to reduce the count rate to keep the detectors from being saturated during the flare impulsive and peak phase. In order to get a light curve to show the flux variation tendency, we use a simple method to convert the count rates to the same state with no attenuators (A0). We assume that the count rates are the same for two neighboring times, which are recorded in different states. So, the RHESSI light curve here only shows the variation tendency of the X-ray emission in different energy bands.
3. Dynamic Evolution of the Event
When it first appeared on the east limb, AR 11429 fulfilled conditions for a flare productive active region, namely, Hale's law incompatibility, a β γ δ magnetic configuration, and strong shear along the PIL (Elmhamdi et al. 2014), and indeed, from March 3–14 AR 11429 produced more than a dozen M-class and three X-class SXR flares. Particularly notable is the pair of X-class flares that occurred within ∼1 hr on 2012 March 7, and their associated CMEs. Several studies of the MFRs in AR 11429 and their relationship to the eruptions on 2012 March 7 have been conducted (Chintzoglou et al. 2015; Syntelis et al. 2016; Zhou et al. 2019), and of the large geomagnetic storm that resulted (Patsourakos et al. 2016). Also notable is the C1.9 flare observed in AR 11429 on March 3. For the first time, radio spectroscopic imaging observations of a flare were obtained by the recently commissioned Very Large Array (VLA; Perley et al. 2009) . The event of March 3, observed on the east limb, produced an MFR eruption and fast CME (Chen et al. 2014). Analysis of the radio observations suggest the presence of a termination shock (Chen et al. 2015). The M8.4 flare on March 10 was also observed by the VLA. Here, we discuss the GOES M8.4 flare and MFR eruption with a focus on the UV/EUV observations.
3.1. Overview
Figure 1 provides an overview of the event. Panel (a) presents the GOES 1–8 Å SXR flux, which shows a flux increase beginning at about 16:57 UT, peaking at 17:08 UT at a level of C2.8. This pre-eruption flux increase is associated with the formation of an active region filament (ARF) in AR 11429. The SXR then declines until 17:15 UT at which point it increases rapidly to a level of M5.4 at 17:27 UT. It is during this time period that the ARF and MFR erupt, driving a fast CME. The SXR emission reaches its maximum of M8.4 at 17:45 UT, followed by an extended decay phase.
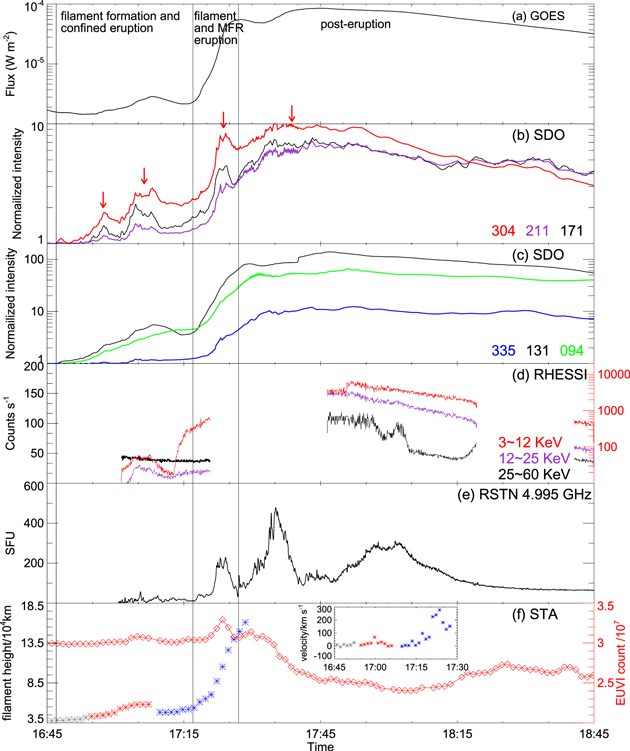
Figure 1. (a) GOES 1–8 Å light curves. (b) SDO/AIA EUV light curves in the cool bandpasses of 304, 211, and 171 Å; (c) SDO/AIA EUV light curves in the hot bandpasses of 335, 131, and 094 Å; (d) RHESSI X-ray light curves in 3–12, 12–25 and 25–60 keV energy band; (e) Radio flux variation recorded by RSTN at 4.995 GHz; (f) Evolution of the intensity counts (red diamond) and the height of F1 or F2 (gray crosses), upper filament (red asterisks), and AFR (blue asterisks) recorded by EUVI/STA; the velocity deduced from the height–time plot is shown as a small plot. The vertical lines demarcate the filament formation and the confined eruption phase, the filament and the MFR eruption phase, and the post-eruption phase.
Download figure:
Standard image High-resolution imageSDO/AIA EUV integrated light curves are shown in Figures 1(b), (c), where the emission has been summed over the AR (Figure 2) and normalized to its pre-flare levels. Figure 1(b) shows light curves of cool plasma in the 304 Å bandpass and relatively cool coronal plasma in the 171 and 211 Å bandpasses. As we will show in detail in Sections 3.2–3.4, the four peaks (as indicated by red arrows) in these light curves are associated with the following processes: the interaction between two discrete filaments F1 and F2; the confined eruption of a filament that subsequently forms as a result of the interaction of F1 and F2; the eruption of the ARF; and the evolution of post-flare loops. In contrast, Figure 1(c) shows the light curves of emission from hotter plasma in the 94, 131, and 335 Å bandpasses. Of these, only the 131 Å emission shows a clear precursor signature. None of the hot bandpasses shows an impulsive signature associated with the filament eruption.
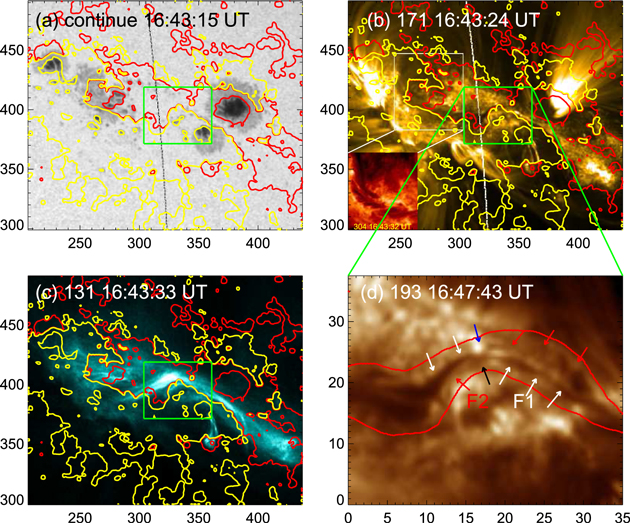
Figure 2. AR 11429 prior to the eruption. (a) SDO/AIA continuum image overlaid with the line-of-sight magnetic field. Yellow (red) contours represent negative (positive) magnetic polarities. The black-dotted line indicates the limb as viewed from STA. (b) An SDO/AIA 171 Å image, with the white line indicating the position of the solar limb as viewed from STA. A 304 Å image as shown at the left bottom shows the aligned fibrils along the PIL. (c) SDO/AIA 131 Å image with the line-of-sight magnetic field. (d) An enlarged SDO/AIA 193 Å image showing the area outlined by a green box in panel b, with white and red arrows indicate F1 and F2, respectively. The black arrow indicates the location where F1 and F2 cross. The blue arrow indicates an EUV brightening. The red curves outline the profiles of both F1 and F2.
Download figure:
Standard image High-resolution imageFigure 1(d) shows HXR light curves as measured by RHESSI in the 3–12 (right y-axis), 12–25 (right y-axis), and 25–60 keV (left y-axis) photon energy ranges. A precursor phase can be identified in the X-ray energy band of 3–12 and 12–25 keV. The later phase of filament and MFR eruption and the early phase of the post-eruption were not observed as RHESSI went into nighttime. RHESSI resumed observing at about the time of the SXR maximum at 17:45 UT. Figure 1(e) shows the RSTN radio flux variation at 4.995 GHz, which may be regarded as a qualitative proxy for HXR emission. While minor activity at 5 GHz is apparent during the precursor phase, clear impulsive peaks occur during the filament eruption and the subsequent rise to the maximum.
Figure 1(f) shows the evolution of the EUVI emission as viewed from STA. Red diamonds show the 171 Å count variation and asterisks indicate the position of the filament heights by tracking the relevant features in STA. As seen by STA, the two filaments (F1 and F2) are hard to distinguish; the gray cross indicates the height of F1 or F2. Red and blue asterisks later indicate the height of the upper filament and the ARF, respectively. The velocity deduced by the height–time plot is shown in Figure 1(f) as a plot inset from 16:45–17:30 UT. F1 and F2 show a slight increase in the very beginning of the filament formation phase, followed by a relatively obvious increase in height as a result of the confined eruption of the upper filament (see Section 3.1). A rapid increase in height during the main eruption is consistent with the flux increases seen by SDO and GOES. As was the case for the AIA emission in cool plasma (panel b), the EUVI-A flux also increases during the ARF formation and eruption phase. Subsequently, however, it decreases during the AIA main flare phase, which may result from the coronal dimming during the filament eruption from the EUVI-A point of view. The erupting filament moves out of the EUVI-A field of view (FOV) at around 17:30 UT.
Figure 2 shows AR 11429 at about 16:43 UT, prior to precursor activity and the eruption. Although still flare productive, AR 11429 was already in its decay phase by 2012 March 10. The AR is composed of two well-separated sunspot groups: the western part and the eastern part. The line-of-sight magnetic field is overlaid on each panel, where yellow (red) contours represent the negative (positive) magnetic polarities (contour levels: ± 20 and ± 800 Gauss). Figure 2(a) shows that the western sunspot group is composed of compact sunspots with opposite polarities, while the eastern group is comprised of several small positive sunspots enclosed by a penumbra followed by a compact negative sunspot. The PIL, indicated by the almost coincident yellow and red lines, extends through the entire AR from the northeast to the southwest with a length of 1.4 × 10⁴ Mm.
The long PIL is associated with different features in EUV images. In the 171 Å image, the PIL in the eastern sunspot group is outlined by the aligned fibrils. Even through there is no obvious filament seen in this bandpass, the fibrils aligned along the PIL can also be identified in the 304 Å image (left bottom in Figure 2(b)), showing the likely location of the FC (Gaizauskas 1998). The area outlined by the green box shown in the center of Figures 2(a), (b) shows the presence of a dark arch-shaped feature. By contrast, there are no aligned fibrils or filament along the PIL in the western sunspot group, where the ARF later forms and erupts. Figure 2(c) shows AR 11429 in the 131 Å bandpass, indicating relatively hot plasma, where bright loops are seen aligned with the PIL in the central and western parts of the AR.
Figure 2(d) shows the enlarged area outlined by a green box in Figures 2(a), (b) at 193 Å recorded at 16:47:43 UT. It shows that the arch-shaped dark feature is composed of two small crossing filaments. One is narrow and dark, indicated by white arrows and is labeled F1. The other is more diffuse, indicated by red arrows and is labeled F2. A black arrow indicates where F1 and F2 cross. The blue arrow indicates an EUV brightening. The western branch of F1 is composed of several dark threads along the PIL. Red curves outline the outer boundary of F1 and F2.
STA observed this event on the limb with a temporal resolution of about 75 s in 171 Å. Seen as a limb event, and in the absence of sky background, STA allowed the eruption and its morphology to be seen more clearly than in the higher-time-resolution SDO/AIA data seen against the background AR. The EUVI-A solar limb is outlined in Figures 2(a), (b) as black and white curves, respectively. It shows that the solar limb as seen by STA cuts across F1 and F2 near their crossing point. We now discuss the detailed evolution and eruption of the ARF in three separate phases: (1) the ARF formation phase, from 16:46–17:15 UT; (2) the ARF eruption phase, from 17:15–17:27 UT; and (3) the post-eruption phase for times later than 17:27 UT. Our focus here is primarily on the first two phases. The high spatial and temporal resolution data from SDO and STEREO provide the opportunity to give a rather complete picture of the formation and eruption of an ARF.
3.2. Filament Formation Phase
Figures 3 and 4 show the details of the formation of the ARF using joint AIA and EUVI-A images with the same pixel size. This process also can be seen more clearly in animation of Figures 3 and 4. In order to highlight the morphology at different times and different wavelengths, both homomorphic filtering (Oppenheim et al. 1968) and histogram equalization (Pizer et al. 1987) were used in the image processing. Each row shows images at approximately the same time. The first two columns show STA and SDO 171 Å images. The next two columns show SDO 211 and 131 Å images, respectively. In the first row of Figure 3, F1 and F2 are indicated by green and red arrows in panels (k) and (f). F1 is a compact dark thread, while F2 is a more diffuse feature, but with an obvious twisted fine structure to the west (as indicated by a white arrow in panel (f)). The location where F1 and F2 cross is indicated by a black arrow in Figure 3(k). Taking the F1 and F2 crossing point as a reference point, the left and right parts of F1 are labeled LF1 and RF1, and the left and right parts of F2 are labeled as LF2 and RF2.
Early transient activity is first evident in the EUV as brightenings at ∼16:46:30 UT and somewhat later in the UV at 1600 Å. The first row in Figure 3 shows the morphology of the brightenings at ∼16:48:30 UT in which their emission in 1600 Å is overlaid on a 171 Å image as red contours (Figure 3(f)). The contours demarcate areas where the intensity is >0.2 times the maximum 1600 Å intensity. As indicated by the blue arrow in the same panel, the initial EUV brightening is near the location where F1 and F2 cross. The 1600 Å contours is co-spatial with the EUV brightenings. The 1600 Å contours with additional EUV brightenings to the east and west of the main brightening, as indicated by purple arrows, appear as an arch-shaped structure, which coincide with the location of F1 and F2. Together, the early UV/EUV brightenings resemble a possible arch-shaped structure that we label L1. As viewed by EUVI-A, the initial EUV activity is characterized by a slow rise of the filament that begins around 16:48 UT with an average upward speed of ∼17 km s−1 (Figure 1(f)). A dark filament is indicated by red arrows as a small arch as shown in Figures 3(a), (b). Compared with AIA observations, F1 and F2 are hard to identify clearly in EUVI-A observations during the filament formation phase. We suggest that the dark feature identified in Figures 3(a)–(c) is the counterpart of both F1 and F2. Likewise, the counterpart to the EUV brightening in the AIA image sets cannot be identified in EUVI-A images, likely because of the occulting foreground limb in the latter. The second row of Figure 3 shows that the loop-like feature L1 continues to evolve with the UV/EUV brightenings extending east and west. During this period, additional EUV counterparts to L1 in 171, 211, and 131 Å appear (indicated by blue arrows) near the crossing point of F1 and F2, and in between RF1 and RF2. EUV brightenings are first apparent as viewed from STA at approximately 16:51 UT (Figure 3(c); red arrows), on both sides of the dark filament, while the AIA observations show continuing extension of the UV/EUV brightenings along L1.
Around 16:53:30 UT, as shown in the fourth row of Figure 3, the configuration of F1 and F2 changes, indicating that a possible reconnection process occurred. Specifically, the images show that two new filaments LF1-RF2 and LF2-RF1 appear with L1 located in between them. The LF1-RF2 filaments appear to form a long filament overlying a shorter filament that forms from LF2-RF1. We refer to, and label, these newly formed filaments the upper filament (UF) and lower filament (LF). The high temperature bandpass of 131 Å shows that the UF appears as a reversed-ω-shaped structure at 16:54:35 UT (Figure 3(s)), with the sunken structure spatially consistent with the EUV brightening and the crossing of F1 and F2. The newly formed UF can be seen clearly a few minutes later in Figure 3(t). However, its right part is obscured in the 171 and 211 Å images (Figures 3(j), (o)) by bright EUV emission. The LF, which is invisible in 131 Å can be seen in 211 and 171 Å images by careful examination as indicated by black arrows in Figures 3(n), (o).
As indicated by the gray arrows in Figures 3(j), (o), and (t), a portion of the UF to the west experiences a partial confined eruption (labeled CE), beginning at roughly 16:57 UT. The eastern part of the UF remains stable (white arrows, Figure 3(t)). The evolution of the CE is shown in Figure 4. Note the change in the FOV between the top two rows and the bottom three rows. At about 17:01 UT, the initial EUV brightening under the CE as recorded by AIA appears in the EUVI-A 171 Å image as a compact bright area, as indicated by the purple arrow in Figure 4(a). At this moment, above the brightening, the CE appears as arch-shaped filament threads, outlined by gray arrows in the image, while the LF is indicated by black arrows (Figure 4(b)). By 17:03:30 UT, the loop structure of the CE can be seen clearly in both the AIA and EUVI-A observations, as outlined by gray arrows in Figures 4(l), (q), showing an arch-shaped configuration with a twisted morphology. The CE reaches its maximum height at around 17:08 UT, coincident with the maximum of the precursor activity shown in Figure 1. From the EUVI-A observation (Figure 4(d)), after the rising CE plasma drains back to the solar surface and the bright arch-shaped structure has disappeared. As shown in the 131 Å images in Figure 4, RHESSI contours (yellow for 3–10 keV, red for 10–15 keV, and blue for 15–25 keV) represent the RHESSI soft and HXR source coincident with the CE. The contour levels are 60% and 85% of the corresponding peak flux. It shows the possible presence of nonthermal HXR emission coincident with the CE.
Figure 3. Dynamic evolution of the ARF formation observed by AIA and EUVI-A. The EUVI-A and AIA 171 Å images are in the first two columns, and the 211 and 131 Å images are shown in Columns 3 and 4. The red arrows in panels (a) and (b) outline the filament and panels (c), (d), and (e), indicate the EUV brightening viewed from STA. The red contours in the SDO 171 Å images outline the UV brightening in the AIA 1600 Å images. The purple arrows in panel (f) together with the blue arrow outline an arch-shaped structure in the 1600 Å image. The white arrow in panel (f) indicates the twisted configuration of the right part of F2. The blue arrows in all panels indicate the EUV brightening. The green and red arrows in the SDO 211 and 131 Å images outline the profile of F1 and F2. The black arrow indicates the location where F1 and F2 cross. The upper and lower filament, which are reconfigured from F1 and F2, are indicated by a white and black arrow. The gray arrow in the fifth row indicates the partial and confined eruption part. An animation of this figure is available in the online journal. The animation begins at approximately 16:45:00 UT and ends at around 17:15:00 UT. It shows the dynamic evolution of the ARF formation. The real-time duration of the animation is 6 s.
(An animation of this figure is available.)
Download figure:
Video Standard image High-resolution imageFigure 4. Dynamic evolution of the ARF formation observed by AIA and EUVI-A. In the first and second row, the gray arrows outline the profile of the partial and confined eruption part, the black arrows indicate the lower filament, and the purple arrows represent the brightening under the confined eruption. The co-temporal RHESSI contour (red for 3–10 keV, yellow for 10–15 keV, and blue for 15–25 keV) levels in the 131 Å images are 60% and 85% of the corresponding peak flux. The yellow arrows indicate the plasma flow. The green arrows in panels (s) and (t) outline the brightening loops. The white line in panels (r), (s), and (t) show the slice in Figure 7. An animation of this figure is available in the online journal. It is the same as in Figure 3.
(An animation of this figure is available.)
Download figure:
Video Standard image High-resolution imageA notable feature of the CE, concurrent with the evolution described above, is a plasma flow from east to west along the UF. It appears at around 17:03 UT. As indicated by the yellow arrow in the third row in Figure 4 (note change of scale), the plasma flow moves across the visible end of the UF and along the PIL. Its counterpart also can be identified in the EUVI-A image, although it is less visible. As shown in Figures 4(i), (n), and (s) at ∼17:09:30 UT, the plasma flows to the southwest along the PIL to form the new ARF. From the labeling of the end of the UF and the newly formed west footpoint of the ARF, it can be seen that the average flow speed during this process is about 80 km s−1. In the 131 Å images, a brightening loop structure that first appears around 16:57 UT, appeared again, as indicated by the purple arrows in Figures 4(s), (t). The plasma then flows under the loop structures (Figure 4(t)) and, by 17:15 UT, the new ARF has formed. Dhakal et al. (2018), who interpreted this event in terms of a "double-decker" eruption, identified the upper filament in their scenario (filament A in their Figure 8) with what we identify here as a newly formed ARF. In their scenario, the upper filament is a preexisting structure, whereas we have shown in Figure 4 and the corresponding movies that it forms between 16:45 and 17:15 UT. While Figure 4 and the corresponding movies with multiwavelength observations in the present work show clearly the process of the filament formation. Furthermore, if filament A is preexisting, it will undergo a slow rising to reach the position that is shown to be around 17:10 UT. But from both the EUVI-A and AIA observations, the filament appears little by little, and its evolution morphology can be seen clearly and continuously in all AIA EUV wavelengths. All the observations indicate that the filament cannot exist about 1 hr before the eruption as presented in Dhakal et al. (2018).
It is worth noting that the area along the PIL outlined by the green box in Figure 2 is the region where numerous small transients such as EUV brightenings are seen before the eruption. The EUV brightening in the 171 Å image in Figure 2(b) shows an example of such transient brightening, as indicated by the blue arrow. This small EUV brightening can be identified in all wavelengths and fades about 1 minute later. By checking the evolution of the line-of-sight magnetic field, we found that the dominant features of the magnetic field evolution are small flux cancellation events, indicative of magnetic reconnection in the low solar atmosphere along the PIL and identified with the global instability leading to an eruption (Zhang et al. 2001). Figures 5(a), (b) show two line-of-sight magnetic fields recorded at 12:00 and 16:45 UT as examples to show the variation in the magnetic field before the eruption of the filament. Red curves outline the profile of the outer boundary of F1 and F2, as shown in Figure 2(d). Blue line circles are opposite polarities that located along the PIL and can be separated from neighboring polarities. The positive and negative magnetic flux evolutions during about 6 hr before the eruption within the blue area is shown in Figure 5(c). For the positive (negative) magnetic flux, it declines by about one-third (a quarter). The magnetic field evolution can be seen more clearly in the animation of Figure 5. Recent studies (Joshi et al. 2017; Dhara et al. 2017) of flux-rope eruptions preceded by a decrease in the photospheric magnetic flux in the core flaring region suggest a tether-cutting reconnection may be responsible for triggering the eruption.
Figure 5. Magnetic field evolution along the PIL under F1 and F2. Panels (a) and (b) show the magnetic field recorded at 12:00 and 16:45 UT. The blue curve outlines the area where the magnetic field is calculated and the red curve outlines the profile of F1 and F2, as shown in Figure 2(d). Panel (c) shows the positive and negative magnetic flux variation before the filament eruption. An animation of panels (a) and (b) in the online journal shows the magnetic field evolution more clearly. The first 3 s of the video shows 171 Å images of the whole active region at 16:45 UT (before the activities) and 17:15 UT (after the ARF formation). The red and yellow contours outline the positive and negative polarities, respectively. A blue box is shown to identify the core region where the ARF formed. This region is shown in the rest of the animation. It is larger than in panels (a) and (b) and shows the sequence from about 12:00–19:00 UT. The total real-time duration of the animation is 25 s.
(An animation of this figure is available.)
Download figure:
Video Standard image High-resolution image3.3. Filament and MFR Eruption Phase
Figures 3 and 4 show that the new ARF formed as a result of the evolution and interaction of F1, F2, and the CE described in the previous subsection. The ARF began a slow rise, estimated to be 73 km s−1 between 17:17 and 17:21 UT as viewed from STA. Figure 6 shows the dynamic eruption of the newly formed ARF. Both the running difference and the original images are used to highlight the morphology at different times. The twisted structure of the filament can be identified clearly during the rise and expansion of the filament in both the AIA and EUVI-A images. The first row in Figure 6, obtained at around 17:18 UT, shows an example of the twist. A narrow, bright feature (indicated by yellow arrows) is entwined around the dark filament body from one footpoint to the other. This twisted structure can be easily identified in the 335 Å image along the length of the filament. Using yellow arrows as guides we find that the twist of the whole filament is about four turns (8π) but it is not uniform along the filament. The twisting is greater along the newly formed part of the ARF to the west (three turns) than is the portion to the east (one turn).
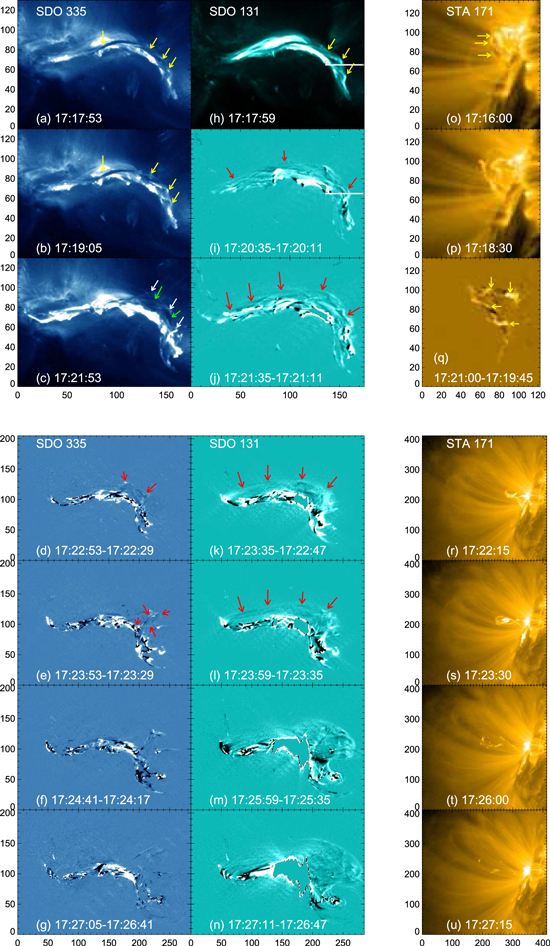
Figure 6. Dynamic evolution of the ARF eruption observed by SDO/AIA 335 and 131 Å and EUVI-A 171 Å. The yellow arrows are guides to help count the twist of the ARF. The red arrows outline the profile of the MFR during its eruption. The white and green arrows in panel (c) indicate the staggered pattern of dark filament and brightening features. The white lines in panels (h) and (i) outline the position of the slice of Figure 7.
Download figure:
Standard image High-resolution imageIn the EUVI-A 171 Å image, the filament shows a spiral structure (yellow arrows) corresponding to the western portion of the ARF (yellow arrows in the AIA observations). A time difference EUVI-A image (Figure 6(q)), using images at 17:21:00 and 17:19:45 UT, shows the twisted morphology quite clearly: a bright feature entwined with a dark feature with four turns (indicated by yellow arrows). The EUVI-A images subsequently show the clear transition of the filament between its slow (first three rows) and its rapid rising phases (bottom four rows): the morphology of the erupting filament rapidly transforms from twist to writhe at the beginning of the fast rising phase. As shown in Figure 6(r), the EUVI-A image obtained at 17:22:15 UT shows a clear reversed-γ shape, which then expands outward. In the 335 and 131 Å images the morphology of the erupting filament and flux rope evolve continuously at the beginning of the fast rising phase. As shown in Figure 6(e), the reversed-γ shape appears in the filament body around 17:23 UT in the 335 Å image.
An MFR is usually defined as a coherent helical magnetic structure with all field lines wrapping around the central axis at least one turn (Cheng et al. 2017). From an observational point of view, it is an expanding structure with a twisted morphology. In the present work, a typical MFR structure with four turns is identified during the eruption of the ARF as shown in Figure 6. In AIA high temperature wavelength bandpasses, it appeared as thread-like structures (as indicated by red arrows in Figures 6(i)–(l)), which are entwined around the dark filament body and linked both footpoints of the filament. Here, the thread-like structures and the filament can be regarded as the tracer of the helical magnetic structure and the central axis, respectively. In order to help us to track back the MFR, we draw a white line in Figure 6(i). It crosses the thread-like structures and the newly formed dark filament body. The same line is drawn in the 131 Å image in Figure 6(h) and Figure 4(t). Using the white line as a reference location, the evolution of the MFR can be reconstructed. As shown in Figures 6(h) and (i), the MFR clearly shows a helical bright structure entwined with the dark filament. Going back to Figure 4, the bright feature is identified as co-parallel brightening loops that cross the PIL above the ARF. This temporal evolution of the MFR is consistent with the simple sketches of MFR formation proposed by Low (2001).
In order to illustrate the points made in the previous paragraph another way, we show position–time stack plots in Figure 7 from a series of AIA images along the white reference line. The brightening loops first appear in both the 131 and 94 Å images at around 16:57 UT. Their morphology at that time is shown in the lower right corner in Figure 7, with the reference position again indicated by a white line. The parallel loop structure is obvious in the 131 Å image, is weak in the 94 Å image, and has no counterpart at all in the 335 Å image. In Figure 7, several discrete times are indicated. The temporal evolution of the brightening loop shows features typical of an evolving helical structure. A feature changes its location slowly along the reference slit in the position–time plots, with the helical structure moving or expanding when the feature is on the side toward the observer. Then it disappears suddenly when it moves from the side toward observer to the side backwards of the observer. Around the same time, another similar feature may appears on the other side. As shown by the position–time stack, the signature of the helical structure first appeared at around 16:57 UT. At around 17:07 UT, two bright features can be identified in the 94 Å position–time plot, with one going to disappear and the other just appearing at almost the same place as the disappearing one's first appearance. The newly appearing bright feature also moves from left to right and then disappears. Figure 7 shows that this process repeated four times. In the 335 Å image the plasma flow, which forms the ARF after the interaction between F1 and F2, first passes through the slit at around 17:10 UT. The brightening feature then appears in the 335 Å image associated with the filament formation here. It shows clearly that the bright feature and the filament body evolve simultaneously. The red lines indicate the rise of the outer edge of the MFR as observed in the 131 and 94 Å images. During the first three times, the MFR rises slowly with a projected speed of about 2 km s−1. Associated with the filament eruption, the MFR also experiences a slow and fast moving phase with the projected velocity of and 26 and 152 km s−1. The observational evidence shows that the pre-activities configuration of F2 is a helical MFR. Part of the MFR is emerged into the low corona. It contains plasma materials, and appears as F2. Others (west part) are in their emerging phase and appear as arch-shaped brightening loops that cross the PIL. The plasma flows along the hollow helical MFR from one footpoint to another, after the interaction between F1 and F2, forming the ARF. This observation shows that the twisted MFR can preexist along the FC and once the coronal plasma gathers here, the filament forms.
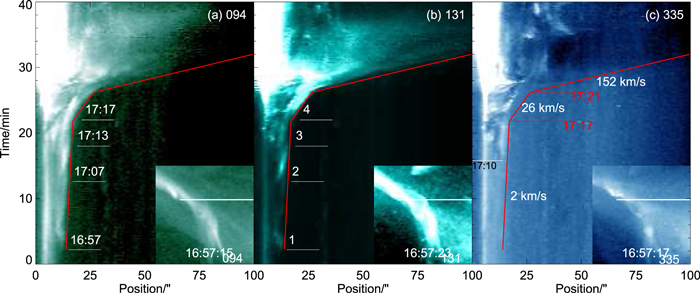
Figure 7. Dynamic evolution of the brightening loops that cross the west part of the FC and finally evolve as part of the erupted flux rope.
Download figure:
Standard image High-resolution image3.4. Post-eruption Phase
As shown in the EUVI-A images in the bottom four rows of Figure 6, the MFR and filament erupt into overlying coronal loops (indicated by the red arrow in Figure 6(r)), which expand upward with the MFR and filament and move out of the EUVI FOV by 17:36 UT, with the average velocity of about 274 km s−1. Associated with loops moving out of the EUVI FOV is the appearance of the brightening front of a CME. First appearing in COR1 at around 17:35:00 UT as faint brightening, the semicircular bright front is clear by 17:37:30 UT, as shown in Figure 8(a). The filament, which moves behind the coronal loops, evolves as the coiled structure within the associated CME. Figure 8(b) shows that by around 17:42:30 UT, the bright front has separated from the coiled filament and the classical three-part CME moves outward at 1400 km s−1. During this phase, the morphology of AR 11429 is typical of an eruptive flare, showing two flare ribbons separating and expanding, spanned by post-flare loops. It is primarily during the post-eruption phase that is observed by the Jansky VLA, producing a variety of coherent decimetric radio bursts. These will be described in a separate publication.
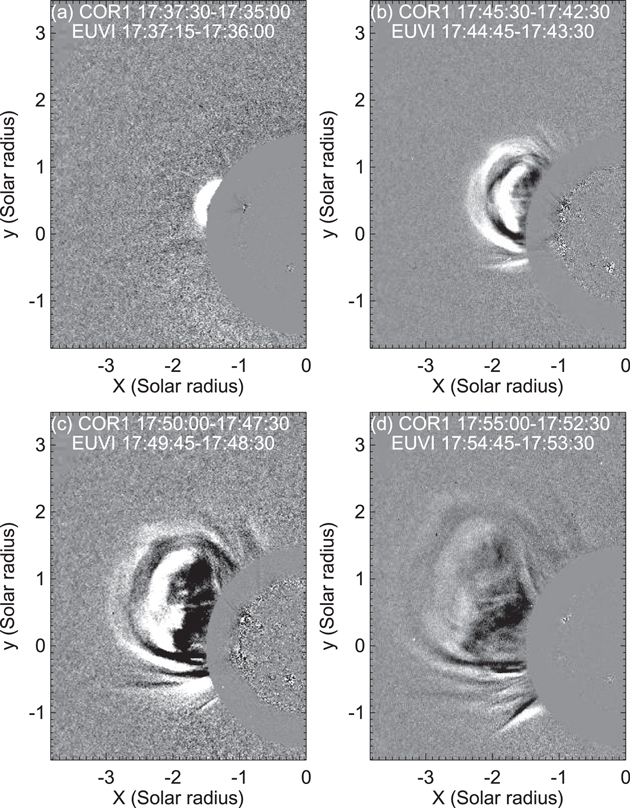
Figure 8. Running difference images deduced from COR1, show the propagation of the CME associated with erupted ARF and MFR.
Download figure:
Standard image High-resolution image3.5. A Physical Scenario
The difference evolutionary phase and corresponding main observational features are listed in Table 1. Here, we briefly summarized the dynamical evolution of the whole event as follows:
- 1.Formation of the ARF: Prior to the formation of the ARF, two filaments (F1 and F2) are identified in close proximity in the FC. At that time, there is no identifiable filament along the western part of the FC. An EUV brightening near the point where F1 and F2 cross appears at about 16:46 UT. Soon afterwards, at around 16:48 UT, an arch-shaped structure L1 appears in the 1600 Å image that evolves continuously with the 1600 Å brightening co-spatial with the EUV brightening. F1 and F2 reconfigure at around 16:53 UT, with the formation of UF and LF with L1 located in between. The high temperature bandpass of 131 Å shows the appearance of a reversed-ω-shaped structure at about 16:54 UT, and the sunken structure spatially coincident with the EUV brightening and the location where F1 and F2 cross. The UF experiences a partial and confined eruption, peaking at about 17:08 UT. RHESSI showed the possible nonthermal HXR emission that was coincident with the CE. Meanwhile, a plasma flow, which originates from the east footpoint of F1 and moves toward west along the PIL continuously after the reconfiguration to the UF and LF, extends the visible end of UF to the west and forms a new ARF. Magnetic flux in the area, where numerous EUV brightening occurred frequently, decrease associated with a small flux cancellation.
- 2.Eruption of the ARF and MFR: The newly formed ARF begins to rise and expand about 2 minutes after its formation. During its slow rise phase, low-lying bright loops, which initially cover the western part of the PIL, are entwined with the ARF, rising and expanding with the ARF. From both AIA and EUVI-A perspectives it is possible to show that the bright feature is twisted around the ARF body by four turns, which we identify as an MFR. The configuration of the erupting filament and MFR changes from a spiral-arch shape to a reversed-γ shape within 75 s at the beginning of the fast rising phase, which represents the transformation from strong twist to writhe. Then the reversed-γ-shaped filament expands and rises, moving out of the EUVI-A FOV within 15 minutes.
- 3.Post-eruption: After the filament and MFR eruptions, the evolution event in both the AIA and EUVI-A images of AR 11429 show flare ribbons and the formation of post-flare loops. The associated CME appears in COR1 at around 17:35 UT.
Table 1. Temporal Evolution of the Event
| Evolution Phase | Time/UT | Observations | Notes |
|---|---|---|---|
| ARF formation | 16:46 | Initial brightening in UV and EUV | Section 3.2 |
| 16:48 | Appearance of the arch-shaped structure (L1) in 1600 Å | Figure 3(f) | |
| 16:53 | Reconfiguration of F1 and F2, and formation of | Figure 3(n) | |
| UF and LF with L1 located in between | |||
| 16:54 | Appearance of the reversed-ω shape in 131 Å | Figure 3(s) | |
| 16:57 | Partial and confined eruption of UF | Figure 4 first to third row | |
| 16:57 | Appearance of MFR as brightening structure | Figure 7 | |
| 17:03 | Appearance of plasma flow | Figure 4 third row | |
| 17:08 | Reaching maximum height of the CE | ||
| 17:15 | Formation of ARF by plasma flow | Figure 4 fifth row | |
| ARF eruption | 17:17 | Slow rising of the ARF and MFR | Figure 6 first three rows |
| 17:21 | Fast rising of the ARF and MFR | Figure 6 bottom four rows | |
| Post-eruption | 17:35 | First appearance in COR1 | Figure 8 |
Download table as: ASCIITypeset image
In Figure 9, we present an NLFFF extrapolation (Wiegelmann 2004; Wiegelmann et al. 2006), and simultaneous 211 and 131 Å images for a reference time of 16:48 UT as seen from the top of the domain. In Fig 9(a), some selected representative field lines outline the magnetic topology and EUV counterpart just before formation of the ARF. In Fig 9(b), blue and red arrows indicate F1 and F2, which we can see more clearly in an enlarged image in Figure 2(d). Qualitatively, the selected extrapolated field lines in the whole active region show reasonable agreement with the plasma loops seen in EUVI images taken by AIA. Two low-lying magnetic structures exhibit MFR morphology and are found to be co-spatial with F1 (blue field lines) and F2 (red field lines). Especially, the structure of MFR2 extends to the west longer than that of F2. Comparing the magnetic field extrapolation and observational results, we suggest a physical scenario for the whole event as summarized schematically in Figure 10. Two low-lying MFRs are located along the FC of AR 11429 before the eruptions. One MFR (blue field lines, MFR1) contains a filament as F1. The twist of this MFR is about one turn. The other MFR (red field lines, MFR2) is still during its emerging phase and only the east part where emerged contains coronal material as F2. While the twist of it is about three turns. Reconnection occurs at the location where MFR1 and MFR2 and their associated filaments cross (Figure 10(a)) as proposed by the tether-cutting model, forming a larger complex MFR that undergoes a partial and confined eruption (Figure 10(b)) seen in the EUV and HXR bands. The larger MFR structure enables plasma to flow from the east to the west, forming a long ARF embedded in the twisted MFR (Figure 8(c)). The ARF and MRF present a twist of four turns, which is well above the critical twist needed for kink instability. Then it begins rising slowly about 2 minutes after it forms. During its slow rise, its twisted morphology can be identified clearly from both SDO and STA observations. It then erupts rapidly, transitioning from twist to writhe. The erupting MFR and filament then drive a fast CME, producing a classic two-ribbon flare and post-flare loops in its aftermath, consistent with the standard CSHKP (Carmichael 1964; Sturrock 1968; Hirayama 1974; Kopp & Pneuman 1976) flare-CME model (Figure 10(d)). The reconnection between coronal flux-rope configuration was simulated by Török et al. (2011) for corona conditions when they studied the dynamic interaction between two ARFs which occurred on 2003 November 20. The observations and their simulation show that the reconnection can occur when the two flux ropes locate close enough. Here, in our case, the two MFRs and their associated filaments share the same FC and crisscross from head to tail, indicative of a similar process to occur.
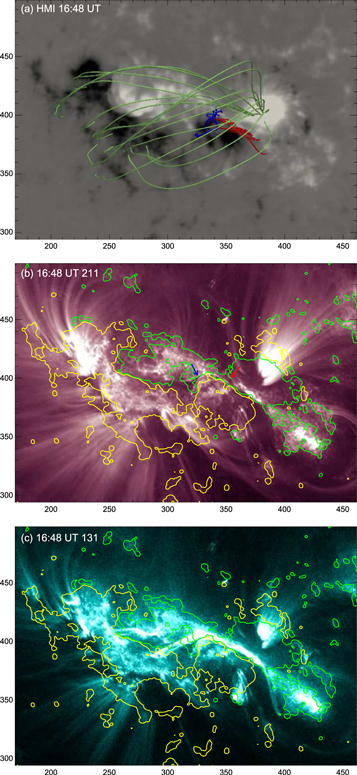
Figure 9. (a) NLFFF extrapolation of 2012 March 10 at 16:48 UT. The blue and red lines outline the low-lying MFR co-spatial with F1 and F2. The green lines represent the overlaying magnetic field; (b) the simultaneous AIA 211 Å image shows the morphology of F1 (blue arrow) and F2 (red arrow); (c) the simultaneous AIA 131 Å image shows a brightening structure along the extended PIL.
Download figure:
Standard image High-resolution image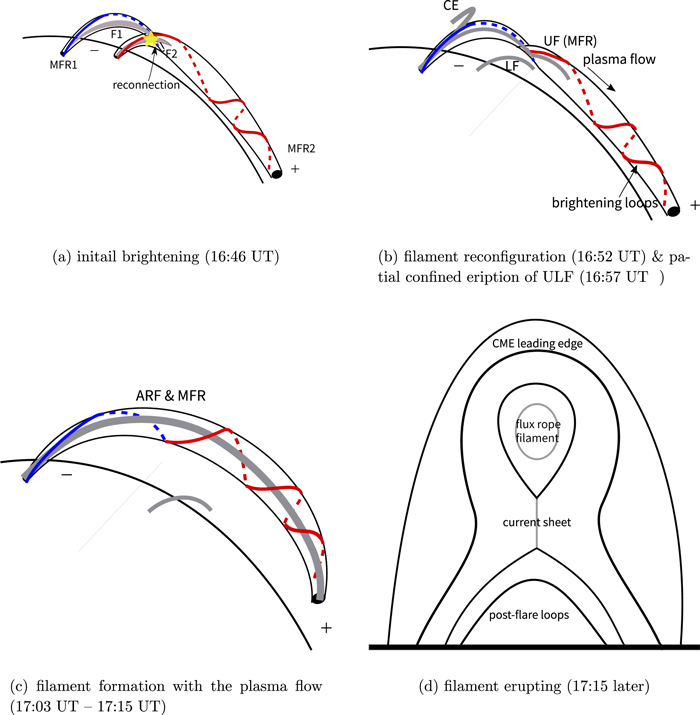
Figure 10. Schematic depictions of the proposed physical scenario. (a) Two flux ropes (MFR1 and MFR2) locate along the PIL, each of them hold a filament in it, namely, F1 and F2. Reconnection occurred at the crossing of F1 (MFR1) and F2 (MFR2); (b) F1 (MFR1) and F2 (MFR2) reconfiguration, UF (MFR) and LF form. The UF experiences a partial confined eruption. Around the same time, the large MFR structure enables plasma to flow from east to west. The helical features become visible as brightening loops that cross the PIL; (c) new filament formed due to the plasma flow. A coherent helical MRF, which entwines a filament body, becomes visible from its slow rising phase; (d) the rising filament pushed the coronal loop above it to form the brightening front of the CME and the filament and MFR form the coil body. Post-flare loops appear under the rising filament, with a long current sheet between them.
Download figure:
Standard image High-resolution image
It widely believed that flare, filament eruption, and CME are different responses of spectacular eruptions in the solar atmosphere. They originate from a subregion of the active region in the photosphere (flare), expand to cover a significant part of the solar surface in the corona (CME), and further extend all the way from the low corona to the interplanetary space. For the M8.4 flare, which we presented in the present work, it associates with a filament eruption, a CME, and also other different solar activities. In the current study, we mainly focus on the precursor phase in the low atmosphere, i.e., the formation of a filament via the interaction between two small filaments and the morphology of its hosted MFR during the eruption. So the physical scenario proposed in the present study has ignored other activities. We mainly considered the formation of the filament in the low atmosphere and simply regarded the following eruption as the eruption of an MFR-hosted filament. Another study, which presented the properties of two consecutive eruption magnetic structures and their associated "double-decker" filaments during the impulsive phase of this event, was presented by Dhakal et al. (2018). Even though we suggest that one of the filaments is newly formed during the pre-activities, their erupting scenarios are helpful in understanding double-decker eruption. The double-decker structure was first identified by Liu et al. (2012) as filament composed of two branches separated in height. Subsequently, double-decker flux rope was reported with two flux ropes intertwined with each other (Cheng et al. 2014; Mitra et al. 2020). Dhakal et al. (2018) presented a study of this event in which they interpreted the filament eruption in terms of double-decker filaments (Liu et al. 2012). In contrast, we suggest that instead of the eruption of a preexisting double-decker morphology, the precursor phase is characterized by filament formation and a confined eruption.
4. Concluding Remarks
In this study, we have presented observational evidence for the formation of a large ARF due to the interaction of two proximate filaments within the same FC as a tether-cutting reconnection, and inferred that the subsequent eruption of the newly formed filament likely results from a helical kink instability. The activity starts with EUV brightenings seen by AIA near the crossing point of the two filaments. This brightening together with 1600 Å brightening appear as an arch-shaped structure, which is co-spatial with F1 and F2. These observations suggest a magnetic reconnection between F1 and F2, resulting in the transient UV and EUV emissions and topological changes that resulted in the formation of the UF and LF with the 1600 Å UV loop located between them. The eastern half of the UF undergoes a partial and confined eruption, producing HXR emission that is coincident. At the same time, plasma flows from what was originally the east footpoint of F1, extending the UF to the west, forming a new ARF. The ARF is apparently embedded within a new MFR. Shortly after its formation, the AFR and MFR begin a slow rise and expansion, during which it is seen that the MFR shows four turns around the AFR. The dynamic change in the erupting configuration is that its configuration changes from a twisted arch shape to a reversed-γ shape within 75 s at the beginning of the fast rising phase, which represents a transformation from strong twisting to writhing. The reversed-γ-shaped filament and MFR continue their rise as overlying coronal loops also expand and rise. The ensemble rapidly evolves into a three-part CME when observed by COR1 after which AR 11429 displays the observational signatures of a typical eruptive flare consistent with the CSHKP model.
Data were made available courtesy of NASA/SDO and the AIA, EVE, and HMI science teams. We are also grateful to the STEREO and RHESSI teams for public access to calibrated data. We thank our anonymous referee for his/her constructive comments that significantly improved the manuscript. We thank Guiping Zhou, Xiaoshuai Zhu, and Susanta Kumar Bisoi for guiding plotting of three dimension magnetic field. This research was supported by NSFC Grants 11790301 and 11973057 and the National Key R&D Program of China 2018YFA0404602. This work is also supported by ISSI-BJ. Song Feng is supported by the Joint Funds of the National Natural Science Foundation of China (NSFC, U1931107. The National Radio Astronomy Observatory is a facility of the National Science Foundation operated under cooperative agreement by Associated Universities, Inc.