


Abstract
This study presents the mass segregation of 35 Galactic globular clusters (GCs) through the radial profile of the mean mass of main-sequence stars. Most of them are found to be mass segregated due to two-body relaxation effects. The GCs with a larger core to half-mass–radius ratio tend to be less mass segregated. Recent simulations show that energy sources can quench mass segregation in relaxed GCs. Combining mass segregation and core binary fractions (fc), we find a moderate anticorrelation between them when fc is below 0.15. Four GCs that have a small amount of mass segregation are selected as possible intermediate-mass black hole holders. However, none of them are strong candidates considering their half-mass relaxation times.
Export citation and abstract BibTeX RIS
1. Introduction
Globular clusters (GCs) are old and dense star systems found in the Galaxy halo and bulge. They are treated as simple stellar populations with their ages, distances, and chemical compositions determined accurately.
Long-time dynamical evolution has a great impact on the structures of GCs. Due to two-body relaxation effects, heavier objects are inclined to sink toward the core region, while the lighter ones are pushed outward (mass segregation). The typical timescale on which two-body relaxation occurs is around 1–2 Gyr (Meylan & Heggie 1997), which is much shorter than the average age (12 Gyr) of GCs. Massive particles like blue straggler stars (BSSs) are used to measure mass segregation levels, since they are most efficiently influenced. As expected, many GCs are shown to be strongly mass segregated through the distribution of BSSs (Ferraro et al. 2018). However, evidence of weak mass segregation is found in ω Centauri, NGC 2419, NGC 5466, NGC 6101, Pal 14, Ter 8, and Arp 2 (Ferraro et al. 2006; Dalessandro et al. 2008, 2015; Beccari et al. 2015, 2011; Salinas et al. 2012). The long half-mass relaxation times of these clusters suggest that they might need more time to evolve to be mass segregated.
The N-body simulations show that mass segregation in GCs can be quenched by the dynamical effects of a central intermediate-mass black hole (IMBH), primordial binaries, and a stellar-mass black hole subsystem. The IMBH is expected to be in a multiple system with numerous other massive objects during its lifetime (Bahcall & Wolf 1976). When massive main-sequence (MS) stars sink to the core region, they are probably scattered away because of an encounter with the IMBH and any companion it has (Baumgardt et al. 2004). In this way, an IMBH ejects energy into the core region, and mass segregation is blocked. Although GCs with a central IMBH will still become strongly mass segregated after a few half-mass relaxation times, they are expected to be lower in final mass segregation levels than GCs without an IMBH (Baumgardt et al. 2004; Gill et al. 2008). Primordial binaries are similar to an IMBH in quenching mass segregation (Gill et al. 2008; Beccari et al. 2010). An N-body simulation of Peuten et al. (2016) found that the low mass segregation level of NGC 6101 can be explained by varying the retention fraction of stellar-mass black holes. Therefore, mass segregation can be a possible indicator of IMBHs, primordial binaries, and stellar-mass black hole subsystems in the Galactic GCs.
Searching for the IMBH by mass segregation has already been applied to several GCs. Objects NGC 2298 and NGC 6254 are studied through the radial profiles of the mean mass of MS stars (Pasquato et al. 2009; Beccari et al. 2010), NGC 2298 is unlikely to be an IMBH holder, and NGC 6254 will be a possible candidate if the core binary fraction is below 3%. However, it has a core binary fraction of 7.8% (Milone et al. 2012). Goldsbury et al. (2013) measured the mass segregation of 54 GCs by fitting the King–Michie model core radii with stars of different mass bins. Considering the core binary fractions and half-mass relaxation times of those clusters, there is still no strong candidate for a central IMBH holder (Pasquato et al. 2016).
In this paper, we investigate the mass segregation of 35 GCs in the Advanced Camera for Surveys (ACS) Treasury Survey 3 by the radial profile of the mean mass of MS stars. This paper is organized as follows. In Section 2, the ACS Treasury Survey data used to derive the mass segregation of Galactic GCs are introduced. The measurement methods and results are shown in Section 3. The relationship of the core binary fraction and mass segregation is studied in Section 4. Then, we select several weakly mass-segregated GCs and compare our results to previous research in Section 5. Finally, conclusions are made in Section 6.
2. Observation Data
The photometric data adopted in this paper come from a high-resolution Hubble Space Telescope program named the Globular Cluster ACS Treasury Survey (Sarajedini et al. 2007). The data have been obtained through the F606W and F814W filters with the ACS Wide Field Channel (WFC). This ACS/WFC imaging survey reaches an MS star mass of 0.2 M⊙ with a signal-to-noise ratio S/N ≥ 10, which ensures deep and cleaned color–magnitude diagrams (CMDs) for all target GCs. With the wide field view of the camera (3 4 × 34), we can get the radial profile of the mean mass of MS stars from core to half-mass–radius for some clusters.
Clusters are selected through two main standards: (1) the observation region extends to 0.7 rhm (half-mass–radius), and (2) the CMD can be fitted well without a large deviation. We remove GCs with evidence of large (ΔY > 0.1) helium variation (ω Centauri, NGC 2808, NGC 6838, NGC 6441) according to Sollima & Baumgardt (2017). Also rejected is M54, considering the heavy contamination of Sagittarius dwarf galaxy stars. Because of the lack of necessary artificial star catalogs, NGC 0362 is excluded, and NGC 1851 is excluded due to the lack of enough observed star points in the central region. We discard NGC 5286 and NGC 7089 because of the very low completeness in the core regions. Due to the irregular field of view, NGC 6496 is rejected, and NGC 6535 is located toward the Milky Way center (at l = 27 18, b = 1044) and heavily influenced by severe field contamination. Because its CMD suffers from the contamination of bulge stars and cosmic rays, NGC 6717 is excluded. Finally, we abandon the bad radial profile of the mean mass of MS stars of NGC 5024.
3. Method and Results
3.1. Method
The GC mass segregation can be quantified by fitting the King–Michie model core radii with stars of different mass bins (Goldsbury et al. 2013); stellar mass function slopes α (Paust et al. 2010; Sollima & Baumgardt 2017); radial distributions of BSSs, red giant branch (RGB) stars, etc. (Dalessandro et al. 2015; Ferraro et al. 2018); and radial profile of the mean mass of MS stars 〈m〉MS (Pasquato et al. 2009; Beccari et al. 2010). The first three methods have extensive coverage of the Galactic GCs, while the last one is only applied to a couple of them (NGC 6254, NGC 2298). Considering that 〈m〉MS has been used to demonstrate the quenching effects of the IMBH and primordial binaries on mass segregation in N-body simulation (Gill et al. 2008), it is worth exploring further.
We will show the steps to obtain 〈m〉MS through the example of NGC 5466.
- (1)The masses of visible stars are converted from apparent magnitudes by the mass–luminosity relation of a suitable isochrone. The Dartmouth Stellar Evolution Database is used in the isochrone fitting (Dotter et al. 2007, 2008). The isochrone age, metallicity, α-element value, distance module, and reddening are listed in Dotter et al. (2009) for each cluster. Figure 1 shows the isochrone line and mass-to-light relationship of NGC 5466.
- (2)Selecting MS stars. We create 10 magnitude groups along the MS in Figure 1. The masses of the stars in the groups range from 0.2 to 0.8 M⊙. The standard deviation of the star colors in each group is obtained as σ. Only objects that fall within ±1.5σ are included. However, limited by the completeness function and observation limiting magnitude, a higher lower mass limit of 0.3 M⊙ is chosen for some GCs (NGC 5904, NGC 6093, etc.), and even higher for Pal 1, Pal 12, and Ter 7. It could result in an underestimation of mass segregation. We provide a detailed discussion of the discrimination caused by the choice of a different mass range of MS stars in Section 3.2.
- (3)Obtaining the completeness function f(mi , ri ). The ACS survey provides artificial star catalogs for all clusters in this study. A detailed description of the artificial star test and completeness function generation method can be found in Anderson et al. (2008). Typically, an artificial star is considered to be recovered if the input and output positions agree within 0.5 pixel and the instrumental magnitudes agree within 0.75 mag. The output fluxes are also provided in the form of Vega magnitude, allowing the construction of completeness as a function of stellar mass. The completeness of NGC 5466 is shown in Figure 2.
- (4)We apply the completeness correction and get the mean mass of MS stars through Equation (1):
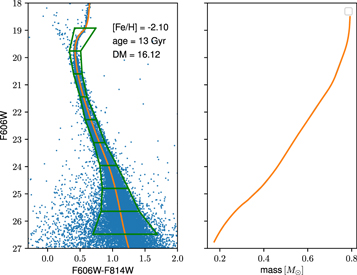
Figure 1. The (V, V – I) CMD and mass-to-light relationship of NGC 5466. In the left panel, the solid yellow line is the isochrone of NGC 5466 with [Fe/H] = −2.1, age = 13 Gyr, DM = 16.12. Stars located inside the green boxes are selected.
Download figure:
Standard image High-resolution image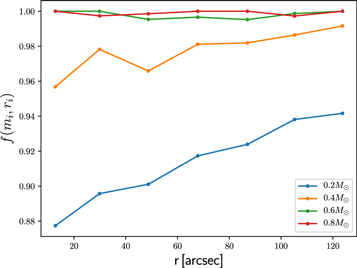
Figure 2. Photometric completeness f as a function of the distance to the center for different stellar masses of NGC 5466.
Download figure:
Standard image High-resolution imageFigure 3 displays the annuli where the mean mass of MS stars and the average distance to the center point are obtained. The measurement results are shown in Figure 4. Errors of 〈m〉MS(r) are obtained by a bootstrap method like Pasquato et al. (2009). Here ![${[{M}_{i}]}_{i=1,N}$](https://content.cld.iop.org/journals/0004-637X/908/2/224/revision2/apjabd6b8ieqn1.gif) is the catalog of MS star masses in an annulus, and
is the catalog of MS star masses in an annulus, and ![${[{N}_{j}]}_{j=1,N}$](https://content.cld.iop.org/journals/0004-637X/908/2/224/revision2/apjabd6b8ieqn2.gif) is an integer catalog generated from a random sample of a uniform distribution U(1, N). A new synthetic catalog of star masses is defined as
is an integer catalog generated from a random sample of a uniform distribution U(1, N). A new synthetic catalog of star masses is defined as ![${[{M}_{{N}_{j}}]}_{j=1,N}$](https://content.cld.iop.org/journals/0004-637X/908/2/224/revision2/apjabd6b8ieqn3.gif) . A hundred synthetic catalogs are constructed in the same way. The standard deviation of 〈m〉MS(r) of the 100 synthetic catalogs is defined as the 1σ error for that annulus.
. A hundred synthetic catalogs are constructed in the same way. The standard deviation of 〈m〉MS(r) of the 100 synthetic catalogs is defined as the 1σ error for that annulus.
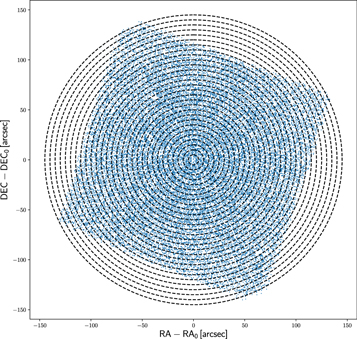
Figure 3. Observation map of NGC 5466 used in this study. The concentric circles define the annuli where the mean mass of MS stars and the average distance to the center point are obtained.
Download figure:
Standard image High-resolution image
Figure 4. The radial profile of the mean mass of MS stars of NGC 5466. This result shows that NGC 5466 has a small amount of mass segregation. Considering the large Trh (7.76 Gyr) of this cluster, NGC 5466 may still need time to become strongly mass segregated.
Download figure:
Standard image High-resolution imageMass segregation of NGC 5466 in this paper is defined as the difference of 〈m〉MS between the inside (rinside) and outside (0.7rhm or rhm) radii. The rhm of NGC 5466 is provided as 190'' in Baumgardt & Hilker (2018). In this study, rinside is defined as 0.07 rhm. The difference of 〈m〉MS between rinside and 0.7rhm is 0.010 M⊙ for NGC 5466. Such evidence of a low mass segregation level can also be found in the radial distributions of different stellar populations. The RGB, horizontal branch (HB), and MS stars and BSSs are selected and their cumulative radial distributions are shown in Figure 5. The radial distribution of RGB stars is compared to those of three other stellar populations by a Kolmogorov–Smirnov test. The p-values are found to be pMS/RGB = 0.54, pBSS/RGB = 0.76, and pHB/RGB = 0.04. From the obtained p-values, we can conclude that no significant differences exist in the radial distributions of RGB and MS star and BSS populations.
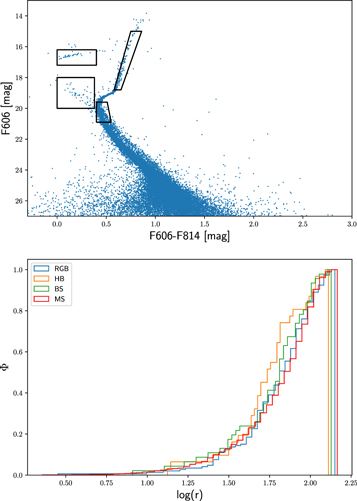
Figure 5. The top panel is a view of the NGC 5466 (V, V – I) CMD with selection boxes of RGB, HB, and MS stars and BSSs. The bottom panel is the cumulative radial distributions of the four star populations. The RGB and MS stars and BSSs are distributed similarly regardless of their different masses, which suggests that NGC 5466 is a weakly mass-segregated GC.
Download figure:
Standard image High-resolution image3.2. Mass Segregation Results
Thirty-five GCs are included in our sample with Δm(0.7rhm) (〈m〉(rinside) − 〈m〉(0.7rhm)) obtained. Larger Δm(0.7rhm) means more mass segregation. The lower mass limit of selected MS stars is chosen as 0.2 M⊙ if the completeness of low-mass stars (0.2 M⊙) around the inside radius is larger than 10%. The levels of completeness for most of the GCs in Table 1 are larger than 30%, except for NGC 6584, NGC 6723, NGC 6752, and NGC 7099. The completeness of low-mass stars (0.2 M⊙) around the inside radius is about 10% for the four clusters. The GCs of Table 2 have a lower mass limit of 0.3 M⊙. The completeness of low-mass stars (0.3 M⊙) around the inside radius is about 10% for the clusters in Table 2, except for NGC 4147 and NGC 6981. Those two clusters have a good completeness, but the mass of the star represented by the observation limiting magnitude (26.5 mag) is larger than 0.2 M⊙. The mass range of selected MS stars is 0.4 M⊙ ≤ m ≤ 0.9 M⊙ for the GCs in Table 3. The mass of the MS turnoff star of the three clusters is larger than 0.8 M⊙.
Table 1. Mass Segregation and Dynamical Parameters of 15 GCs (0.2 M⊙ ≤ m ≤ 0.8 M⊙)
| Name |

|

|

|

| fc a | Age b | Trh c |
|---|---|---|---|---|---|---|---|
| (M⊙) | (M⊙) | (M⊙) | (M⊙) | (Gyr) | (Gyr) | ||
| NGC 288 | 0.033 ± 0.015 | 0.026 ± 0.015 | 0.112 | 12.50 | 3.50 | ||
| NGC 2298 | 0.082 ± 0.007 | 0.061 ± 0.006 | 0.097 ± 0.007 | 0.054 ± 0.011 | 0.154 | 13.00 | 0.52 |
| NGC 4590 | 0.071 ± 0.006 | 0.049 ± 0.006 | 0.114 | 12.00 | 3.40 | ||
| NGC 4833 | 0.047 ± 0.008 | 0.031 ± 0.006 | 0.066 | 12.50 | 2.00 | ||
| NGC 5466 | 0.010 ± 0.012 | 0.009 ± 0.013 | 0.142 | 13.00 | 7.76 | ||
| NGC 6144 | 0.055 ± 0.014 | 0.036 ± 0.016 | 0.132 | 12.75 | 1.35 | ||
| NGC 6171 | 0.060 ± 0.009 | 0.051 ± 0.008 | 0.186 | 12.00 | 0.81 | ||
| NGC 6218 | 0.066 ± 0.011 | 0.050 ± 0.010 | 0.114 | 13.00 | 0.95 | ||
| NGC 6254 | 0.055 ± 0.008 | 0.047 ± 0.004 | 0.078 | 11.75 | 1.48 | ||
| NGC 6352 | 0.068 ± 0.008 | 0.040 ± 0.007 | 0.184 | 10.75 | 0.98 | ||
| NGC 6584 | 0.107 ± 0.007 | 0.076 ± 0.006 | 0.118 ± 0.007 | 0.087 ± 0.006 | 0.090 | 11.75 | 1.18 |
| NGC 6723 | 0.064 ± 0.006 | 0.044 ± 0.004 | 0.076 ± 0.007 | 0.053 ± 0.005 | 0.062 | 12.50 | 1.45 |
| NGC 6752 | 0.152 ± 0.012 | 0.107 ± 0.011 | 0.034 | 12.50 | 1.40 | ||
| NGC 6779 | 0.096 ± 0.007 | 0.062 ± 0.005 | 0.113 ± 0.007 | 0.096 ± 0.007 | 0.100 | 12.75 | 1.38 |
| NGC 7099 | 0.194 ± 0.004 | 0.130 ± 0.004 | 0.202 ± 0.006 | 0.142 ± 0.005 | 0.070 | 13.00 | 1.70 |
Notes.
a Here fc is the core binary fraction cited from Milone et al. (2012) and Ji & Bregman (2015). b The ages of the GCs are provided by VandenBerg et al. (2013). c Here Trh is the half-mass relaxation time cited from Baumgardt & Hilker (2018).Download table as: ASCIITypeset image
Table 2. Mass Segregation and Dynamical Parameters of 17 GCs (0.3 M⊙ ≤ m ≤ 0.8 M⊙)
| Name |
 a
a
|

|

| fc | Age | Trh |
|---|---|---|---|---|---|---|
| (M⊙) | (M⊙) | (M⊙) | (Gyr) | (Gyr) | ||
| NGC 1261 | 0.183 ± 0.010 | 0.126 ± 0.010 | 0.134 ± 0.011 | 0.046 | 10.75 | 2.04 |
| NGC 4147 | 0.160 ± 0.006 | 0.110 ± 0.006 | 0.122 ± 0.007 | 0.262 | 12.25 | 0.41 |
| NGC 5272 | 0.158 ± 0.004 | 0.109 ± 0.004 | 0.117 ± 0.004 | 0.054 | 11.75 | 2.50 |
| NGC 5904 | 0.176 ± 0.006 | 0.121 ± 0.006 | 0.073 | 11.50 | 2.50 | |
| NGC 5927 | 0.121 ± 0.012 | 0.084 ± 0.012 | 0.095 ± 0.012 | 0.104 | 10.75 | 2.40 |
| NGC 5986 | 0.139 ± 0.005 | 0.096 ± 0.005 | 0.110 ± 0.006 | 12.25 | 1.70 | |
| NGC 6093 | 0.285 ± 0.004 | 0.195 ± 0.004 | 0.206 ± 0.003 | 13.50 | 0.48 | |
| NGC 6205 | 0.066 ± 0.006 | 0.047 ± 0.006 | 0.061 ± 0.007 | 0.100 | 12.00 | 2.63 |
| NGC 6341 | 0.222 ± 0.003 | 0.152 ± 0.003 | 0.155 ± 0.003 | 0.023 | 12.75 | 1.82 |
| NGC 6541 | 0.228 ± 0.002 | 0.156 ± 0.002 | 0.161 ± 0.003 | 0.054 | 12.50 | 1.35 |
| NGC 6624 | 0.182 ± 0.011 | 0.125 ± 0.011 | 0.137 ± 0.011 | 11.25 | 0.31 | |
| NGC 6637 | 0.170 ± 0.006 | 0.117 ± 0.006 | 0.131 ± 0.006 | 0.124 | 11.00 | 0.20 |
| NGC 6652 | 0.199 ± 0.006 | 0.137 ± 0.006 | 0.147 ± 0.006 | 0.344 | 11.25 | 0.87 |
| NGC 6681 | 0.195 ± 0.004 | 0.134 ± 0.004 | 0.145 ± 0.004 | 12.25 | 0.59 | |
| NGC 6934 | 0.220 ± 0.003 | 0.151 ± 0.003 | 0.162 ± 0.004 | 11.75 | 1.95 | |
| NGC 6981 | 0.038 ± 0.006 | 0.028 ± 0.006 | 0.041 ± 0.005 | 0.098 | 11.50 | 1.70 |
| NGC 7078 | 0.271 ± 0.011 | 0.185 ± 0.011 | 0.208 ± 0.011 | 0.028 | 12.75 | 1.30 |
Note.
a Here is obtained from
  by Equation (2).
Download table as: ASCIITypeset image
Table 3. Mass Segregation and Dynamical Parameters of Three GCs (0.4 M⊙ ≤ m ≤ 0.9 M⊙)
| Name |

|

| fc | Age | Trh |
|---|---|---|---|---|---|
| (M⊙) | (M⊙) | (Gyr) | (Gyr) | ||
| Pal 1 | 0.12 ± 0.004 | 0.666 | 9.00 | 0.72 | |
| Pal 12 | 0.031 ± 0.019 | 0.060 ± 0.023 | 0.260 | 9.00 | 1.35 |
| Ter 7 | 0.071 ± 0.010 | 0.088 ± 0.010 | 0.374 | 8.00 | 2.88 |
Download table as: ASCIITypeset image
Mass segregation measured from a higher lower mass limit is usually underestimated. Here  is defined as the mass segregation obtained from the lower mass limit of 0.2 M⊙, and
  is the mass segregation of the lower mass limit of 0.3 M⊙. To figure out the variations (
 ), the mass segregation of the two different lower mass limits is obtained for GCs in Table 1. The mean mass of MS stars will go down in both rinside and routside when a lower mass limit of 0.2 M⊙ is adopted. For strongly mass-segregated GCs, their core regions have a relatively smaller fraction of low-mass stars. The choice of a lower-mass standard like 0.2 M⊙ has few effects on 〈m〉(rinside) but affects 〈m〉(0.7rhm) heavily. In this paper, mass segregation is defined as the difference of the mean mass of MS stars between rinside and routside. Therefore, GCs with a larger amount of mass segregation are usually more heavily influenced. This tendency can be found in Figure 6, where the variation of mass segregation is shown as a function of
  . A linear regression is applied to describe this tendency in Equation (2):

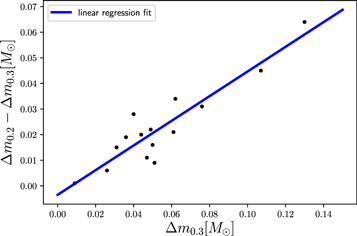
Figure 6. Mass segregation variations vs.  for the GCs in Table 1. The solid line is the least-squares regression. Strongly mass-segregated clusters tend to have a large variation due to the small proportion of low-mass stars in their core regions.
Download figure:
Standard image High-resolution imageTo offset the underestimation caused by the higher lower mass limit,  is inferred from Equation (2) for GCs in Table 2. The lack of enough Δ
m(rhm) in Table 1 prevents us from obtaining a relation between
is inferred from Equation (2) for GCs in Table 2. The lack of enough Δ
m(rhm) in Table 1 prevents us from obtaining a relation between  and
and  like Equation (2). We will use the inferred
  hereafter. However, it is hard to optimize the results of Pal 1, Pal 12, and Ter 7 because the three clusters have a larger mass of MS turnoff stars. Therefore, Pal 1, Pal 12, and Ter 7 will be excluded in the following discussion.
Most of the GCs are mass segregated, since their ages are much larger than the half-mass relaxation times. Our results are compared to previous studies of the segregation level. Lanzoni et al. (2016) and Ferraro et al. (2018) introduced  , defined as an area enclosed between the cumulative radial distribution of BSSs and that of a reference population like MS stars to describe the BSS central segregation level. Weatherford et al. (2020) used ΔA
, which is the difference in area under the cumulative radial distributions of two star populations, to measure the segregation level of a cluster. Although different parameters are used in describing the mass segregation, the positive correlations displayed in Figure 7 show that they behave similarly.
, defined as an area enclosed between the cumulative radial distribution of BSSs and that of a reference population like MS stars to describe the BSS central segregation level. Weatherford et al. (2020) used ΔA
, which is the difference in area under the cumulative radial distributions of two star populations, to measure the segregation level of a cluster. Although different parameters are used in describing the mass segregation, the positive correlations displayed in Figure 7 show that they behave similarly.

Figure 7. Mass segregation parameter Δm(0.7rhm) vs.  (top) and ΔA
(bottom). Here Rs
is the Spearman correlation coefficient. Because of the large deviation of ΔA
, NGC 6624 is not included in the bottom panel.
(top) and ΔA
(bottom). Here Rs
is the Spearman correlation coefficient. Because of the large deviation of ΔA
, NGC 6624 is not included in the bottom panel.
Download figure:
Standard image High-resolution imageMass segregation is a dynamical process influenced by energy sources like an IMBH and binaries. Trenti et al. (2007a) found that the effective energy generation of an IMBH and primordial binaries could result in a large core to half-mass–radius ratio (rc /rhm). The scatter plot of rc /rhm against Δm(0.7rhm) shown in Figure 8 suggests that GCs having a larger rc /rhm tend to be less mass segregated. The existence of energy sources may explain such a tendency, which can expand the core radius and quench mass segregation simultaneously. However, some GCs may have a large initial rc /rhm, and their core-collapse phase has not ended. Therefore, it is better to exclude GCs that are not completely dynamically evolved. The typical timescale on which the core of a GC evolves toward a quasi-steady state is of the order of 10 Trh(0) (initial half-mass relaxation time; Trenti et al. 2007b). However, the observation data can only provide the current Trh, which might be smaller than Trh(0) if the GCs have lost a large fraction of their initial mass. To ensure that the cluster is completely dynamically old, Trenti (2006) used a criterion of current Trh < 0.5 Gyr. Only four clusters in our sample satisfy this criterion, which prevents us from making any further progress.

Figure 8. Shown is rc /rhm vs. mass segregation parameter Δm(0.7rhm). The solid line shows the linear fit to all points, and Rs is the Spearman correlation coefficient. The GC of larger rc /rhm tends to be less mass segregated. However, an outlier like NGC 6218 exists, which is small in rc /rhm but not as mass segregated as other similar clusters.
Download figure:
Standard image High-resolution image4. Binary Stars
Binary stars play an important role in GC dynamical evolution. Inelastic collision between the binary and single stars can be a heating source, which provides energy to against the gravothermal collapse (Gao et al. 1991; Fregeau et al. 2003). The dynamical influence tends to saturate for fb ≈ 0.1 (Vesperini & Chernoff 1994; Heggie et al. 2006). An N-body simulation shows that mass segregation, which can be defined as the difference of the mean mass of MS stars between the inside and outside radii, will be reduced when primordial binaries are included (Gill et al. 2008; Beccari et al. 2010). Therefore, an anticorrelation between binary fraction and mass segregation is expected, at least in GCs of small binary fractions.
Pasquato et al. (2016) investigated the relation of mass segregation and fc based on the results of Goldsbury et al. (2013). Parameter B, which describes how much the concentration of stars changes with their mass, was chosen as a measurement of mass segregation. If B is zero, all of the stars are distributed equally, and mass segregation is absent. A smaller B means more mass segregation. Figure 9 shows an anticorrelation of binary fractions and parameter B from Pasquato et al. (2016). They suspected that it is caused by the sink of heavy binaries in mass-segregated GCs. However, the Spearman correlation coefficient is obtained as −0.15, which means that the correlation shown in Figure 9 is not actually very significant.
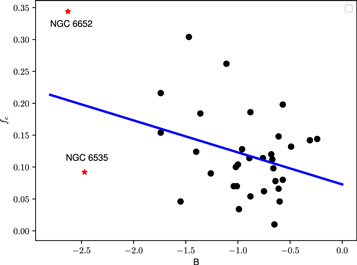
Figure 9. Core binary fractions vs. mass segregation parameter B in Pasquato et al. (2016). The solid blue line is the least-squares linear regression fitting result without two outliers. However, this relation is very ambiguous, as the Spearman correlation coefficient is −0.15.
Download figure:
Standard image High-resolution imageParameter B focuses on the difference of the normalized projected density distribution shapes of stars belonging to different mass bins. Here Δm represents the difference of the mean mass of MS stars between different regions of a cluster. Mass segregation obtained from these two methods could be slightly different. Considering that Δm has shown its ability to reveal the quenching effects of energy sources in N-body simulations, we think that Δm would be a better choice for studying afterward.
Due to the absence of Δm(rhm) in several clusters, we choose Δm(0.7rhm) as the mass segregation parameter. A Spearman rank order test is applied to see whether a strong correlation exists between Δm(0.7rhm) and fc in Figure 10. The correlation coefficient is obtained as −0.37, which suggests that there is no significant monotonic relation in the whole sample. We suspect that it is caused by GCs of large fc , since the mass segregation of these clusters might be insensitive to binary fractions.
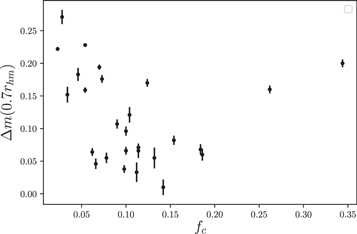
Figure 10. The Δm(0.7rhm) vs. core binary fractions fc of 27 GCs. The Spearman correlation coefficient is −0.37, which means that no significant relation exists in the whole sample.
Download figure:
Standard image High-resolution imageTo figure out whether a significant correlation exists in GCs of small fc , f0 is introduced as a truncation parameter. The GCs are excluded if fc is larger than f0. The absolute correlation coefficients are displayed as a function of f0 in Figure 11. We can find that the absolute coefficient increases with the exclusion of GCs having a large fc . Figure 12 shows the linear regression fitting result of 22 clusters when f0 is 0.15. The correlation coefficient is obtained as −0.61, which suggests a moderate anticorrelation between mass segregation and fc in GCs of small binary fractions.
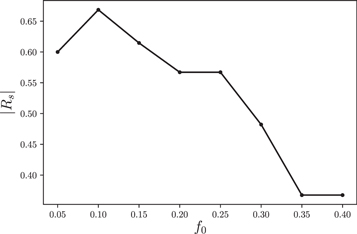
Figure 11. Absolute correlation coefficient vs. f0.
Download figure:
Standard image High-resolution image
Figure 12. The Δm(0.7rhm) vs. core binary fractions fc of 22 GCs. The fc of these clusters is smaller than 0.15. The solid blue line is the least-squares linear regression, and the Spearman correlation coefficient is obtained as −0.61.
Download figure:
Standard image High-resolution image5. Weakly Mass-segregated GCs
Mass segregation of a GC usually evolves toward a rarely changed value on a timescale of 5 Trh(0). The final mass segregation level is influenced by many factors, such as an IMBH, primordial binaries, stellar-mass black holes, etc. In the N-body simulation of Gill et al. (2008), the existence of a central IMBH could quench mass segregation and keep Δm(rhm) ≤ 0.09 M⊙. Therefore, a relaxed but weakly mass-segregated GC would be a potential candidate that harbors a central IMBH. However, primordial binaries could also result in a low mass segregation level like an IMBH. Primordial binaries usually have a weaker quenching effect when compared to a central IMBH. The final mass segregation level of a GC influenced by numerous primordial binaries alone is usually less than 0.10 M⊙ but more than 0.07 M⊙. To rule out the factor of binaries, a better criterion is Δm(rhm) ≤ 0.07 M⊙. Any cluster satisfying the following two criteria will be viewed as a possible IMBH holder.
- (1)It has a small amount of mass segregation, with Δm(rhm) ≤ 0.070 M⊙. Considering that some clusters in our sample lack the result of Δ m(rhm), an alternative is used where Δ m(0.7rhm) is smaller than 0.049 M⊙.
- (2)The cluster age is five times more than Trh(0). Considering the average age of the Galactic GCs (12 Gyr), Trh(0) should be smaller than 2.4 Gyr. However, as we mentioned before, the observation data can only provide the current Trh, which is usually smaller than Trh(0) due to mass evaporation in GCs. Therefore, a stricter criterion is adopted where the current Trh is less than 1.5 Gyr. This criterion leaves room for a mass-loss fraction of the initial mass as high as 50%.
The two selection standards will help us find possible IMBH holders in dynamically relaxed GCs. However, for clusters that have a large Trh like ω Centauri, the reason for the low level of mass segregation could be simply that they need more time to evolve to be strongly mass segregated. It is hard to determine whether a central IMBH works as a quenching factor or not in such clusters.
Table 4 lists the dynamical parameters of the four weakly mass-segregated GCs that satisfy the first criterion. Figure 13 shows the radial profiles of the mean mass of MS stars of these clusters. The GCs under strong effects of extra tidal fields may have a large fraction of mass loss during the dynamical evolution, which means that Trh(0) would be much larger than the current Trh. Object NGC 288 experiences strong tidal shocks. It has an extra tidal clump structure up to 180 pc (Piatti 2018). Object NGC 5466 has a 45◦ tidal tail detected in Grillmair & Johnson (2006). Taking Trh and extra tidal field influence into consideration, the GCs in Table 4 may still need time to achieve the final mass segregation level. A central IMBH is not necessary for explaining the low mass segregation levels of these clusters.

Figure 13. Radial profiles of the mean mass of MS stars for GCs in Table 4.
Download figure:
Standard image High-resolution imageTable 4. Mass Segregation and Dynamical Parameters of the Four Weakly Mass-segregated GCs
| Name | Δm(0.7rhm) | fc | Trh |
|---|---|---|---|
| (M⊙) | (Gyr) | ||
| NGC 288 | 0.033 ± 0.015 | 0.112 | 3.50 |
| NGC 4833 | 0.047 ± 0.008 | 0.026 | 2.00 |
| NGC 5466 | 0.010 ± 0.012 | 0.142 | 7.76 |
| NGC 6981 | 0.038 ± 0.006 | 0.098 | 1.70 |
Download table as: ASCIITypeset image
Previous works also discussed the possibility that some GCs in Table 4 have a central IMBH. Lützgendorf et al. (2013) studied the IMBH effects on GCs in tidal fields through N-body simulation. Objects NGC 288 and NGC 5466 are considered as the best candidates for the existence of a central IMBH, and NGC 4833 is supposed to be a potential sample that harbors an IMBH in Sedda et al. (2019).
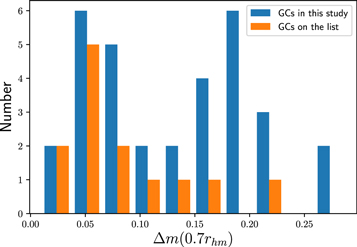
Recent research has found that stellar-mass black holes have a similar quenching effect on mass segregation. By varying the stellar-mass black hole retention fraction, the sign of weak mass segregation in NGC 6101 can be explained (Peuten et al. 2016). Askar et al. (2018) selected 29 GCs that may have a stellar-mass black hole subsystem from 140 Galactic GCs. One interesting thing is that all of the weakly mass-segregated GCs in Table 4 are on the list. Figure 14 shows the segregation level of the 13 GCs on the list. The mean Δ m(0.7rhm) of the 13 GCs is 0.082 M⊙, while this value is 0.162 M⊙ for the other 19 GCs in this study. Obviously, those 13 GCs are clustered at the lower end of the mass segregation distribution. It is possible that a high stellar-mass black hole retention fraction results in a lack of mass segregation rather than an IMBH.
Figure 14. The yellow histogram shows the Δ m(0.7rhm) distribution of 13 GCs on the list of Askar et al. (2018). Most of them are located at the lower end of the mass segregation distribution.
Download figure:
Standard image High-resolution image
6. Conclusions
In this paper, we studied the mass segregation of 35 Galactic GCs by the radial profile of the mean mass of MS stars. Mass segregation in this study is defined as the difference of 〈m〉MS between the inside (0.07rhm) and the outside (0.7rhm or rhm) radii. Most of the GCs are mass segregated, since their ages are much larger than Trh.
We find that GCs with a larger core to half-mass–radius ratio tend to be less mass segregated. Energy sources may explain this anticorrelation because they can expand the core radius and quench mass segregation simultaneously. However, some clusters are probably not completely dynamically old considering their Trh. The reason for GCs that have a small amount of mass segregation and a large rc /rhm may be that they are dynamically young. A larger data sample that includes enough dynamically old GCs is needed for further study.
A moderate anticorrelation is found between Δm and core binary fractions when fc is below 0.15. A possible interpretation is that binary stars have a quenching effect on mass segregation, as shown in Gill et al. (2008) and Beccari et al. (2010).
In this study, most of the GCs are mass segregated with Δm(0.7rhm) > 0.049 M⊙. Four weakly mass-segregated GCs are selected. However, considering their Trh, none of them are strong candidates that hold a central IMBH.
This study links mass segregation to the IMBH, binaries, and stellar-mass black hole subsystem. The quenching effect of energy sources makes mass segregation a possible indicator of them. Although it is indirect evidence, mass segregation can provide possible candidates for follow-up observation. Our study involves only a small part of the Galactic GCs listed in Harris (1996). Further studies including more GCs, especially dynamically old GCs, will help us construct a clearer correlation of mass segregation and energy sources. However, the lack of precise GC photometry data will be a large problem.
This study is supported by the National Natural Science Foundation of China under grant Nos. 11988101 and 11890694 and National Key R&D Program of China No. 2019YFA0405502.