


Abstract
The search for life in the universe mainly uses modern Earth as a template. However, we know that Earth's atmospheric composition changed significantly through its geological evolution. Recent discoveries show that transiting, potentially Earthlike, exoplanets orbit a wide range of host stars, which strongly influence their atmospheric composition and remotely detectable spectra. Thus, a database for transiting terrestrial exoplanets around different host stars at different geological times is a crucial missing ingredient to support observational searches for signs of life in exoplanet atmospheres. Here, we present the first high-resolution transmission spectra database for Earthlike planets, orbiting a wide range of host stars, throughout four representative stages of Earth's history. These correspond to a prebiotic high-CO2 world—about 3.9 billion years ago in Earth's history—and three epochs through the increase in oxygen from 0.2% to modern atmospheric levels of 21%. We demonstrate that the spectral biosignature pairs O2+CH4 and O3+CH4 in the atmosphere of a transiting Earthlike planet would show a remote observer that a biosphere exists for oxygen concentrations of about 1% of modern Earth's—corresponding to about 1–2 billion years ago in Earth's history—for all host stars. The full model and high-resolution transmission spectra database, covering 0.4–20 μm, for transiting exoplanets—from young prebiotic worlds to modern Earth analogs orbiting a wide range of host stars—is available online. It is a tool to plan and optimize our observation strategy, train retrieval methods, and interpret upcoming observations with ground- and space-based telescopes.
Export citation and abstract BibTeX RIS
1. Introduction
The discovery of thousands of exoplanets has uncovered the wide range of both stellar hosts, as well as ages of potential Earthlike planets (e.g., Kaltenegger & Sasselov 2011; Kane et al. 2016; Johns et al. 2018; Berger et al. 2018). The diversity keeps increasing with new discoveries by NASA's Transiting Exoplanet Survey Satellite mission (see, e.g., Quintana et al. 2014; Kaltenegger et al. 2019b) and ground-based searches like MEarth, SPECULOOS, and CARMENES (e.g., Nutzman & Charbonneau 2008; Gillon et al. 2017; Kaltenegger et al. 2019a; Luque et al. 2019). Future ground-based extremely large telescopes (ELTs) as well as the James Webb Space Telescope (JWST) are designed to obtain the first measurements of the atmospheric composition of Earth-sized planets (see, e.g., Snellen et al. 2013; Rodler & Lopez-Morales 2014; Ben-Ami et al. 2018; Batalha et al. 2018; Serindag & Snellen 2019).
While we expect a large variety of rocky planets with alternative evolutionary paths from Earth, our planet's atmosphere, which has evolved significantly since formation (see, e.g., Zahnle et al. 2007; Lyons et al. 2014), provides the only template of a habitable rocky planet's evolution to date.
Previous work by the authors investigated the changes in the reflection and emission spectra of Earthlike planets through geological time orbiting different host stars based on atmospheric models of Earth through its geological history from anoxic to modern Earth (for details see Kaltenegger et al. 2007; Rugheimer & Kaltenegger 2018). These models showed that a remote observer could identify a biosphere for about 2 billion years in Earth's history in emission and reflection. The spectra presented in those papers provide templates for observation of directly imaged worlds as well as planets seen around secondary eclipse, as "Pale Blue Dots." The spectra of a transiting Earth-analog planet through its geological evolution orbiting a Sun-analog star has been modeled and discussed in Kaltenegger et al. (2020).
However, small transiting exoplanets have been found around a wide range of host stars. Because of the change in the emitted stellar energy distribution of a star with its surface temperature, the host star's irradiation has a strong influence on the photochemistry of a rocky planet's atmosphere and its resulting chemical composition (see, e.g., Kasting et al. 1993; Segura et al. 2005; Rauer et al. 2011; Hedelt et al. 2013; Rugheimer et al. 2013; Kaltenegger 2017). To explore the effect of the host star's irradiation on Earthlike planetary atmospheres the authors previously modeled such evolving planets from prebiotic to modern Earth atmospheres around an extensive grid of F0V to M8V stars (Teff = 7000–2400K; see details in Rugheimer et al. 2013, 2015), using Exo-Prime, a 1D climate–photochemistry–radiative transfer model (see, e.g., Rugheimer & Kaltenegger 2018 for details).
Here, we use these atmosphere models to generate the high-resolution transmission database of spectra of Earthlike planets orbiting a wide range of Sun-like host stars at different stages in their evolution, covering the visible to infrared wavelength range (0.4–20 μm). Our transit spectra include climate indicators like H2O and CO2 as well as biosignatures, remotely detectable atmospheric gases that are produced by life and are not readily mimicked by abiotic processes, like the CH4+O2 and CH4+O3 pairs (Lederberg 1965; Lovelock 1965). On short timescales, the two species react to produce CO2 and H2O and therefore must be constantly replenished to maintain detectable concentrations (see, e.g., the review by Kaltenegger 2017). Sagan et al. (1993) analyzed the Galileo probe emergent spectrum of Earth and concluded that the large amount of O2 in the presence of CH4 is strongly suggestive of biology, as Lovelock (1965) and Lederberg (1965) had suggested earlier. It is their quantities and detection along with other atmospheric species in the planetary context that solidify a biological origin (as discussed in detail in several recent reviews, e.g., Kasting et al. 2014; Kaltenegger 2017; Fujii et al. 2018, Schwieterman et al. 2018).
In this article, we present a database of transmission spectra from the visible to the infrared for evolving Earthlike planets orbiting a wide range of Sun-like host stars and identify at what point a remote observer can identify biosignatures in their atmospheres. Section 2 describes the atmospheric composition of terrestrial planets throughout their evolution for a wide range of host stars and Section 3 discusses the high-resolution transit spectra simulations. Section 4 presents our results and Section 5 discusses our results.
Our high-resolution transit spectra database for evolving planets orbiting a wide range of host stars is freely available online (at carlsaganinstitute.org/data and doi:10.5281/zenodo.4029370) as a tool to prioritize targets, prepare effective observation strategies, and to guide first interpretation of atmospheric spectra of Earthlike planets, using our planet's evolution as a template.
2. Atmospheric Models
The four geological epochs we model correspond to a young, prebiotic, high-CO2 world about 3.9 billion years ago (Ga) in Earth's history, and three epochs through the rise of oxygen from 0.2% oxygen, about 1–2 billion years ago in Earth's history, to modern atmospheric levels of 21%.
The CO2-rich atmosphere (epoch 1) represents a prebiotic world around 3.9 Ga. A Paleo- and Mesoproterozoic Earth (about 2 to 1 Ga), when oxygen levels started to rise in Earth's atmosphere, is represented in epoch 2 using 0.21% O2 (1% present atmospheric level (PAL)). Neoproterozoic Earth (about 0.8 to 0.5 Ga) (epoch 3) represents a time period when the oxygen concentration had risen to about 10% PAL (2.1% O2) for Earth, corresponding with the proliferation of multicellular life. Modern Earth is modeled with 21% O2 (epoch 4). The time ranges given in Table 1 for epoch 3 and epoch 4 (see also Kaltenegger et al. 2020) represent the shift to later times for the rise of oxygen in Earth's evolution (see, e.g., Lyones et al. 2014), instead of geological times given in our earlier paper (Kaltenegger et al. 2007), which based O2 concentrations on work by Holland (2006). The models for each epoch are discussed in detail in Rugheimer & Kaltenegger (2018) and summarized in Table 1. Temperature and atmospheric mixing ratios from the model paper are summarized in Figure 1.

Figure 1. Temperature profile and mixing ratios for the major atmospheric gases in our atmospheric models for Earthlike planets around different host stars, representing four epochs through Earth's evolution from a prebiotic atmosphere around 3.9 billion years ago to modern Earth (see Rugheimer & Kaltenegger 2018 for details).
Download figure:
Standard image High-resolution imageTable 1. Surface Mixing Ratios for Major Atmospheric Gases in Our Model Atmospheres for Four Epochs through Earth's Geological History from Prebiotic to Anoxic Atmospheres
| Host Star | Time (Ga) | Solar Constant | Epoch | Tsurf | Surface Mixing Ratio | ||||
|---|---|---|---|---|---|---|---|---|---|
| CO2 | CH4 | O2 | O3 | N2O | |||||
| Sun | now | 1.00 | 4 | 288.1 | 3.55E−04 | 1.60E−06 | 2.10E−01 | 2.41E−08 | 3.00E−07 |
| F0 | now | 1.00 | 4 | 279.8 | 3.55E−04 | 3.40E−06 | 2.10E−01 | 5.00e−08 | 1.80e−07 |
| K7 | now | 1.00 | 4 | 300.2 | 3.55E−04 | 1.30E−04 | 2.10E−01 | 2.40E−08 | 8.60E−07 |
| M8 | now | 1.00 | 4 | 301.9 | 3.55E−04 | 1.00E−03 | 2.10E−01 | 1.60E−09 | 3.10E−06 |
| Sun | 0.5–0.8 | 0.95 | 3 | 302.2 | 1.00E−02 | 4.15E−04 | 2.10E−02 | 2.02E−08 | 9.15E−08 |
| F0 | 0.5–0.8 | 0.95 | 3 | 294.4 | 1.00E−02 | 5.60E−04 | 2.10E−02 | 3.40E−08 | 1.10E−07 |
| K7 | 0.5–0.8 | 0.95 | 3 | 305.7 | 1.00E−02 | 1.20E−02 | 2.10E−02 | 1.20E−08 | 1.60E−07 |
| M8 | 0.5–0.8 | 0.95 | 3 | 284.1 | 1.00E−02 | 1.10E−02 | 2.10E−02 | 2.90E−09 | 8.60E−07 |
| Sun | 1.0-2.0 | 0.87 | 2 | 291.1 | 1.00E−02 | 1.65E−03 | 2.10E−03 | 7.38E−09 | 8.37E−09 |
| F0 | 1.0–2.0 | 0.87 | 2 | 288.2 | 1.00E−02 | 1.20E−03 | 2.10E−03 | 2.40E−08 | 8.30E−09 |
| K7 | 1.0–2.0 | 0.87 | 2 | 288.0 | 1.00E−02 | 2.00E−02 | 2.10E−03 | 5.80E−09 | 4.90E−08 |
| M8 | 1.0–2.0 | 0.87 | 2 | 280.1 | 1.00E−02 | 4.00E−03 | 2.10E−03 | 2.00E−09 | 3.40E−07 |
| Sun | 3.9 | 0.75 | 1 | 290.2 | 1.00E−01 | 1.65E−06 | 1.00E−13 | 2.55E−19 | 0 |
| F0 | 3.9 | 0.75 | 1 | 277.3 | 1.00E−01 | 1.70E−06 | 1.00E−13 | 3.70E−19 | 0 |
| K7 | 3.9 | 0.75 | 1 | 297.4 | 1.00E−01 | 1.70E−06 | 1.00E−13 | 1.20E−19 | 0 |
| M8 | 3.9 | 0.75 | 1 | 300.3 | 1.00E−01 | 1.70E−06 | 1.00E−13 | 7.70E−19 | 0 |
Note. The models are representative of a prebiotic world about 3.9 billion years ago in Earth's history (epoch 1), as well as three models which capture the rise of oxygen from a Neoproterozoic Earth modeled with 0.01 PAL O2 to modern Earth with 21% O2 (see Rugheimer & Kaltenegger 2018).
Download table as: ASCIITypeset image
All our models assume Earth radius and mass. All epochs assume a 1 bar surface pressure, consistent with geological evidence for paleopressures close to modern values or lower (e.g., Som et al. 2012; Marty et al. 2013). Our model planet receives similar irradiation as Earth did during its evolution at 1 au around an evolving Sun. For the Sun we use an evolution model (Claire et al. 2012) while for other host stars, we reduce the overall luminosity by a factor corresponding to the evolution of the Sun (for details see Rugheimer & Kaltenegger 2018). This approach does not account for increased UV activity for young M stars. Note that this procedure is not meant to represent consistent stellar evolution across FGKM stars (as explained in detail in Rugheimer & Kaltenegger 2018). Our models compare planets with the same incident bolometric flux for a wide range of Sun-like host stars for planets with atmospheric compositions and biogenic flux modeled using our Earth's evolution.
The reduction in incident flux for models of earlier epochs around our host star grid also corresponds to planetary models with increased orbital distances from the host stars, a topic we plan to explore in future work. Across host stellar types, the surface UV environment is similar to Earth's through geological time (see O'Malley-James & Kaltenegger 2019; Rugheimer & Kaltenegger 2018) and not a major concern for surface habitability (O'Malley-James & Kaltenegger 2019).
3. Transmission Spectra Models
We model all high-resolution transmission spectra of our planet at steps of 0.01 cm−1 for Earthlike planets orbiting different host stars for four geological epochs with EXO-Prime (for details see Rugheimer & Kaltenegger 2018). The transmission spectra in Figures 2 and 4 are smoothed with a triangular kernel to a resolving power of 300 for clarity. All high-resolution spectra can be downloaded from our online database (resolution λ/Δλ > 100,000 from 0.4 and 10 μm, λ/Δλ > 50,000 from 10 to 20 μm).
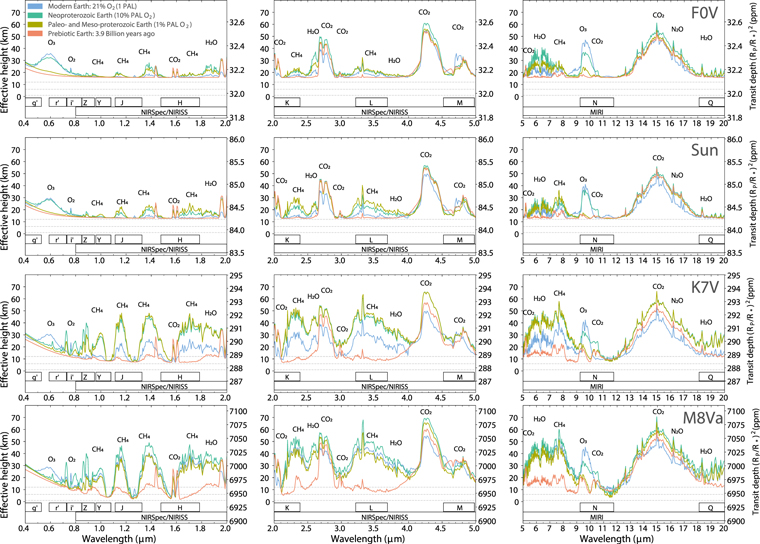
Figure 2. Model spectra for Earth through geological time from 0.4 to 20 μm shown at a resolution of λ/Δλ = 300 for four epochs through Earth's geological time from an anoxic atmosphere 3.9 billion years ago to three models which capture the rise of oxygen levels from 0.01 PAL O2 to 1 PAL (21% O2) on modern Earth, which started around 2.4 billion years ago. We show models for four host stars of our grid (F0, Sun, K7 and M8). High-resolution transit spectra for all grid stars are available online (carlsaganinstitute.org/data and doi:10.5281/zenodo.4029370).
Download figure:
Standard image High-resolution imageEXO-Prime is a 1D iterative climate–photochemistry atmospheric model coupled with a line-by-line radiative transfer code developed for Earth (e.g., Traub & Stier 1976; Traub & Jucks 2002) and adapted to rocky exoplanets (see, e.g., Kaltenegger et al. 2007). EXO-Prime has been validated from the visible to infrared through comparison to Earth seen as an exoplanet by missions like the Mars Global Surveyor, EPOXI, multiple earthshine observations, and Shuttle data (Kaltenegger et al. 2007; Kaltenegger & Traub 2009; Rugheimer et al. 2013). We use opacities from the 2016 HITRAN database (Gordon et al. 2017) for O2, O3, OH, O, H2O, HO2, H2O2, CO2, CO, H2CO, CH4, CH3O2, CH3OOH, CH3Cl, HCl, HOCl, Cl2O2, ClO, ClONO2, SO2, H2S, H2SO4, HSO, HS, H2, H, N2O, NO2, NO3, NO, HNO2, and HNO3. N2O5 (Wagner & Birk 2003) (Sharpe et al. 2004) is included through cross sections. We use measured continua data instead of line-by-line calculations in the far wings for N2, H2O, and CO2 (see Traub & Jucks 2002) and include CO2 line mixing (see also Niro et al. 2005).
Refraction in deeper atmospheric regions of a planet's atmosphere can deflect light away from a distant observer for Earthlike planets (see, e.g., Sidis & Sari 2010; García Muñoz et al. 2012; Betremieux & Kaltenegger 2014; Robinson et al. 2017; Macdonald & Cowan 2019), which sets the lowest level Earth can be probed to in primary transit to about 12 km (e.g., Betremieux & Kaltenegger 2014). For other host stars the depth varies from F0V 15.7 km to 0 km for M8V host stars (F0V 15.7 km, F7V 13.8 km, G2V 12.7 km, G8V 11.7 km, K2V 9.6 km, K7V 6.6 km, M1A 3.9 km, M3A 1.7 km, M8A 0 km; following Betremieux & Kaltenegger 2014). Clouds do not significantly affect the strengths of the spectral features in Earth's transmission because most clouds on Earth are located at altitudes below 12 km. However, for planets, which can be probed deeper than 12 km, clouds will start to obscure part of the spectra. Clouds in transmission spectra will obscure the spectral features below the cloud layer, if they occur close or on the terminator region that is probed during primary transit (e.g., Seager et al. 2005; Kaltenegger & Traub 2009; Robinson 2011; Betremieux & Kaltenegger 2014). Currently there is no conclusion on the location of clouds on Earthlike planets orbiting different host stars. Therefore, we have indicated the modern Earth's cloud heights at 1, 6, and 12 km (following Kaltenegger et al. 2007) in Figures 2 and 3 as dashed lines.

Figure 3. Overlapping water and methane absorption features in Earth's visible transmission spectra through geological time from 0.7–2.7 μm shown at a resolution of λ/Δλ = 300 for the four epochs modeled for three host stars in our grid (F0, Sun, M8). Spectra for all grid stars are available online (carlsaganinstitute.org/data and doi:10.5281/zenodo.4029370).
Download figure:
Standard image High-resolution imageWe assume full primary transit geometry for our spectra. The dominant contributions to transmission spectra from Earthlike planets' atmospheres come from the atmosphere below 60 km in the wavelength range modeled (10−4 bar). However, to fully capture all spectral lines in the high-resolution spectra, we extend the atmosphere modeled in Rugheimer & Kaltenegger (2018) isothermal above that region to 10−7 bar. This choice is driven by the largest feature, CO2 at 4.3 μm. Note that outside the considered wavelength range, higher parts of the atmosphere can contribute significantly to the transmission spectra, e.g., up to 180 km for modern Earth's UV transmission spectrum (see Betremieux & Kaltenegger 2013). No noise has been added to the transmission spectra to provide theoretical input spectra for any instrument.
4. Results
Transmission spectra from the visible to infrared (0.4–20 μm) for Earthlike planets orbiting a wide range of Sun-like stars show a range of spectral features. We shortly describe the change in atmospheric species due to the influence of the host star for the different geological epochs modeled, which maps onto the transmission spectra. We focus on the climate indicators H2O and CO2 as well as the biosignature pairs CH4 + O2 and CH4 + O3 (Lederberg 1965; Lovelock 1965), which are our most robust signs of life in the atmosphere on other planets. Other gases, which could indicate biology but also have alternative explanations, include nitrous oxide, N2O, and chloromethane, CH3Cl (see, e.g., Segura et al. 2005; Kasting et al. 2014; Kaltenegger 2017; Schwieterman et al. 2018; Grenfell 2017). Note that our models assume biological N2O sources for all biotic atmospheres (see Rugheimer & Kaltenegger 2018).
Figure 2 shows the corresponding spectra and star to planet contrast ratio for our models for four host stars, representing our full grid, at a resolution of λ/Δλ = 300 with the most prominent spectral features identified. The contrast ratio varies by about two orders of magnitude between our grid stars due to their difference in size, making planets orbiting small stars promising targets for biosignature detection.
Several features overlap at the resolution of λ/Δλ = 300, which is shown in Figures 2 and 3 for clarity, and are not specifically labeled. In the high-resolution online transmission spectra, individual spectral lines can be easily discerned for these molecules, as shown in Figure 4 for O2 and O3 for biotic atmospheres (epochs 2–4), for a resolution of λ/Δλ > 100,000 as proposed for several instruments on the ELTs. Note that for planets around cooler stars than our Sun, which can be probed below 12 km, clouds will influence the detectability of any spectral features. However, with no clear answer where such clouds will form, we indicate the three Earth cloud levels as dashed lines in Figures 2 and 3 and show the transmission spectra down to the refraction limit.
All high-resolution spectra are available online at carlsaganinstitute.org/data and doi:10.5281/zenodo.4029370.
4.1. Transmission Spectra of Earthlike Planets through Geological Time
The transmission spectra show large changes in the atmospheric composition from a prebiotic world to modern Earth (Figure 2).
Throughout the atmospheric evolution of our models, different absorption features dominate Earth's spectrum with CO2 being dominant in early Earth models, where it is more abundant, and O2 and O3 features increasing with O2 abundance from a Paleo- and Mesoproterozoic Earth to modern Earth (Table 1). For modern Earth, Figure 2 shows strong absorption features of O2 at 0.76 μm, with a weaker feature at 0.69 μm, and O3 at 9.6 μm, with a weaker feature at 9 μm, as well as a broad O3 triangular feature from 0.45 to 0.74 μm (the Chappuis band). These features become weaker with decreasing oxygen content.
CH4 features increase with strength for younger biotic Earth models (7.7, 3.3, 2.32, 1.69, 1.00, 0.89, 0.73, and 0.6 μm). Note that the prebiotic Earth model assumes low CH4 concentrations.
H2O abundance and absorption feature strength increase with increasing surface temperature, and consequential evaporation rate, and show spectral features at a wide range of wavelengths, the strongest are labeled in Figure 2 at 17–20, 6.4, 2.6, 1.88, 1.41, 1.13, 0.94, 0.82, and 0.72 μm. With increasing CO2 abundance for earlier Earth models, CO2 spectral features at 15, 10.4, 9.3, 2.7, 2.35, 2.03, 1.62, 1.59, 1.21, and 1.06 μm become stronger.
N2O shows absorption features at 3.7, 4.5, 7.8, 8.6, 10.65, and 17 μm. CH3Cl shows features at 3.35, 7, 9.7, and 13.7 μm. Feature strength decreases with decreasing concentrations for younger Earth models. N2O and CH3Cl features are not labeled in Figure 2 because they overlap with CO2, H2O, and CH4 features and thus cannot be easily identified in low-resolution spectra; e.g., the 17 μm N2O and the 13.7 μm CH3Cl feature are located in the wings of the 15 μm CO2 feature.
4.2. Transmission Spectra of Earthlike Planets across Host Star Type
Figure 2 shows that within each atmospheric model (see Rugheimer & Kaltenegger 2018 for details), increasing UV flux photolyzes larger amounts of CH4 and H2O in the stratosphere, cooling it. In modern atmospheres, heating due to O3 dominates and thus higher stellar UV flux leads to hotter stratospheric temperatures. O3 is primarily produced by wavelengths below 2400 Å and destroyed by wavelengths below 3200 Å, therefore the UV incident flux shortward and longward of 2400 Å sets the abundance of atmospheric O3 (see, e.g., Segura et al. 2005; Domagal-Goldman et al. 2011), increasing the ozone column densities for cooler host stars in our sample. Note that due to photolysis of other species such as CO2 and H2O in the prebiotic atmosphere at 3.9 Ga, there is enough free oxygen to form O3 in the stratosphere, although surface concentrations are up to 10 orders of magnitude lower (see Rugheimer & Kaltenegger 2018 for details).
The mixing ratio of CH4 is given in Table 1, with the highest CH4 mixing ratio at epoch 2, assuming increased CH4 production by methanogens. N2O concentrations in our models assume increasing biological flux for later epochs and no N2O flux for the prebiotic Earth model. For higher UV radiation from the host star, N2O is destroyed by photolysis. H2O increases with planetary surface temperature and subsequent evaporation.
For all epochs and host stars, H2O and CH4 show absorption features that overlap in the visible wavelength range (Figure 3). While the overlap of the features will make it challenging to distinguish H2O and CH4 in the visible range at low resolution, the increase of the methane features in the visible range for younger Earth models increases our opportunity to discover the biosignature pair O2 and CH4 in the visible wavelength range. Methane and water features can be distinguished in the visible range by measuring the flux at 1.7 μm, where only methane absorbs, but water does not.
4.3. High-resolution Spectra Increase the Detectability of Biosignatures
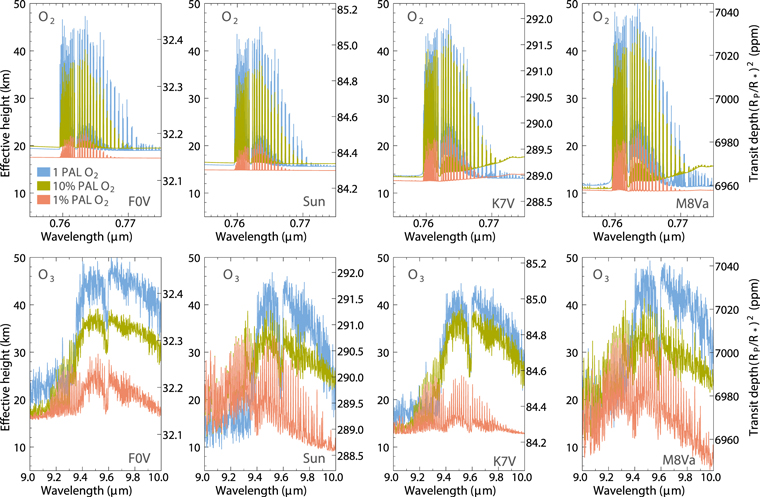
As shown in Figure 2 the observability of biosignature generally increases with planetary age because the detectability of oxygen and ozone as part of the CH4 oxygen/ozone biosignature pair increases. Figure 4 shows the change in both the O2 feature at 0.76 μm and the O3 feature at 9.6 μm through geological time for four different host stars for a minimum resolution of λ/Δλ > 100,000 between 0.4 and 10 μm and a minimum of 50,000 between 10 and 20 μm. We do not show the CH4 features in high resolution here, because they can be seen for all biotic epochs at 7.7 and 2.3 μm in low resolution (Figure 2).
Figure 4. High resolution (R > 100,000) for the 0.76 μm O2 and 9.6 μm O3 feature for the rise of oxygen from 0.01 to the PAL of oxygen, which is 21% in Earth's modern atmosphere, for four host stars of our grid (F0, Sun, K7 and M8). Spectra for all grid stars are available online (carlsaganinstitute.org/data and doi:10.5281/zenodo.4029370).
Download figure:
Standard image High-resolution image
The models show the rise of oxygen from 0.01 PAL for a Paleo- and Mesoproterozoic Earth to 21% oxygen for modern Earth. In addition to the change in the abundance of oxygen and ozone as described, Figure 4 shows how the refraction cutoff in the lower atmosphere influences the spectra. It varies from 15.7 km (F0) to 0 km (M8). The contrast ratio varies by about two orders of magnitude between our grid stars due to their difference in size, making planets orbiting small stars promising targets for biosignature detection.
The abundance of CH4 increases for younger biotic atmosphere models. Therefore, the biosignature pair CH4 + O2 could also become observable in the visible range for younger Earth models, especially at high resolution, where water and methane features can be distinguished. As shown in Kaltenegger et al. (2020) for Earth, a biosphere could be detected for 0.1 PAL oxygen, corresponding to about 1–2 billion years ago in Earth's history (e.g., Lyons et al. 2014). The observability of the spectral O2, O3, and CH4 features for lower concentrations depends on the resolution as well as the signal to noise ratio of the specific instrument chosen.
5. Summary and Discussion
The diversity of known transiting exoplanets suggests that we will encounter a large diversity of terrestrial exoplanet atmospheres. To expand from the modern Earth models commonly used, our high-resolution transmission spectra database presented here provides a range of contrast ratios of spectral features from the visible to the infrared for transiting Earthlike exoplanets orbiting a wide range of Sun-like host stars (Teff = 7000–2400 K)—from young prebiotic worlds to modern Earth analogs. We chose atmospheres representative of four geological epochs of Earth's history: a prebiotic high-CO2 world about 3.9 billion years ago in Earth's history (epoch 1), as well as three epochs through the rise of O2 levels from 0.2% to PAL, which started about 2.4 billion years ago on Earth. Different absorption features dominate the terrestrial planets' transmission spectra with CO2 features dominating in early Earth models, where they are more abundant. O2 and O3 spectral features become stronger with increasing abundance during the rise in oxygen levels (epoch 2–4). All spectra are available in high resolution online (carlsaganinstitute.org/data and doi:10.5281/zenodo.4029370).
5.1. When Could Signs of Life be Detected in the Atmosphere of Earthlike Transiting Planets?
Using our own planet's evolution as our basis, we created a high-resolution transmission spectra database of Earthlike planets of different incident flux orbiting a wide range of Sun-like stars to explore when signs of life could be detected in their atmospheres.
The transmission spectra show spectral features, which would indicate a biosphere on exoplanets orbiting F0 to M8 stars for 0.1 PAL of modern Earth's oxygen, corresponding to about 1–2 billion years ago in Earth's history.
In addition, we show that the increasing strength of methane features in the visible transmission spectra for younger Earth models would significantly improve the detectability of the biosignature pair O2 + CH4 in the visible wavelength range.
For modern Earth the methane features in the visible range are very small and challenging to assess. However, note that most visible CH4 features overlap with water features and have to be distinguished (Figure 3). This can be done at specific wavelengths where CH4 features do not overlap with other chemicals like at 1.7 or 2.3 μm or in high resolution.
5.2. Atmosphere Evolution for Earth and Earthlike Planets
We do not yet understand what sets the evolution timescale on a terrestrial planet. Because no self-consistent evolution models exist for all host stars, we reduce the overall luminosity of all stellar types by the same amount, based on an evolutionary model for the Sun (Claire et al. 2012) and the resulting incident flux Earth received at each geological epoch is modeled. This does not represent similar timescales for the grid of host stars, with the evolution of the hotter F stars being much faster than the cooler grid stars.
The reduction in stellar incident flux for models of earlier epochs also corresponds to planetary models with increased orbital distances from the host stars, a topic we plan to explore in future work. Meanwhile, the models of early epochs around the different host stars show specific examples of the influence of orbital distance on planetary transit spectra. However, our models compare planets that receive the same bolometric incident flux across stellar hosts with specific planetary models corresponding to Earth's evolution. Therefore, while this spectral database provides limited insights into the effect of distance from the host star in the habitable zone due to the reduced stellar flux at early epochs corresponding to a larger orbital distance of a planet as well, it compares similar incident flux, not similar orbital distances. In addition, note that the refraction limits which set how deep a planet's atmosphere can be probed would change with orbital distances from the host star (see, e.g., Betremieux & Kaltenegger 2014; Robinson et al. 2017). In our model spectra the refraction limit is set for the 1 au equivalent distance for all planet models.
5.3. Biosignatures Need to be Set in Context of their Star and Planet
We chose the CH4 + O2 (Lederberg 1965; Lovelock 1965) or CH4 + O3 pairs as the most reliable biosignatures for Earthlike planets (see, e.g., Grenfell 2017; Kaltenegger 2017). On short timescales, the two species react to produce CO2 and H2O and therefore must be constantly replenished to maintain detectable concentrations. Neither gas alone is a reliable biosignature.
CH4 can be produced abiotically, e.g., in volcanic eruptions or serpentinization. Several mechanisms can produce atmospheric oxygen and ozone in a terrestrial planet's atmosphere through photolysis of H2O or CO2, for planets, e.g., with low-H2/high-CO2 atmospheres (Domagal-Goldman et al. 2014), with low-pressure atmospheres (Wordsworth & Pierrehumbert 2014) or CO2-rich atmospheres orbiting M dwarfs (Hu et al. 2012; Tian et al. 2014). These results reinforce the caution to not use an individual spectral feature like O2 alone as a biosignature. As photolysis depends strongly on the UV radiation, understanding the host star and the radiation environment of the planet is important for interpreting biosignature detections (see, e.g., France et al. 2016; Rimmer & Rugheimer 2019; Airapetian et al. 2020).
Absorption features for the biosignature pairs CH4 + O2 and CH4 + O3 for epochs 2–4 are shown in Figure 2 at several wavelengths. The strongest features in the modeled wavelength range for these gases in the visible to near-IR are O3 (0.4–0.6 μm), O2 (0.76 μm), CH4 (2.3 μm), and in the thermal IR O3 (9.6 μm) and CH4 (7.6 μm).
The high-resolution transmission spectra database for Earthlike exoplanets orbiting a wide range of Sun-like host stars from young prebiotic worlds to modern Earth analogs is available online and can be used as a tool to optimize our observation strategy, train retrieval methods, as well as interpret upcoming observations with JWST as well as ground-based ELTs and future mission concepts like Origins, HabEx, and LUVOIR.
With the next generation of telescopes on the ground and in space, we will, for the first time in human history, be able to characterize rocky planets in the habitable zone of their host stars. Drawing on the rich history of Earth, the only habitable world we know, increases our chances to discover signs of life in the universe.
The authors acknowledge funding from the Carl Sagan Institute and the Brinson Foundation. L.K. thanks Ryan MacDonald for insightful comments on the paper draft.