


Abstract
Amide molecules produced in space could play a key role in the formation of biomolecules on a young planetary object. However, the formation and chemical network of amide molecules in space is not well understood. In this work, Atacama Large Millimeter/submillimeter Array observations are used to study a number of amide(-like) molecules toward the high-mass star-forming region NGC 6334I. The first detections of cyanamide (NH2CN), acetamide (CH3C(O)NH2), and N-methylformamide (CH3NHCHO) are presented for this source. These are combined with analyses of isocyanic acid (HNCO) and formamide (NH2CHO), and a tentative detection of urea (carbamide; NH2C(O)NH2). Abundance correlations show that most amides are likely formed in related reactions occurring in ices on interstellar dust grains in NGC 6334I. However, in an expanded sample of sources, large abundance variations are seen for NH2CN that seem to depend on the source type, which suggests that the physical conditions within the source heavily influence the production of this species. The rich amide inventory of NGC 6334I strengthens the case that interstellar molecules can contribute to the emergence of biomolecules on planets.
Export citation and abstract BibTeX RIS
1. Introduction
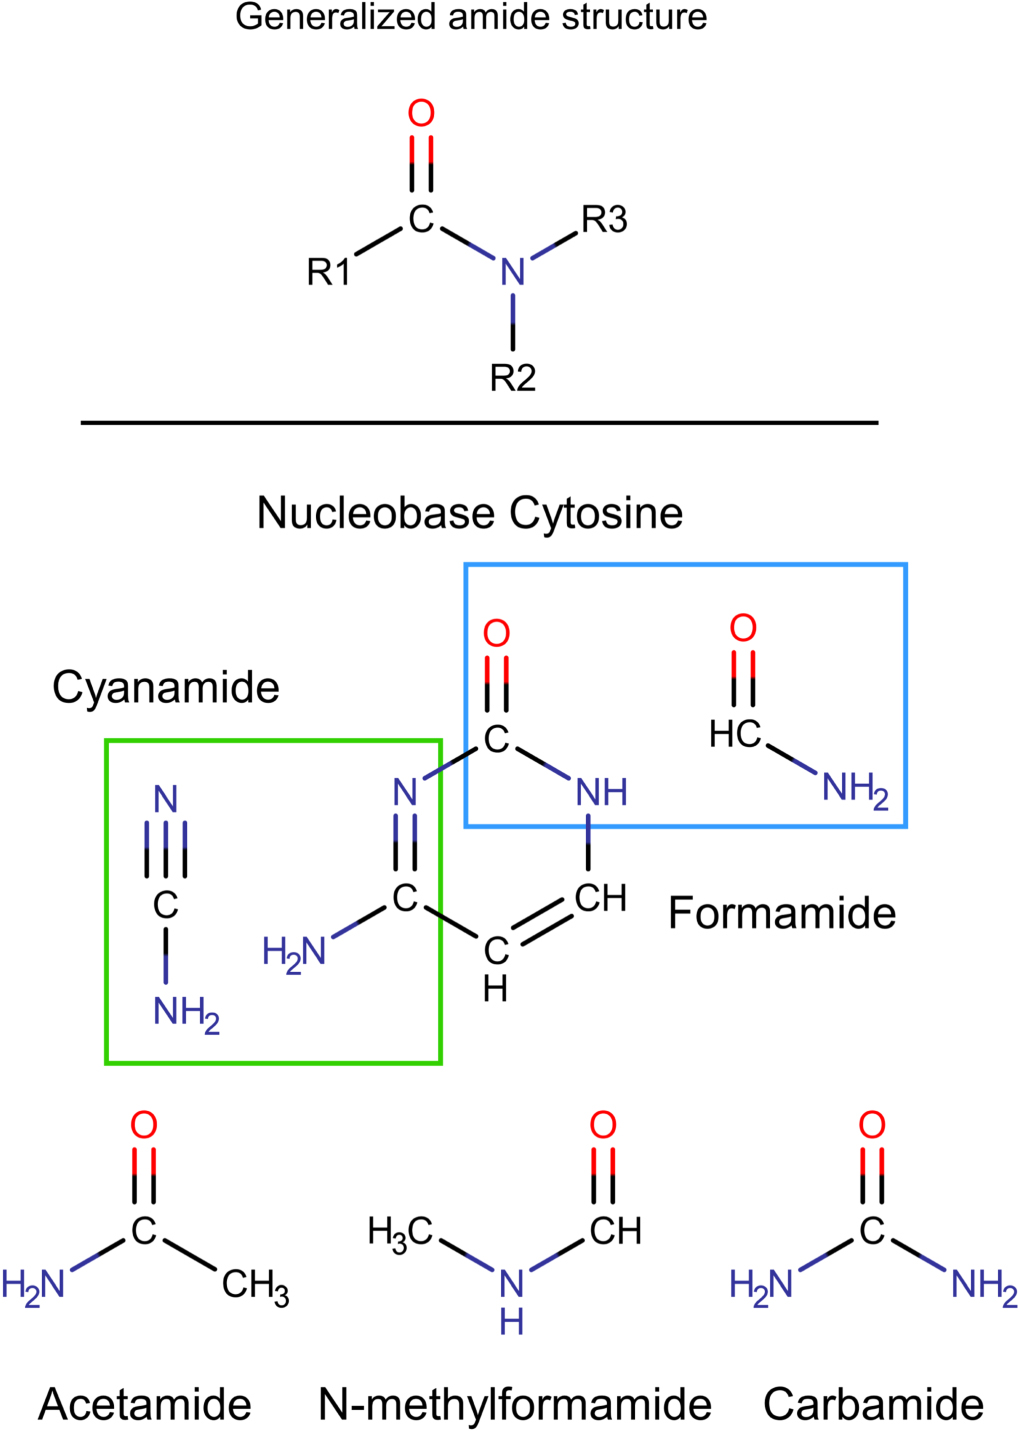
Life as we know it relies on a select number of recurring chemical structures. Among these chemical structures, the amide unit (R1–C(=O)N–R2R3, see the top panel of Figure 1), is an essential component in numerous biomolecules. Notable examples are nucleobases, the molecules that encode RNA and DNA, and as the link in the peptide chains that form proteins. In order to understand the chemical origin of life, it is important to understand how molecules with an amide unit came to be on Earth. Chemical reactions on a young Earth can give rise to this class of molecules (e.g., Patel et al. 2015). However, a fascinating alternative is the formation of amides in space and subsequent delivery by, for example, meteorites to Earth (e.g., Chyba et al. 1990).

Figure 1. Top: generalized structure of an amide. Various functional groups can be attached to the O=C–N backbone on locations R1, R2, and R3 (R represents any arbitrary atom or functional group, not a specific element). Bottom: molecular structures of amides observed in space and that of the nucleobase cytosine. Structural similarities between cytosine and NH2CN and NH2CHO are highlighted.
Download figure:
Standard image High-resolution imageSeveral small amide molecules have been detected toward star- and planet-forming regions, most of them in recent years, such as formamide (NH2CHO; Rubin et al. 1971), acetamide (CH3C(O)NH2; Hollis et al. 2006), and N-methylformamide (CH3NHCHO; Belloche et al. 2017, 2019). The first evidence for carbamide, also known as urea (NH2C(O)NH2), in the gas phase in the interstellar medium comes from Remijan et al. (2014), but it was securely identified by Belloche et al. (2019). Molecules that are closely related to the amide structure have been observed as well. Examples are cyanamide 6 (NH2CN; Turner et al. 1975), isocyanic acid (HNCO; Snyder & Buhl 1972), and methyl isocyanate (CH3NCO; Halfen et al. 2015; Cernicharo et al. 2016; Ligterink et al. 2017). These molecules have structural similarities with biomolecules (see the bottom panel of Figure 1) and can act as precursor molecules to their formation.
To assess the importance of interstellar amides for biochemistry, it is important to know if they commonly occur in star- and planet-forming regions. The simplest amide NH2CHO and related molecule NH2CN have been detected toward a number of inter- and circumstellar sources (Belloche et al. 2020), including the Sun-like protobinary IRAS 16293-2422 (Kahane et al. 2013; Coutens et al. 2016, 2018 hereafter IRAS 16293). NH2CHO was also detected in comet 67P/Churyumov-Gerasimenko (Goesmann et al. 2015; Altwegg et al. 2017, hereafter 67P/C-G). However, larger amides have almost exclusively been observed toward the Galactic center source Sagittarius B2 (hereafter Sgr B2, Halfen et al. 2011; Cernicharo et al. 2016; Belloche et al. 2017, 2019; Ligterink et al. 2018a).
An expanded sample of amide detections can help elucidate both their interstellar chemistry and the interplay of that chemistry with physical processes during star formation. For example, a large sample of HNCO and NH2CHO observations clearly shows an abundance correlation between these two species over a variety of sources (López-Sepulcre et al. 2019, and references therein). Hydrogenation (the addition of hydrogen atoms) of HNCO to form NH2CHO has been proposed as a chemical explanation for the link between the two molecules (López-Sepulcre et al. 2015). However, recent modeling work indicates that the relation between the two molecules is instead due to similar responses of the formation pathways of each molecule to the physical environment (Quénard et al. 2018). Analogous analytical approaches could provide valuable insight into other amide species. But while chemical reactions for such molecules have recently been included in chemical networks (Belloche et al. 2017, 2019), observational constraints for these networks are sparse. To unravel interstellar amide chemistry and determine its relevance to biochemistry, it is important to expand the number of amide detections and to understand their formation. An ideal interstellar laboratory to study amides is found in the high-mass star-forming region (HMSFR) NGC 6334I. First, since the solar system is thought to have formed in a massive cluster (e.g., Dukes & Krumholz 2012), NGC 6334I observations present a "direct" look at the conditions of early solar system formation. Second, the chemistry of this region has been studied in great detail in the past decades, for example with the Herschel Space Observatory (Zernickel et al. 2012). In recent years, NGC 6334I has been extensively studied with the Atacama Large Millimeter/submillimeter Array (ALMA). This has not only resulted in a better understanding of the physical structure of this source (Brogan et al. 2016, 2018), but also a better understanding of its molecular inventory. Various oxygen-bearing molecules have been investigated, including the C2H4O2 isomers methyl formate (CH3OCHO), glycolaldehyde (HC(O)CH2OH), and acetic acid (CH3COOH; McGuire et al. 2018; El-Abd et al. 2019; Xue et al. 2019), deuterated methanol (Bøgelund et al. 2018), and even the first ever interstellar detection of methoxymethanol (CH3OCH2OH; McGuire et al. 2017) present toward this source. Additionally, a number of complex nitrogen-bearing molecules were investigated by Bøgelund et al. (2019b), including NH2CHO.
In this work, the inventory of amides toward NGC 6334I is investigated in detail. The first detections toward this object of NH2CN, CH3C(O)NH2, and CH3NHCHO are presented and combined with analyses of HNCO and NH2CHO, and the tentative detection of NH2C(O)NH2. These observations and results are presented in Sections 2 and 3. The implications of the results are discussed in Section 4, before conclusions are given in Section 5.
2. Observations and Analysis
2.1. Observational Data of NGC 6334I
In this work, ALMA observations of NGC 6334I in bands 4, 7, and 10 are analyzed. The details of the individual data sets and their reductions have been published in detail elsewhere (McGuire et al. 2017, 2018; Brogan et al. 2018) and will only be discussed briefly here. The pertinent observing parameters for each set of observations are provided in Table 2. The data were self-calibrated and continuum-subtracted following the procedures detailed in Hunter et al. (2017) and Brogan et al. (2018). Prior to analysis, all of the observations were convolved to a common synthesized beam size of 026 × 026. From the data cubes, background temperatures (TBG) were determined based on the continuum level temperature and spectra were extracted for analysis at the same positions as used in El-Abd et al. (2019) and at an additional position called MM1-nmf. These positions are chosen to give an accurate overall sample of the chemistry toward NGC 6334I MM1 and MM2. The parameters of these positions are listed in Table 1 and are indicated on moment 0 maps shown in Figure 2. In the case of Band 10 observations, robust analysis was only possible toward positions in MM1, as the MM2 source falls at the edge of the primary beam.

Figure 2. Moment 0 maps of NH2CN (transition:  –
– , 279.821 GHz, Eup = 159 K), HNCO (transition:
  –
– , 131.847 GHz,
  = 192 K), NH2CHO (transition:
  –
– , 281.935 GHz,
  = 159 K), and CH3C(O)NH2 (transition:
  –
– , 279.473 GHz,
  = 195 K), with 1 mm dust-continuum contours overplotted at 17.5, 52.5, 140, and 367.5 mJy beam−1. The angular resolution of the observations (026) is indicated by the bottom left circle. The positions of the extracted spectra are indicated by white dots labeled by Roman numerals.
Download figure:
Standard image High-resolution imageTable 1. Physical Parameters for Spectra Analyzed toward NGC 6334I
| Position | R.A. | Decl. |
 a
a
|

|

|
 b
b
| |||
|---|---|---|---|---|---|---|---|---|---|
| (a) | (b) | (c) | (d) | ||||||
| (hh:mm:ss) | (dd:mm:ss) | (km s−1) | (km s−1) | (K) | (K) | ||||
| MM1-i | 17:20:53.373 | −35.46.58.341 | −7.0 | 3.25 | 135 | 10.1 | 26.9 | 31.3 | 31.3 |
| MM1-ii | 17:20:53.386 | −35.46.57.112 | −4.0 to −4.5 | 3.25 | 175 | 38.9 | 79.7 | 94.6 | 85.1 |
| MM1-iii | 17:20:53.387 | −35.46.57.533 | −5.2 | 3.00 | 225 | 50.8 | 108.2 | 129.7 | 120.3 |
| MM1-iv | 17:20:53.420 | −35.46.59.088 | −8.2 | 3.50 | 150 | 15.7 | 38.4 | 44.8 | 73.6 |
| MM1-v | 17:20:53.434 | −35.46.57.856 | −4.4 | 3.25 | 285 | 69.0 | 159.3 | 192.7 | 176 |
| MM1-vi | 17:20:53.435 | −35.46.58.731 | −7.0 to −7.5 | 3.25 | 190 | 30.2 | 77.6 | 88.6 | 94.4 |
| MM1-vii | 17:20:53.459 | −35.46.57.661 | −4.0 | 3.00 | 185 | 43.4 | 96.5 | 112.4 | 106.7 |
| MM1-viii | 17:20:53.469 | −35.46.58.724 | −6.8 | 3.00 | 150 | 25.8 | 57.1 | 64.7 | 81.9 |
| MM1-ix | 17:20:53.475 | −35.46.57.156 | −5.0 | 2.50 | 150 | 16.9 | 36.8 | 45.2 | 65.7 |
| MM1-nmf | 17:20:53.461 | −35.46.57.284 | −4.5 | 2.50 | 150 | 31.1 | 66.8 | 80.9 | 88.1 |
| MM2-i | 17:20:53.152 | −35.46.59.416 | −9.0 | 2.80 | 150 | 9.2 | 21.8 | 27.8 | 57.5 |
| MM2-ii | 17:20:53.178 | −35.46.59.494 | −9.0 | 2.80 | 200 | 17.4 | 44.4 | 58.6 | 98.4 |
| MM2-iii | 17:20:53.202 | −35.46.59.175 | −7.8 | 2.80 | 180 | 18.9 | 44.2 | 57.7 | 76.1 |
Notes.
a For some positions certain molecules are fit with a different . For these cases a
  range is given.
b
Four different background temperature values are given for: (a) band 4, (b) band 7
range is given.
b
Four different background temperature values are given for: (a) band 4, (b) band 7  , (c) band 7
  , and (d) band 10 observations, respectively.
Download table as: ASCIITypeset image
Table 2. Summary of Pertinent ALMA Observing Parameters
| Parameter | Band 4 | Band 7 Low | Band 7 High | Band 10 |
|---|---|---|---|---|
| Project code | #2017.1.00661.S | #2015.A.00022.T | #2015.A.00022.T | #2017.1.00717.S |
| Configuration(s) | C43-6 | C36-4, C36-5 | C36-4, C36-5 | C43-3 |
Primary beam FWHM ( ) ) | 41 | 20 | 17 | 6.6 |
Angular resolution ( )
a )
a
|

|

|

|

|
| Frequency (GHz) | 130.03–132.02 | 279.17–282.94 | 336.18–339.94 | 873.88–881.33 |
| 144.00–145.87 | 291.18–294.94 | 348.18–351.94 | 890.25–897.70 | |
| Spectral resolution (km s−1) | 1.1 | 1.1 | 1.1 | 0.5 |
| rms (mJy beam−1 km s−1) | 0.8 | 2.0 | 3.3 | 44 |
Note.
a Note that all the observations were convolved to a common synthesized beam size of .
.Download table as: ASCIITypeset image
2.2. Molecule Identification and Analysis
All spectra are analyzed with the CASSIS 7 line-analysis software. Linelists from the JPL catalog for molecular spectroscopy (Pickett et al. 1998), the Cologne Database for Molecular Spectroscopy (CDMS; Müller et al. 2001, 2005), and literature are used. For the molecules of interest to this work, that is amide and amide-like molecules, an overview of database and literature sources is given in Table B1 in Appendix B.
Given a line list and input parameters such as column density (Ns), excitation temperature (Tex), source velocity (VLSR), and line width at FWHM (ΔV), CASSIS is able to generate synthetic molecular spectra. Molecular line emission is coupled with the background temperature. Normally, this is the cosmic microwave background temperature of 2.7 K, which has a negligible influence on molecular emission. However, background dust-continuum temperatures are significantly higher toward NGC 6334I, and it is therefore important to take this effect into account to properly simulate molecular spectra. TBG varies for every position and frequency range toward NGC 6334I. Its values are given in Table 1. Due to the extended molecular emission in NGC 6334I and the relatively small beam size, the emission is assumed to be beam filling and thus has a beam filling factor of one.
The analysis of spectral lines is performed under the assumption that molecules are in local thermodynamic equilibrium and have a single excitation temperature. The excitation temperature is determined from the observed line brightness temperature ( ) above the background continuum of optically thick rotational lines and TBG following the formalism of Turner (1991; see also Section 2.2.1. of El-Abd et al. 2019). Toward each position all molecules are thus analyzed with the same excitation temperature. In the first step of the data analysis, rotational lines of a molecule are identified and a by-eye synthetic fit of these lines is made. From the by-eye fit the VLSR and ΔV are determined, which in most cases yield similar values as given in El-Abd et al. (2019). The errors on both the VLSR and ΔV are conservatively estimated to be ± 0.3 km s−1. Then, by cross checking with the spectral line databases, optically thin lines (
 1) are selected that are free of line blends with other species, although blends in the line wings of other species may occur. CASSIS then performs a regular grid χ2 minimization routine on the selected lines, where the column density is given as a free parameter within ±1 order of magnitude of the by-eye determined value. The best fit (i.e., lowest χ2 value) determines the column density. In most cases, the error on the column density is given by the 1σ fit error plus a 10% flux uncertainty. A larger error of 30% is used for for CH3NHCHO, due to higher level of line blending. Further details on the CASSIS line-analysis procedure can be found in Ligterink et al. (2018b) and Bøgelund et al. (2019b).
3. Results
Except for position MM2-iii, molecular line emissions of NH2CN, HN12CO, HN13CO, NH CHO, NH
 CHO, and CH3C(O)NH2 are detected toward all positions. The detected lines are listed in Table C1. Many of the lines of the main isotopologues of HNCO and NH2CHO are optically thick and therefore not used for further analysis. Following the routine described in Section 2.2, the spectra of the remaining molecules were simulated and column densities derived. NH2CN and CH3C(O)NH2 are detected for the first time toward NGC 6334I and their detected spectral lines toward position MM1-i are shown in Figures 3 and 4. The spectra of the other molecules toward MM1-i and all detections toward MM2-i are presented in Appendix D. The derived column densities toward each position are listed in Table 3. For further analysis, the column densities of HN12CO and NH
 CHO are determined from their optically thin 13C counterparts. To derive the main isotopologue column density, the column densities of the 13C isotopologues are multiplied with the
  ratio of 62 for NGC 6334I, as determined by Bøgelund et al. (2018), based on equations given by Milam et al. (2005). Moment 0 maps of lines of NH2CN, HN12CO, NH
 CHO, and CH3C(O)NH2 overplotted on dust-continuum contours are shown in Figure 2.

Figure 3. Detected transitions of NH2CN in the spectrum toward position MM1-i. The observed spectrum is plotted in black, with the synthetic spectrum overplotted in blue and the rest-frequency center of the transition is indicated by the red dotted line. The upper state energy of each transition is given in the top-left corner.
Download figure:
Standard image High-resolution image
Figure 4. Detected transitions of CH3C(O)NH2 in the spectrum toward position MM1-i. The observed spectrum is plotted in black, with the synthetic spectrum overplotted in blue and the rest-frequency center of the transition is indicated by the red dotted line. The upper state energy of each transition is given in the top-left corner.
Download figure:
Standard image High-resolution imageTable 3. Column Densities and Upper Limits of Amides Analyzed in This Work
| Position |

| N(NH2CN) | N(HN13CO) |
N(NH CHO) CHO) | N(CH3C(O)NH2) | N(CH3NHCHO) | N(NH2C(O)NH2) |
|---|---|---|---|---|---|---|---|
| (K) | (cm−2) | (cm−2) | (cm−2) | (cm−2) | (cm−2) | (cm−2) | |
| MM1-i | 135 | (5.9 ± 0.9) × 1015 | (9.9 ± 3.0) × 1015 | (8.6 ± 1.4) × 1015 | (4.7 ± 0.7) × 1016 |
 (7.5 ± 2.8) × 1016 (7.5 ± 2.8) × 1016
|
 2.0 × 10¹⁵ 2.0 × 10¹⁵
|
| MM1-ii | 175 | (1.8 ± 0.3) × 1016 | (4.5 ± 1.4) × 1016 | (2.2 ± 0.6) × 1016 | (7.4 ± 1.1) × 1016 |
 1.5 × 10¹⁷ 1.5 × 10¹⁷
|
 5.0 × 10¹⁵ 5.0 × 10¹⁵
|
| MM1-iii | 225 | (3.5 ± 0.5) × 1016 | (6.0 ± 1.8) × 1016 | (3.2 ± 0.5) × 1016 | (1.7 ± 0.4) × 1017 |
 2.5 × 10¹⁷ 2.5 × 10¹⁷
|
 1.0 × 10¹⁶ 1.0 × 10¹⁶
|
| MM1-iv | 150 | (7.8 ± 1.6) × 1015 | (1.3 ± 0.2) × 1016 | (1.3 ± 0.2) × 1016 | (4.0 ± 1.2) × 1017 |
 (1.0 ± 0.4) × 1017 (1.0 ± 0.4) × 1017
|
 1.0 × 10¹⁶ 1.0 × 10¹⁶
|
| MM1-v | 285 | (4.0 ± 0.4) × 1016 | (1.2 ± 0.1) × 1017 | (2.7 ± 0.3) × 1016 | (2.3 ± 0.2) × 1017 | (3.6 ± 0.7) × 1017 |
 (5.0 ± 2.0) × 1016 (5.0 ± 2.0) × 1016
|
| MM1-vi | 190 | (2.6 ± 0.6) × 1016 | (3.7 ± 0.5) × 1016 | (2.8 ± 0.3) × 1016 | (1.6 ± 0.2) × 1017 | (2.0 ± 0.6) × 1017 |
 1.0 × 10¹⁶ 1.0 × 10¹⁶
|
| MM1-vii | 185 | (1.6 ± 0.3) × 1016 | (4.4 ± 0.5) × 1016 | (3.8 ± 0.4) × 1016 | (1.6 ± 0.2) × 1017 | (2.0 ± 0.6) × 1017 |
 3.0 × 10¹⁶ 3.0 × 10¹⁶
|
| MM1-viii | 150 | (7.8 ± 0.8) × 1016 | (2.0 ± 0.3) × 1016 | (1.6 ± 0.3) × 1016 | (7.1 ± 1.1) × 1016 | (1.4 ± 0.5) × 1017 |
 2.0 × 10¹⁶ 2.0 × 10¹⁶
|
| MM1-ix | 150 | (2.3 ± 0.4) × 1015 | (6.4 ± 1.3) × 1015 | (4.8 ± 0.5) × 1015 | (1.6 ± 0.3) × 1016 | ⪉(4.8 ± 1.5) × 1016 |
 1.5 × 10¹⁶ 1.5 × 10¹⁶
|
| MM1-nmf | 150 | (1.1 ± 0.2) × 1016 | (1.9 ± 0.3) × 1016 | (1.6 ± 0.3) × 1016 | (6.8 ± 1.3) × 1016 | (1.0 ± 0.5) × 1017 |
 1.0 × 10¹⁶ 1.0 × 10¹⁶
|
| MM2-i | 150 | (3.5 ± 0.6) × 1015 | (1.4 ± 0.5) × 1016 | (3.3 ± 1.0) × 1015 | (5.9 ± 1.6) × 1016 |
 5.0 × 10¹⁶ 5.0 × 10¹⁶
|
 3.0 × 10¹⁵ 3.0 × 10¹⁵
|
| MM2-ii | 200 | (4.0 ± 0.5) × 1015 | (2.3 ± 0.7) × 1016 | (3.8 ± 1.1) × 1015 | (8.8 ± 1.6) × 1016 |
 6.0 × 10¹⁶ 6.0 × 10¹⁶
|
 4.0 × 10¹⁵ 4.0 × 10¹⁵
|
Download table as: ASCIITypeset image
Toward all positions, spectral features are identified that can be assigned to CH3NHCHO, although many of these lines are blended in the wings of other spectral features or on locations where the baseline dips. Despite this, a number of unblended CH3NHCHO lines can be identified in the spectra of positions MM1-v, vi, vii, and viii, and in particular MM1-nmf, which makes it possible to claim the first detection of CH3NHCHO toward NGC 6334I. The detected CH3NHCHO lines toward position MM1-nmf are shown in Figure 5. Figure D5 in Appendix D shows the CH3NHCHO lines in the MM1-nmf spectrum that are present on locations where the baseline dips and thus are not well reproduced by the synthetic spectrum. The spectral features identified toward the other positions in MM1 and in MM2 are insufficient to claim a detection and therefore CH3NHCHO is tentatively identified toward these positions. Column densities of this species are presented in Table 3.

Figure 5. Detected transitions of CH3NHCHO in the spectrum toward position MM1-nmf. The observed spectrum is plotted in black, with the synthetic spectrum overplotted in blue and the rest-frequency center of the transition is indicated by the red dotted line. The upper state energy of each transition is given in the top-left corner.
Download figure:
Standard image High-resolution imageAt a number of positions a handful of spectral features are identified that can be assigned to NH2C(O)NH2. The most and clearest lines are identified toward position MM1-v, see Figure 6, with at least three unblended lines. While these lines are not enough for a secure detection, a tentative identification can be claimed. The tentative and upper-limit column densities of NH2C(O)NH2 are presented in Table 3.

Figure 6. Overview of NH2C(O)NH2 spectral features toward position MM1-v. The observed spectrum is plotted in black, with the synthetic spectrum overplotted in blue and the rest-frequency center of the transition is indicated by the red dotted line. The upper state energy of each transition is given in the top-left corner.
Download figure:
Standard image High-resolution image4. Discussion
4.1. Chemical Comparisons
To get a better understanding of the chemical processes leading to amides, it is useful to compare molecular ratios of the positions within NGC 6334I, but also with other inter- and circumstellar sources. In the following subsections molecular ratios with respect to NH2CHO are discussed. Comparisons are made with the following works: IRAM 30 m and Green Bank Telescope (GBT) single-dish observations of G + 0.693-0.027 (hereafter G + 0.693), a quiescent giant molecular cloud (Zeng et al. 2018; Jiménez-Serra et al. 2020); ALMA observations of the incipient hot corino Barnard B1b-S (Marcelino et al. 2018); Northern Extended Millimeter Array observations of the low-mass protostars SVS13A, NGC 1333-IRAS4A2, NGC 1333-IRAS2A(1) (Coutens et al. 2018; Belloche et al. 2020); ALMA Protostellar Interferometric Line Survey (Jørgensen et al. 2016) observations of the low-mass protostar IRAS 16293B (Coutens et al. 2016, 2018; Ligterink et al. 2018a); GBT and IRAM 30 m single-dish observations of the Galactic center source Sgr B2 (Hollis et al. 2006; Belloche et al. 2013); ALMA observations of the HMSFR Orion KL (Cernicharo et al. 2016); the high-mass star AFGL 4176 (Bøgelund et al. 2019a); and of Sgr B2 (Belloche et al. 2017, 2019). One has to be aware that precise knowledge of the source size or emitting area of a certain molecule is essential for ratio comparisons. In particular, single-dish telescopes do not have the spatial resolution to determine the source size and these are often assumed or estimated, potentially resulting in large column density errors. Finally, mass spectrometric measurements of the Rosetta mission to comet 67P/C-G are used to compare with a solar system object (Goesmann et al. 2015; Altwegg et al. 2017). The sources are placed in the following order: comet 67P, quiescent molecular cloud, low-mass protostars/hot corinos, NGC 6334I and other HMSFRs, high-mass protostars, and hot cores. The derived ratios are presented in Figure 7.

Figure 7. Column density ratios of NH2CN (top left), HNCO (top right), CH3C(O)NH2 (bottom left), and CH3NHCHO and NH2C(O)NH2 (bottom right) with respect to NH2CHO. Ratios for NGC 6334I MM1 and MM2 are indicated in red. For the NGC 6334I data, 13C isotopes of HNCO and NH2CHO are used, multiplied by the  ratio of 62. The sources are placed in the following order: comet 67P/C-G, quiescent molecular cloud, low-mass protostars/hot corinos, NGC 6334I and other HMSFRs, high-mass protostars, and hot cores. Data are taken from: (a) Goesmann et al. (2015), Altwegg et al. (2017); (b) Zeng et al. (2018), Jiménez-Serra et al. (2020); (c) Marcelino et al. (2018); (d) Belloche et al. (2020); (e) Coutens et al. (2018); (f) Coutens et al. (2016), Coutens et al. (2018), Ligterink et al. (2018a); (g) Bøgelund et al. (2019a); (h) Cernicharo et al. (2016); (i) Belloche et al. (2013); (j) Belloche et al. (2017); (k) Belloche et al. (2019); and (l) Hollis et al. (2006).
Download figure:
Standard image High-resolution image4.1.1. Variations in NH2CN Abundance
Within NGC 6334I, the NH2CN over NH2CHO ratio shows only minor variations and in general is uniform at ∼1%–2%. More noticeable is the variation between other sources, which span almost three orders of magnitude. Interestingly, the highest ratios are found for the quiescent molecular cloud and low-mass protostars, while lower ratios are seen in the high-mass sources NGC 6334I and Sgr B2. An important deviation in this pattern is seen in Orion KL, where [NH2CN]/[NH2CHO] = 0.4–1.4 (White et al. 2003, data point not included in Figure 7). However, it is important to note that the column density of NH2CHO in Orion KL was determined using a single spectral line and there is some uncertainty in the assumed excitation temperatures. If this trend is in fact dependent on the source type, it indicates that the source influences either the formation pathway or desorption from grain surfaces of one of the two species.
Recently, Coutens et al. (2018) used chemical models to explain the presence of NH2CN toward IRAS 16293-2422B. Chemical networks for this molecule are very sparse, and no plausible gas-phase mechanism for its production is currently evident. Coutens et al. (2018) introduced a formation route for NH2CN on grain surfaces through the reaction between NH2 and CN radicals. In their chemical models they determined that this reaction is sensitive to the gas-phase H and H2 density: at high gas densities ( cm−3), hydrogenation of the NH2 and CN radicals on the ice mantle surface becomes important and the production of NH2CN stagnates. Since HMSFRs generally speaking have higher gas densities, this could explain the trend in the observational data if particular sources enter this density regime for long periods when NH2CN might otherwise be forming.
The formation of NH2CHO is still a topic of debate, with proponents of both gas-phase and solid-state ice mantle formation routes (see López-Sepulcre et al. 2019 for an overview of this discussion). Several computational studies have shown that NH2CHO can be formed in the gas phase by a near barrierless reaction between NH2 and H2CO (e.g., Barone et al. 2015; Skouteris et al. 2017):

Many studies have been dedicated to understanding the formation of NH2CHO in ice mantles, with the main proposed formation routes being the radical reaction between NH2 and CHO directly yielding NH2CHO,

and the successive hydrogenation of HNCO (Raunier et al. 2004; Garrod et al. 2008; Jones et al. 2011; Rimola et al. 2018; Enrique-Romero et al. 2019; Haupa et al. 2019):

although experimental work by Noble et al. (2015) indicates that HNCO cannot be hydrogenated. A third option is the reaction of CN radicals with water ice as proposed in theoretical work by Rimola et al. (2018):

The aforementioned influence of the hydrogen density on the NH2CN formation reaction would also be expected to influence NH2CHO formation in the ice. Reaction (2) would become less important, instead favoring the hydrogenation of NH2 to NH3:

while at the same time the increased availability of atomic hydrogen could increase the efficiency of Reaction (3), potentially allowing it to dominate. On the other hand, gas-phase production of NH2CHO can increase under the condition that gas-phase NH2 and H2CO densities increase. This can happen as the gas-phase density increases from low-mass to high-mass sources. Finally, top-down reaction pathways can contribute to an increased NH2CHO column density. For example, radiation interacting with gas-phase CH3C(O)NH2 can produce the NH2CO radical, which in turn can produce NH2CHO (e.g., Spall & Steacie 1957). If radiation fields increase in strength from low-mass to high-mass sources, such a channel can become prominent and result in a lower [NH2CN]/[NH2CHO] ratio. However, for larger molecules, such as dipeptides, experiments show that photolysis of these species primarily leads to the breaking of the peptide bond itself, instead of its surrounding bonds (Johns et al. 1968; Neubacher & Schnepel 1977, at conditions not relevant to the interstellar medium). It is therefore questionable whether top-down chemistry can efficiently produce NH2CHO (see also Section 4.1.2), but dedicated experiments under interstellar conditions are needed to answer this question. In general, care has to be taken with these chemical explanations, as they will influence formation pathways of, and ratios between, other species as well. Yet, trends like [NH2CN]/[NH2CHO] are not observed for most other species, such as HNCO and CH3C(O)NH2, see Figure 7.
Alternatively, the ice mantle desorption characteristics can explain the observed trend. Thermal desorption depends on the binding energy of the molecule. Recent laboratory studies using temperature-programmed desorption investigated the binding energy of NH2CHO on graphite and on amorphous water deposited onto graphite (Chaabouni et al. 2018). In the latter case, NH2CHO remained on the surface until after the water had already desorbed. Those authors found binding energies of 4810 and 5056–6990 K for amorphous water and for formamide, respectively (assuming a desorption-rate prefactor of 1012 s−1); the binding energy for NH2CHO corresponds simply to binding to the graphite left behind following the desorption of the water. The desorption energy of NH2CN is not experimentally determined, but chemical models commonly use binding energies of 5556 K for both species, based on the interpolation method described by Garrod & Herbst (2006). If the true value for NH2CN were close to or less than the binding energy of water, or otherwise much less than that of NH2CHO, it could influence the [NH2CN]/[NH2CHO] trend. When a source is sufficiently warm over a large area, such as a HMSFR, most volatile organic species will desorb from the grains. However, a more compact source, such as a single low-mass protostar, will have a decreasing radial temperature profile. Around such sources, species with a low desorption energy desorb over a larger area than those with a high desorption energy. Depending on the spatial resolution of the observations, the beam may simply cover a larger emitting area of NH2CN than of NH2CHO, thus explaining the decreasing ratio. To better understand how desorption characteristics influence the [NH2CN]/[NH2CHO] ratio, laboratory measurements of the NH2CN desorption energy are required, but nonthermal desorption processes of NH2CN and NH2CHO, such as reactive desorption and photodesorption, need to be studied as well.
4.1.2. HNCO Chemistry
For many years, an abundance correlation between HNCO and NH2CHO has been observed toward a large range of interstellar sources, which has led to the belief that there is a direct chemical relationship between these two species (see López-Sepulcre et al. 2019 for a recent review). In Figure 7, the [HNCO]/[NH2CHO] ratios found toward NGC 6334I are compared with ratios from a select number of other sources. We note that the HNCO column density is determined from its 13C isotope, multiplied by a  ratio of 62. In NGC 6334I MM1 the [HNCO]/[NH2CHO] is slightly above one, while in MM2 it is somewhat higher at a ratio of ∼5. Therefore, the ratios in NGC 6334I follow the average interstellar trend and strengthen the probable link between HNCO and NH2CHO. Whether this is a direct chemical link (e.g., Raunier et al. 2004; Haupa et al. 2019) or an effect caused by similar chemical responses to physical conditions (Quénard et al. 2018) cannot be inferred from these ratios. Since HNCO and CH3C(O)NH2 are found cospatially toward NGC 6334I, gas-phase ion–molecule destruction of CH3C(O)NH2 may be to some extent responsible for the observed abundances of HNCO, as was suggested by Garrod et al. (2008) and Tideswell et al. (2010). In the aforementioned works, CH3C(O)NH2 forms by radical–radical reactions on grain surfaces, together with NH2CHO, where afterwards it is released to the gas phase and can be destroyed by ions. This pathway therefore provides an indirect link between HNCO and NH2CHO, by way of CH3C(O)NH2 and other larger amides, assuming that NH2CHO and larger amides form in related reactions in ice mantles. This mechanism can help explain the higher [HNCO]/[NH2CHO] ratio in MM2, if more ions are present in MM2, for example due to a stronger radiation field, which results in enhanced HNCO production.
4.1.3. The Large Amides
Of the large amides, CH3C(O)NH2 is detected toward most positions. A relatively small abundance difference is seen between MM1 and MM2, but in general ratios are quite similar throughout the region. This suggests that production of CH3C(O)NH2 is occurring through a similar mechanism throughout the region.
Various gas-phase formation routes of CH3C(O)NH2 have been proposed and computationally tested (Hollis et al. 2006; Quan & Herbst 2007; Halfen et al. 2011; Redondo et al. 2014), with the reaction

considered to be the most efficient. In ice mantles, however, CH3C(O)NH2 is thought (e.g., Agarwal et al. 1985; Ligterink et al. 2018a) to be primarily produced by Reaction (7):

Laboratory simulations of chemical reactions in the ice mantles of interstellar dust grains found a [CH3C(O)NH2]/[NH2CHO] ratio of 0.4 upon desorption from the surface (Ligterink et al. 2018a), close to the observed average of ∼0.15 in NGC 6334I. Ice formation of CH3C(O)NH2, in particular during the dense cloud stage of star formation, is a plausible mechanism to explain its uniform ratio derived throughout NGC 6334I. While abundances also seem to be similar between NGC 6334I and other sources, it is too early to say if the general interstellar CH3C(O)NH2 chemistry is the result of the same process(es). A larger sample with confirmed detections and better constraints on the source sizes of the emitting regions toward these objects is required.
Both CH3C(O)NH2 and CH3NHCHO are present at ∼10% with respect to NH2CHO toward NGC 6334I. This similarity in abundances supports the conclusion of Belloche et al. (2017) that kinetic processes are at the basis of the formation of these species rather than thermal equilibrium. This species can form by energetically processing frozen CH3NH2:CO mixtures (Frigge et al. 2018) and thus can be formed on interstellar dust grains. We note that CH3NH2 is abundantly present toward NGC 6334I (Bøgelund et al. 2019b). CH3NHCHO abundances are similar between NGC 6334I and Sgr B2(N1S), the only other source where this molecule is securely detected (Belloche et al. 2019). However, compared to a tentative identification toward Sgr B2(N2), a difference of almost an order of magnitude is seen. At this point it not possible to draw any conclusions on the overall interstellar chemistry of CH3NHCHO and more observations of this molecule are required.
The ratios of the tentative detection and upper limits of NH2C(O)NH2 vary by about an order of magnitude within NGC 6334I. It is possible that high temperatures are needed to desorb NH2C(O)NH2 from dust grains, thus causing this variation. We note that this molecule is tentatively detected toward position MM1-v, which has the highest excitation temperature, and perhaps physical temperature, of 285 K. Compared to secure detections of NH2C(O)NH2 toward Sgr B2(N1S) and G + 0.693 (Belloche et al. 2019; Jiménez-Serra et al. 2020), abundances seem to be similar at the few percent level. However, as with the case of CH3NHCHO, it is too early to draw conclusions about the formation of NH2C(O)NH2 at this stage. The tentative identification of NH2C(O)NH2 warrants future searches for this molecule toward NGC 6334I in order to securely detect this species, better constrain its abundance, and refine and constrain chemical models to elucidate its chemistry.
4.2. Implications for Biomolecule Formation
The detection of CH3C(O)NH2 and tentative identification of CH3NHCHO in NGC 6334I strengthens the case that these molecules can contribute to the formation of biomolecules. It is possible that, in the interstellar medium, these molecules act as precursor species to, or form in parallel with, larger biomolecules. Multiple laboratory experiments show that in UV irradiated simulated ice mantles, consisting of simple molecules such as H2O, NH3, CH3OH, and CH4, simple amides and molecules of greater complexity, including biomolecules, form simultaneously (e.g., Agarwal et al. 1985; Caro et al. 2002; Caro & Schutte 2003; Nuevo et al. 2010; Ligterink et al. 2018a; Oba et al. 2019). If the formation of amides in the interstellar medium primarily occurs on interstellar dust grains, it is not unlikely that biomolecules are present as well, at least on grain surfaces. Their presence and abundance in the gas phase depends on the local physical conditions and parameters such as the binding energy and photodissociation rate.
Alternatively, amides can also be involved in the earliest stages of biochemistry after delivery to a newly formed planet. Under early Earth conditions and catalyzed by minerals, metals, or clays, NH2CHO can form a variety of biomolecules, most notably nucleobases and amino acids (Saladino et al. 2012, and references therein). Cyanamide and carbamide are known to act as condensing agents in amino acids and nucleotide polymerization reactions (Ibanez et al. 1971; Sakurai & Yanagawa 1984). It is not unlikely that CH3C(O)NH2 and CH3NHCHO engage in similar reactions, but laboratory investigations on this topic are limited.
The cocktail of molecules found toward NGC 6334I, but also other sources such as the Sun-like protostar IRAS 16293B, presents more options to directly form biomolecules on a young Earth. This is highlighted by the reaction between NH2CN and glycolaldehyde (HC(O)CH2OH), resulting in either 2-aminooxazole or 2-aminoimidazole, a precursor to nucleotide formation and a catalyst for RNA copying, respectively (see Figure 8, Patel et al. 2015; Fahrenbach et al. 2017). In the aforementioned works, both NH2CN and HC(O)CH2OH are part of in situ chemistry on a planetary body (Earth in this case) deriving from HCN and involve multiple reaction steps to produce these species. Formation of these two species in space and subsequent delivery to a young Earth directly supplies the in situ chemical network with these compounds, leading to a more rapid emergence of biomolecules.

Figure 8. Reactions involving the interstellar molecules NH2CN and HC(O)CH2OH. In a liquid water environment and catalyzed by inorganic phosphates (Pi ), either 2-aminooxazole (left), a nucleotide precursor, or, when NH3 is added, 2-aminoimidazole (right), a catalyst for RNA copying, is formed. Figure adopted from Fahrenbach et al. (2017).
Download figure:
Standard image High-resolution image5. Conclusion
In this work, a group of amides is analyzed toward the high-mass star-forming region NGC 6334I. Secure detections of NH2CN, HNCO, NH2CHO, CH3C(O)NH2, and CH3NHCHO are presented along with a tentative identification of NH2C(O)NH2. Abundances of amides are determined with respect to NH2CHO and are generally found to be similar within NGC 6334I, often varying less than a factor of five, hinting that the same chemical pathways and physical conditions are at the basis of this chemistry, despite the large size and physical differences of this HMSFR. It is plausible that production of these amides occurred on surfaces of interstellar dust grains during the dense cloud stage of the star formation process in NGC 6334I. The relatively minor abundance variations between MM1 and MM2 can be the result of slightly different physical conditions, such as higher radiation fields, resulting in the efficient photodestruction of one or more of the amides, either in the ice mantles or gas phase.
The comparison of (tentative) abundances of CH3C(O)NH2, CH3NHCHO, and NH2C(O)NH2 in NGC 6334I with abundances of these species toward other sources shows that these are quite similar. This hints that similar processes may be responsible for the formation of these species, but due to the limited number of detections and different observing parameters, it is too early to draw any strong conclusion. A different trend is observed for [NH2CN]/[NH2CHO], for which abundances vary by three orders of magnitude over a large number of observed sources. This variation seems to depend on the source type, with high ratios toward low-mass and prestellar sources and low ratios toward high-mass sources. The origin of this variation is not easily explained and could depend on different reaction pathways and physical conditions, and is perhaps affected by observational parameters as well. More experimental and theoretical work is needed to confirm this. However, it is likely that NH2CN is not part of the same chemistry that produces the other amides. The rich amide chemistry toward NGC 6334I, in combination with other molecules, such as HC(O)CH2OH, strengthens the case that interstellar molecules contribute to the rapid emergence of biomolecules on planetary objects.
We thank Dr. E. G. Bøgelund for helpful discussions and support with the data analysis. This paper makes use of the following ALMA data: ADS/JAO.ALMA#2017.1.00717.S, #2017.1.00661.S, and #2015.A.00022.T. ALMA is a partnership of ESO (representing its member states), NSF (USA) and NINS (Japan), together with NRC (Canada) and NSC and ASIAA (Taiwan) and KASI (Republic of Korea), in cooperation with the Republic of Chile. The Joint ALMA Observatory is operated by ESO, AUI/NRAO and NAOJ. The National Radio Astronomy Observatory is a facility of the National Science Foundation operated under cooperative agreement by Associated Universities, Inc. Support for B.A.M. was provided by NASA through Hubble Fellowship grant #HST-HF2-51396 awarded by the Space Telescope Science Institute, which is operated by the Association of Universities for Research in Astronomy, Inc., for NASA, under contract NAS5-26555. This research made use of NASA's Astrophysics Data System Bibliographic Services, Astropy, a community-developed core Python package for Astronomy, and APLpy, an open-source plotting package for Python hosted at http://aplpy.github.com.
Appendix A: Chemical Structure and Naming of Amides
According to the definition given by the International Union of Pure and Applied Chemistry, amides are oxoacids, which follow the general chemical formula –E(=O)(OH) (E = carbon, sulfur, or other atom that can make this bond), in which the OH group has been replaced by an NHx group. Proper amides are therefore molecules that, for example, follow the structures R1–C(=O)N–R2R3. However, several molecules that do not adhere to this structure are also called amides, such as cyanamide (NH2CN). Despite technically not being an amide, cyanamide and the other amides covered in this work do share a distinct chemical structure by which they can be grouped together.
All amides discussed in this work have structures involving a double (C=O) or triple bonded (C≡N) group attached to a –NH2 group. The molecular orbitals of these fragments are quite different. The double or triple bonded carbon atom and its counterpart have a flat SP2 and SP hybridized molecular orbital, respectively. Normally, a –NH2 group will have a tetrahydral SP3 orbital, similar to, for example, methane (CH4). Two molecular fragments that form a bond through an SP2 or SP hybridized orbital will form a rigid structure, but fragments that form a bond through an SP3 orbital can usually freely rotate around the bond axis. However, in the case of an amide, the –NH2 group is attached to a carbon atom with an SP2 or SP orbital, causing it to take on an SP2 character, forming a so-called resonance hybrid. This effectively means that the (C=X)–NH2 bond in an amide takes on a double-bond character and becomes a rigid and flat structure. This chemical structure is found in the proper amides (e.g., NH2CHO), but also in cyanamide (NH2CN), thus making this a distinct feature of this group of molecules.
Appendix B: Spectroscopic Linelists
Spectroscopic linelists used in the work are primarily taken from the CDMS database, but several list from the JPL spectroscopic database and literature sources are used as well. Table B1 gives an overview of the catalogs and identifiers for each molecule analyzed in this work and the main works these entries are based on.
Table B1. Linelists and Spectroscopic Literature
| Molecule | Catalog | Literature |
|---|---|---|
| and ID | ||
| NH2CN | JPL | Read et al. (1986) |
| 42003 | ||
| HN12CO | CDMS | Kukolich et al. (1971) |
| 43511 | Hocking et al. (1975) | |
| Niedenhoff et al. (1995) | ||
| Lapinov et al. (2007) | ||
| HN13CO | JPL | Hocking et al. (1975) |
| 44008 | ||
NH CHO CHO | CDMS | Motiyenko et al. (2012) |
| 45512 | Kryvda et al. (2009) | |
| Blanco et al. (2006) | ||
| Vorob'eva & Dyubko (1994) | ||
| Moskienko & Dyubko (1991) | ||
| Gardner et al. (1980) | ||
| Hirota et al. (1974) | ||
| Kukolich & Nelson (1971) | ||
NH CHO CHO | CDMS | Motiyenko et al. (2012) |
| 46512 | Gardner et al. (1980) | |
| Blanco et al. (2006) | ||
| Kryvda et al. (2009) | ||
| CH3C(O)NH2 | Literature | Ilyushin et al. (2004) |
| CH3NHCHO | Literature | Belloche et al. (2017) |
| NH2C(O)NH2 | CDMS | Remijan et al. (2014) |
| 60517 | Brown et al. (1975) | |
| Kasten & Dreizler (1986) | ||
| Kretschmer et al. (1996) |
Download table as: ASCIITypeset image
Appendix C: Identified Spectral Lines
Except for position MM2-iii, molecular line emissions of NH2CN, HN12CO, HN13CO, NH CHO, NH
 CHO, and CH3C(O)NH2 are detected toward all positions. The detected lines are listed in Table C1.
Table C1. Overview of Spectral Lines of Amides Molecules toward NGC 6334I
| Molecule | Transition | Frequency a |

|

| |
|---|---|---|---|---|---|

| (MHz) |

| (K) | ||
| NH2CN | 14 4 11-13 4 10 | 279 479.5918 (0.0066) | 2.05 × 10⁻³ | 398 | |
| 14 4 10-13 4 9 | 279 479.5921 (0.0066) | 2.05 × 10⁻³ | 398 | ||
| 14 0 14-13 0 13 | 279 600.4593 (0.0049) | 2.24 × 10⁻³ | 172 | ||
| 14 4 10-13 4 9 | 279 763.3778 (0.0056) | 2.12 × 10⁻³ | 332 | ||
| 14 4 11-13 4 10 | 279 763.3778 (0.0056) | 2.12 × 10⁻³ | 332 | ||
| 14 0 14-13 0 13 | 279 818.8464 (0.0060) | 2.30 × 10⁻³ | 101 | ||
| 14 2 13-13 2 12 | 279 820.8787 (0.0037) | 2.26 × 10⁻³ | 159 | ||
| 14 2 12-13 2 11 | 279 900.1968 (0.0037) | 2.26 × 10⁻³ | 159 | ||
| HN12CO | 6 1 6-5 1 5 | 131 394.2300 (0.0004) | 2.92 × 10⁻⁵ | 65 | |
| 6 4 2-5 4 1 | 131 733.5888 (0.0029) | 1.41 × 10⁻⁵ | 673 | ||
| 6 4 3-5 4 2 | 131 733.5888 (0.0029) | 1.41 × 10⁻⁵ | 673 | ||
| 6 3 4-5 3 3 | 131 799.2971 (0.0024) | 2.07 × 10⁻⁵ | 397 | ||
| 6 3 3-5 3 2 | 131 799.2972 (0.0024) | 2.07 × 10⁻⁵ | 397 | ||
| 6 2 5-5 2 4 | 131 845.8900 (0.0014) | 2.61 × 10⁻⁵ | 192 | ||
| 6 2 4-5 2 3 | 131 846.5998 (0.0014) | 2.61 × 10⁻⁵ | 192 | ||
| 6 0 6-5 0 6 | 131 885.7341 (0.0005) | 3.08 × 10⁻⁵ | 22 | ||
| 16 1 16-15 1 15 | 350 333.0590 (0.0100) | 5.97 × 10⁻⁴ | 186 | ||
| 16 3 13-15 3 12 | 351 416.8123 (0.0052) | 5.31 × 10⁻⁴ | 518 | ||
| 16 3 14-15 3 13 | 351 416.7983 (0.0052) | 5.31 × 10⁻⁴ | 518 | ||
| 16 2 15-15 2 14 | 351 537.7954 (0.0030) | 5.75 × 10⁻⁴ | 314 | ||
| 16 2 14-15 2 13 | 351 551.5731 (0.0032) | 5.75 × 10⁻⁴ | 314 | ||
| 16 0 16-15 0 15 | 351 633.2570 (0.0100) | 6.13 × 10⁻⁴ | 143 | ||
| 40 1 40-39 1 39 | 875 046.1710 (0.0031) | 9.50 × 10⁻³ | 905 | ||
| 40 3 38-39 3 37 | 877 808.5933 (0.0111) | 8.68 × 10⁻³ | 1239 | ||
| 40 3 37-39 3 36 | 877 809.9771 (0.0112) | 8.68 × 10⁻³ | 1239 | ||
| 40 2 39-39 2 38 | 878 062.2368 (0.0063) | 9.25 × 10⁻³ | 1035 | ||
| 40 0 40-39 0 39 | 878 137.4392 (0.0029) | 9.72 × 10⁻³ | 864 | ||
| 40 2 38-39 2 37 | 878 276.9143 (0.0065) | 9.26 × 10⁻³ | 1035 | ||
| 41 1 41-40 1 40 | 896 873.8160 (0.0150) | 1.02 × 10⁻² | 948 | ||
| HN13CO | 6 1 6-5 1 5 | 131 397.0955 (0.0084) | 2.96 × 10⁻⁵ | 65 | |
| 6 0 6-5 0 5 | 131 889.4868 (0.0128) | 3.06 × 10⁻⁵ | 22 | ||
| 16 1 16-15 1 15 | 350 340.3407 (0.0908) | 6.18 × 10⁻⁴ | 186 | ||
| 16 0 16-15 0 15 | 351 642.8746 (0.0763) | 6.27 × 10⁻⁴ | 143 | ||
NH CHO CHO | 6 1 5-5 1 4 | 131 617.9025 (0.0005) | 1.56 × 10⁻⁴ | 25 | |
| 25 2 23-25 1 24 | 280 689.4724 (0.0009) | 5.21 × 10⁻⁵ | 351 | ||
| 12 5 8-13 4 9 | 281 381.6715 (0.0012) | 1.04 × 10⁻⁵ | 154 | ||
| 15 2 14-15 1 15 | 281 934.6250 (0.0008) | 3.40 × 10⁻⁵ | 134 | ||
| 14 3 11-14 2 12 | 282 822.5932 (0.0009) | 5.44 × 10⁻⁵ | 134 | ||
| 15 2 14-15 0 15 | 294 753.3491 (0.0008) | 1.07 × 10⁻⁵ | 134 | ||
| 14 2 13-13 2 12 | 294 776.9896 (0.0009) | 1.84 × 10⁻³ | 118 | ||
| 17 3 15-17 2 16 | 336 733.0134 (0.0009) | 8.20 × 10⁻⁵ | 183 | ||
| 16 13 3-15 13 2 | 339 746.2586 (0.0023) | 9.84 × 10⁻⁴ | 640 | ||
| 16 13 4-15 13 3 | 339 746.2586 (0.0023) | 9.84 × 10⁻⁴ | 640 | ||
| 16 7 10-15 7 9 | 339 779.5370 (0.0300) | 2.34 × 10⁻³ | 284 | ||
| 16 7 9-15 7 8 | 339 779.5370 (0.0300) | 2.34 × 10⁻³ | 284 | ||
| 16 2 14-15 2 13 | 349 478.2047 (0.0009) | 3.10 × 10⁻³ | 153 | ||
| 9 2 8-8 1 7 | 349 634.0304 (0.0012) | 6.22 × 10⁻⁵ | 58 | ||
| 41 734-40 7 33 | 874 836.2150 (0.0500) | 4.89 × 10⁻² | 1025 | ||
| 42 2 40-41 2 39 | 875 818.8790 (0.0500) | 5.01 × 10⁻² | 940 | ||
| 15 5 10-14 4 11 | 876 148.3790 (0.0500) | 1.11 × 10⁻³ | 197 | ||
| 41 5 37-40 5 36 | 876 252.7700 (0.0500) | 4.98 × 10⁻² | 956 | ||
| 41 6 36-40 6 35 | 876 493.3340 (0.0500) | 4.95 × 10⁻² | 988 | ||
| 41 6 35-40 6 34 | 878 706.9000 (0.0500) | 4.99 × 10⁻² | 988 | ||
| 22 3 19-21 2 20 | 879 169.0967 (0.0022) | 3.84 × 10⁻⁴ | 287 | ||
| 42 13 29-41 13 28 | 891 600.4990 (0.0500) | 4.82 × 10⁻² | 1422 | ||
| 42 13 30-41 13 29 | 891 600.4990 (0.0500) | 4.82 × 10⁻² | 1422 | ||
| 43 3 41-42 3 40 | 893 045.4010 (0.0500) | 5.32 × 10⁻² | 983 | ||
| 45 0 45-44 1 44 | 893 077.5610 (0.0500) | 2.76 × 10⁻³ | 997 | ||
| 45 1 45-44 1 44 | 893 083.8870 (0.0500) | 5.35 × 10⁻² | 997 | ||
| 45 0 45-44 0 44 | 893 085.9940 (0.0500) | 5.35 × 10⁻² | 997 | ||
| 45 1 45-44 0 44 | 893 092.3230 (0.0500) | 2.76 × 10⁻³ | 997 | ||
| 44 2 43-43 2 42 | 893 184.3320 (0.0500) | 5.34 × 10⁻² | 992 | ||
| 42 9 34-41 9 33 | 893 415.4200 (0.0500) | 5.12 × 10⁻² | 1162 | ||
| 42 9 33-41 9 32 | 893 415.4200 (0.0500) | 5.12 × 10⁻² | 1162 | ||
| 42 8 35-41 8 34 | 894 533.0350 (0.0500) | 5.19 × 10⁻² | 1112 | ||
| 42 8 34-41 8 33 | 894 550.9190 (0.0500) | 5.19 × 10⁻² | 1112 | ||
| 43 2 41-42 2 40 | 895 080.2490 (0.0500) | 5.35 × 10⁻² | 983 | ||
NH CHO CHO | 6 1 5-5 1 4 | 131 495.8540 (0.0100) | 1.55 × 10⁻⁴ | 25 | |
| 13 1 12-12 1 11 | 282 107.1134 (0.0026) | 1.63 × 10⁻³ | 98 | ||
| 14 1 14-13 1 13 | 282 693.5048 (0.0027) | 1.65 × 10⁻³ | 105 | ||
| 16 8 8-15 8 7 | 339 213.4944 (0.0029) | 2.16 × 10⁻³ | 324 | ||
| 16 8 9-15 8 8 | 339 213.4944 (0.0029) | 2.16 × 10⁻³ | 324 | ||
| 16 2 14-15 2 13 | 349 308.8534 (0.0030) | 3.10 × 10⁻³ | 153 | ||
| CH3C(O)NH2 | 23 10 14-22 9 13 | 351 083.4533 (0.0458) | 2.12 × 10⁻³ | 235 | |
| 22 10 12-21 11 11 | 351 097.8247 (0.0412) | 1.89 × 10⁻³ | 225 | ||
| 22 11 12-21 10 11 | 351 097.8510 (0.0412) | 1.89 × 10⁻³ | 225 | ||
| 24 8 16-23 9 15 | 351 134.2229 (0.0499) | 2.32 × 10⁻³ | 244 | ||
| 24 9 16-23 8 15 | 351 134.2229 (0.0499) | 2.32 × 10⁻³ | 244 | ||
| 25 7 18-24 8 17 | 351 214.4618 (0.0534) | 2.51 × 10⁻³ | 253 | ||
| 25 8 18-24 7 17 | 351 214.4618 (0.0534) | 2.51 × 10⁻³ | 253 | ||
| 26 6 20-25 7 19 | 351 309.0658 (0.0563) | 2.69 × 10⁻³ | 260 | ||
| 26 7 20-25 6 19 | 351 309.0658 (0.0563) | 2.69 × 10⁻³ | 260 | ||
| 29 3 26-28 4 25 | 351 621.6370 (0.0657) | 3.18 × 10⁻³ | 276 | ||
| 29 4 26-28 3 25 | 351 621.6370 (0.0657) | 3.18 × 10⁻³ | 276 | ||
| 31 1 30-30 2 29 | 351 830.6986 (0.0819) | 3.47 × 10⁻³ | 282 | ||
| 31 2 30-30 1 29 | 351 830.6986 (0.0819) | 3.47 × 10⁻³ | 282 | ||
| CH3NHCHO | 11 3 8-10 3  b
b
| 130 190.7247 (0.0009) | 9.21 × 10⁻⁵ | 43 | |
| 12 2 11-11 2 10 | 130 874.1508 (0.0010) | 9.75 × 10⁻⁵ | 44 | ||
11 2 9-10 2  b
b
| 131 427.7286 (0.0009) | 9.86 × 10⁻⁵ | 40 | ||
| 13 8 5-12 8 4 | 144 416.877 (0.0014) | 8.97 × 10⁻⁵ | 97 | ||
| 9 7 2-8 6 2 | 279 381.6637 (0.0035) | 5.18 × 10⁻⁴ | 62 | ||
25 12 13-24 12  b
b
| 280 384.9819 (0.0041) | 8.20 × 10⁻⁴ | 274 | ||
25 14 11-24 14  b
b
| 280 716.5012 (0.0202) | 6.82 × 10⁻⁴ | 308 | ||
| 25 10 15-24 10 14 | 280 743.3675 (0.0049) | 8.94 × 10⁻⁴ | 245 | ||
24 5 19-23 5  b
b
| 280 994.8045 (0.0021) | 9.96 × 10⁻⁴ | 186 | ||
| 25 13 13-24 13 12 | 281 110.7375 (0.0045) | 7.76 × 10⁻⁴ | 291 | ||
| 25 13 12-24 13 11 | 281 113.0259 (0.0046) | 7.81 × 10⁻⁴ | 291 | ||
| 25 11 14-24 11 13 | 282 584.3703 (0.0088) | 8.55 × 10⁻⁴ | 259 | ||
| 26 9 17-25 9 16 | 291 978.5554 (0.0027) | 1.06 × 10⁻³ | 247 | ||
| 26 12 14-25 12 13 | 292 546.3434 (0.0055) | 9.46 × 10⁻⁴ | 288 | ||
| 26 5 22-25 5 21 | 292 648.065 (0.0023) | 1.13 × 10⁻³ | 211 | ||
26 15 11-25 15  b
b
| 292 847.7083 (0.0108) | 8.05 × 10⁻⁴ | 341 | ||
| 25 5 20-24 5 19 | 293 006.2032 (0.0023) | 1.14 × 10⁻³ | 200 | ||
| 8 8 0-7 7 0 | 294 241.2632 (0.0049) | 7.64 × 10⁻⁴ | 67 | ||
| 34 0 34-33 0 33 | 337 907.4314 (0.0048) | 1.30 × 10⁻³ | 291 | ||
| 34 1 34-33 1 33 | 337 907.4314 (0.0048) | 1.30 × 10⁻³ | 291 | ||
| 34 1 34-33 0 33 | 337 907.4314 (0.0048) | 1.30 × 10⁻³ | 291 | ||
| 34 0 34-33 1 33 | 337 907.4314 (0.0048) | 1.30 × 10⁻³ | 291 | ||
30 10 20-29 10  b
b
| 337 993.2492 (0.0041) | 1.61 × 10⁻³ | 321 | ||
| 30 4 26-29 4 25 | 338 606.6396 (0.0028) | 1.74 × 10⁻³ | 272 | ||
| 29 6 23-28 6 22 | 348 416.9795 (0.0029) | 1.89 × 10⁻³ | 268 | ||
| 31 4 27-30 4 26 | 348 417.6722 (0.009) | 1.39 × 10⁻³ | 288 | ||
| 30 5 25-29 5 24 | 348 837.7283 (0.0030) | 1.94 × 10⁻³ | 279 | ||
31 5 27-30 4  b
b
| 350 710.9037 (0.0031) | 7.43 × 10⁻⁴ | 288 | ||
| NH2C(O)NH2 | 25 3 23-24 2 22 | 279 472.8671 (0.0468) | 2.55 × 10⁻⁴ | 195 | |
| 25 2 23-24 2 22 | 279 472.8671 (0.0468) | 1.25 × 10⁻³ | 195 | ||
| 25 3 23-24 3 22 | 279 472.8671 (0.0468) | 1.25 × 10⁻³ | 195 | ||
| 25 2 23-24 3 22 | 279 472.8671 (0.0468) | 2.55 × 10⁻⁴ | 195 | ||
| 24 5 20-23 4 19 | 282 190.8684 (0.0399) | 1.20 × 10⁻³ | 199 | ||
| 24 5 20-23 5 19 | 282 190.8684 (0.0399) | 2.16 × 10⁻⁴ | 199 | ||
| 24 4 20-23 4 19 | 282 190.8684 (0.0399) | 2.16 × 10⁻⁴ | 199 | ||
| 24 4 20-23 5 19 | 282 190.8684 (0.0399) | 1.20 × 10⁻³ | 199 | ||
| 25 4 21-24 4 20 | 290 862.3844 (0.0473) | 1.48 × 10⁻³ | 213 | ||
| 25 4 21-24 5 20 | 290 862.3844 (0.0473) | 9.83 × 10⁻⁵ | 213 | ||
| 25 5 21-24 5 20 | 290 862.3844 (0.0473) | 9.83 × 10⁻⁵ | 213 | ||
| 25 5 21-24 4 20 | 290 862.3844 (0.0473) | 1.48 × 10⁻³ | 213 | ||
| 22 7 16-21 6 15 | 293 236.5715 (0.0337) | 1.18 × 10⁻³ | 186 | ||
| 22 6 16-21 7 15 | 293 236.5646 (0.0337) | 1.18 × 10⁻³ | 186 | ||
| 21 7 14-20 8 13 | 293 292.5803 (0.0297) | 1.05 × 10⁻³ | 179 | ||
| 21 8 14-20 7 13 | 293 293.5513 (0.0297) | 1.05 × 10⁻³ | 179 | ||
| 24 5 19-23 5 18 | 293 642.0215 (0.0385) | 1.01 × 10⁻⁴ | 208 | ||
| 24 6 19-23 5 18 | 293 642.0215 (0.0385) | 1.39 × 10⁻³ | 208 | ||
| 24 5 19-23 6 18 | 293 642.0215 (0.0385) | 1.39 × 10⁻³ | 208 | ||
| 24 6 19-23 6 18 | 293 642.0215 (0.0385) | 1.01 × 10⁻⁴ | 208 | ||
Notes.
a The uncertainty of each line frequency is given in parentheses. b CH3NHCHO lines that are present on locations where the baseline dips.Appendix D: Spectral Features toward MM1-i and MM2-i
Figures D1–D11 present the detected transitions of the molecules that are not covered in the main text toward positions MM1-i and MM2-i.

Figure D1. Detected transitions of HN12CO in the spectrum toward position MM1-i. The observed spectrum is plotted in black and the rest-frequency center of the transition is indicated by the red dotted line. Because these lines are optically thick, they are not fitted with a synthetic spectrum. The upper state energy of each transition is given in the top-left corner.
Download figure:
Standard image High-resolution image
Figure D2. Detected transitions of HN13CO in the spectrum toward position MM1-i. The observed spectrum is plotted in black, with the synthetic spectrum overplotted in blue and the rest-frequency center of the transition is indicated by the red dotted line. The upper state energy of each transition is given in the top-left corner.
Download figure:
Standard image High-resolution image
Figure D3. Detected transitions of NH CHO in the spectrum toward position MM1-i. The observed spectrum is plotted in black and the rest-frequency center of the transition is indicated by the red dotted line. Because these lines are optically thick, they are not fitted with a synthetic spectrum. The upper state energy of each transition is given in the top-left corner.
Download figure:
Standard image High-resolution image
Figure D4. Detected transitions of NH CHO in the spectrum toward position MM1-i. The observed spectrum is plotted in black, with the synthetic spectrum overplotted in blue and the rest-frequency center of the transition is indicated by the red dotted line. The upper state energy of each transition is given in the top-left corner.
Download figure:
Standard image High-resolution image
Figure D5. Transitions of CH3NHCHO that are missing in the spectrum toward position MM1-nmf due to baseline dips. The observed spectrum is plotted in black, with the synthetic spectrum overplotted in blue and the rest-frequency center of the transition is indicated by the red dotted line. The upper state energy of each transition is given in the top-left corner.
Download figure:
Standard image High-resolution image
Figure D6. Detected transitions of NH2CN in the spectrum toward position MM2-i. The observed spectrum is plotted in black, with the synthetic spectrum overplotted in blue and the rest-frequency center of the transition is indicated by the red dotted line. The upper state energy of each transition is given in the top-left corner.
Download figure:
Standard image High-resolution image
Figure D7. Detected transitions of HN12CO in the spectrum toward position MM2-i. The observed spectrum is plotted in black and the rest-frequency center of the transition is indicated by the red dotted line. Because these lines are optically thick, they are not fitted with a synthetic spectrum. The upper state energy of each transition is given in the top-left corner.
Download figure:
Standard image High-resolution image
Figure D8. Detected transitions of HN13CO in the spectrum toward position MM2-i. The observed spectrum is plotted in black, with the synthetic spectrum overplotted in blue and the rest-frequency center of the transition is indicated by the red dotted line. The upper state energy of each transition is given in the top-left corner.
Download figure:
Standard image High-resolution image
Figure D9. Detected transitions of NH CHO in the spectrum toward position MM2-i. The observed spectrum is plotted in black and the rest-frequency center of the transition is indicated by the red dotted line. Because these lines are optically thick, they are not fitted with a synthetic spectrum. The upper state energy of each transition is given in the top-left corner.
Download figure:
Standard image High-resolution image
Figure D10. Detected transitions of NH CHO in the spectrum toward position MM2-i. The observed spectrum is plotted in black, with the synthetic spectrum overplotted in blue and the rest-frequency center of the transition is indicated by the red dotted line. The upper state energy of each transition is given in the top-left corner.
Download figure:
Standard image High-resolution image
Figure D11. Detected transitions of CH3C(O)NH2 in the spectrum toward position MM2-i. The observed spectrum is plotted in black, with the synthetic spectrum overplotted in blue and the rest-frequency center of the transition is indicated by the red dotted line. The upper state energy of each transition is given in the top-left corner.
Download figure:
Standard image High-resolution image
Footnotes
- 6
Throughout this work, cyanamide will be referred to as an amide for convenience, although strictly speaking it does not follow the chemical definition of an amide. See Appendix A for an extended clarification on the naming and chemical structures of amides.
- 7
CASSIS has been developed by IRAP-UPS/CNRS (http://cassis.irap.omp.eu).