


Abstract
We establish the largest eruptive/confined flare database to date and analyze 322 flares of Geostationary Operational Environmental Satellite class M1.0 and larger that occurred during 2010–2019, i.e., almost spanning all of solar cycle 24. We find that the total unsigned magnetic flux () of active regions (ARs) is a key parameter governing the eruptive character of large flares, with the proportion of eruptive flares exhibiting a strong anticorrelation with . This means that an AR containing a large magnetic flux has a lower probability that the large flares it produces will be associated with a coronal mass ejection (CME). This finding is supported by the high positive correlation we obtained between the critical decay index height and , implying that ARs with a larger have a stronger magnetic confinement. Moreover, the confined flares originating from ARs larger than Mx have several characteristics in common: stable filament, slipping magnetic reconnection, and strongly sheared post-flare loops. Our findings reveal new relations between the magnetic flux of ARs and the occurrence of CMEs in association with large flares. The relations obtained here provide quantitative criteria for forecasting CMEs and adverse space weather, and have important implications for "superflares" on solar-type stars and stellar CMEs.


1. Introduction
Solar flares and coronal mass ejections (CMEs) are the most energetic phenomena in our solar system and are the dominant contributors to adverse space weather at Earth (Gosling et al. 1991; Green et al. 2018). They originate from the rapid release of free magnetic energy stored in the sheared or twisted magnetic fields of active regions (ARs) through magnetic reconnection (Forbes 2000; Shibata & Magara 2011). Magnetic reconnection is believed to be a fundamental process in magnetized plasma systems throughout the universe, and entails magnetic energy being stored over relatively long times then released suddenly in bursts of various forms (thermal, kinetic, and high-energy particle) (Priest & Forbes 2000; Su et al. 2013). Flares associated with a CME are usually referred to as eruptive events, while flares that are not accompanied by a CME are called confined or "CME-less" events (Moore et al. 2001). The association rate of flares and CMEs has revealed that most small flares occur without a CME, whereas for large flares (M-class, X-class) the CME association is steeply increasing, and reaches 100% for the biggest events (Andrews 2003; Yashiro et al. 2006). The broad variety of strong space weather effects is mostly due to the CME rather than the flare itself. Our understanding of the physical mechanisms of flares and their relationship with CMEs is important to forecast space weather in the near-Earth environment (Forbes 2000; Shibata & Magara 2011). Also, the solar flare-CME paradigm might be applied to magnetic activities in other stars, which is vital for resolving the question of exoplanet habitability and the evolution of stellar mass loss and rotation (Khodachenko et al. 2007; Lammer et al. 2007).
Substantial observational studies have revealed that a flare would be confined if the strapping magnetic field overlying the flaring region were too strong or did not decrease sufficiently fast with height (Green et al. 2002; Wang & Zhang 2007; Cheng et al. 2011; Yang et al. 2014; Chen et al. 2015; Thalmann et al. 2015). To quantify the decline of the strapping field with height, the decay index has been used (Kliem & Török 2006; Fan & Gibson 2007; Zuccarello et al. 2015), i.e., n = −d /, with Bhor denoting the horizontal field and the height in the corona. The torus instability of a magnetic flux rope occurs when the decay index reaches a critical value (Kliem & Török 2006; Fan & Gibson 2007). Recent magnetohydrodynamics (MHD) simulations showed that the overlying field lines form a confining cage and a weaker magnetic cage would produce a more energetic eruption with a CME (Amari et al. 2018). Another important factor that governs the eruptive character of solar flares is the nonpotentiality of ARs. Statistical studies have shown that flare and CME productivity are correlated with magnetic shear, electric current, magnetic free energy, etc. (Hagyard & Rabin 1986; Falconer et al. 2002; Liu et al. 2016a). It is suggested that AR eruptivity is related to the relative value of magnetic nonpotentiality over the restriction of the background field (Sun et al. 2015).


In this paper, we derive important quantitative relations between the magnetic properties of ARs and the eruptive character of large solar flares, based on Solar Dynamics Observatory (SDO; Pesnell et al. 2012) observations during the period of solar cycle 24. A total of 322 flares (170 eruptive and 152 confined) of Geostationary Operational Environmental Satellite (GOES) class M1.0 and larger that occurred within 45° from the central meridian, from 2010 June until 2019 June, are selected. About 51% (155 of 301) of the M-class flares are eruptive and the percentage increases up to ∼71% (15 of 21) for X-class flares, similar to previous results (Yashiro et al. 2006). To our knowledge, the eruptive/confined flare sample established in this study is by far the largest one in the era of SDO. We show that the total unsigned magnetic flux of ARs () is a decisive parameter in governing the eruptive character of flares, and the proportion of eruptive flares exhibits a strong anticorrelation with . This finding is further supported by the high correlation obtained between and the critical height for torus instability.


The rest of the paper is organized as follows. In Sections 2 and 3, we describe the data analysis and show the statistical results, respectively. Section 4 presents a detailed analysis for six events as typical examples. Finally, we summarize our findings and discuss their implications in Section 5.
2. Data Analysis
2.1. Event Sample
The SDO satellite has already provided a rich database since its launch in 2010 February. Its observation period lasts about 10 yr and almost spans the entirety of solar cycle 24. Thus, it provides a good opportunity to carry out a statistical analysis of the flare-CME mechanism based on SDO observations. First, we examined the database RibbonDB presented by Kazachenko et al. (2017) and selected all 302 flare events larger than M1.0 that occurred within 45° from the central meridian, from 2010 June until 2016 April. To extend the time period, we checked for the GOES soft X-ray (SXR) flare catalog to search for flare events from 2016 May to 2019 June and found 20 flares of GOES class M1.0 and greater. A total of 322 flare events are involved in our database over a 9 year period. Second, for each flare, its CME association was determined by checking the CME catalog7 (Gopalswamy et al. 2009) of the Solar and Heliospheric Observatory (SOHO)/Large Angle and Spectrometric Coronagraph (LASCO). We regarded a flare as eruptive if the CME onset time was within 90 minutes of the flare start time and the position angle of the CME agreed with the quadrant on the Sun where the flare occurred. Moreover, we also inspected the observations of the twin Solar Terrestrial Relations Observatory (STEREO; Howard et al. 2008; Kaiser et al. 2008) to check from a different viewing angle if there is an associated CME. For the events where it was difficult to determine the classification, e.g., there are two flares within a short time or the CME is too weak to be identified, we checked the EUV observations from the Atmospheric Imaging Assembly (AIA; Lemen et al. 2012) on board the SDO and identified the coronal EUV wave manually. If a global coronal EUV wave was associated with the flare, the flare was classified as eruptive. Out of these 322 flares, 170 (∼53%) events were eruptive (155 M- and 15 X-) and 152 (∼47%) were confined (146 M- and 6 X-).
2.2. Data and Methods
We investigated the relations between the AR parameters (unsigned AR magnetic flux and AR area) and the eruptive character of large solar flares. The AR parameters in the RibbonDB catalog (Kazachenko et al. 2017) are calculated based on the full-disk Helioseismic and Magnetic Imager (HMI; Scherrer et al. 2012) vector magnetogram data series (hmi.B_720s) before the flare onset time. To avoid noisy magnetic fields, only pixels that host a normal component of the magnetic field G are considered. For the flare events that are not included in the RibbonDB catalog, we use the available vector magnetograms (hmi.sharp_cea_720s) from Space-Weather HMI AR Patches (Bobra et al. 2014) before the flare onset. The magnetograms were re-mapped using a cylindrical equal area projection with a pixel size of ∼0 5 and presented as (Br, , B) in heliocentric spherical coordinates corresponding to (Bz, −By, Bx) in heliographic coordinates (Sun 2013). Similarly, to calculate the AR magnetic flux and AR area, we consider all pixels of G. Moreover, the RibbonDB catalog (Kazachenko et al. 2017) also includes the parameters of flare ribbons such as the flare ribbon reconnection flux , the cumulative flare ribbon area Sribbon, the ratio of the AR magnetic flux involved in the flare reconnection Rflux (/), and the area ratio RS (Sribbon/SAR). In this work, we also use these parameters of 302 flare events larger than M1.0 and investigate their distributions and correlations in eruptive and confined flares.


The role of the background coronal fields in confined and eruptive flares was estimated by calculating the decay index n above the ARs. In order to extrapolate the 3D magnetic field in the entire AR volume, we use the Fourier transformation method (Alissandrakis 1981) to extrapolate the potential field. The method yields the local potential field with a resolution around 0.72 Mm, the same as the resolution of the boundary condition. The boundary condition is the normal component of the photospheric magnetic field from Space-Weather HMI AR Patches (Bobra et al. 2014) observed prior to the flare start. From the extrapolated field, the mean value of the horizontal magnetic field, , as a function of height is obtained along the main polarity inversion line (PIL) and an average decay index, , is then derived. Here, the main PIL was identified as a zero Gauss contour in the bottom vertical magnetic field (Br) image from the extrapolated potential fields (Bokenkamp 2007; Vasantharaju et al. 2018). To analyze the structure and dynamics of typical flare examples, we used the E(UV) observations from the AIA, with a resolution of ∼06 per pixel and a cadence of 12(24) s. Five channels of AIA 1600, 304, 171, 94, and 131 Å were mainly applied to analyze the appearances of the flares. The full-disk line-of-sight (LOS) magnetic field data from the HMI are also used to present the ARs producing typical flare examples.


3. Statistical Results
3.1. Magnetic Properties of ARs and Eruptive Character of Solar Flares
Figure 1(a) shows a scatter plot of the flare peak X-ray flux versus . Blue (red) circles are the eruptive (confined) flares. When is small enough, the flares tend to be eruptive (Area A in Figure 1(a)). About 92% (36 of 39) of events occurring in ARs with smaller than Mx are eruptive. An overwhelming majority of flares that are hosted by ARs with a large magnetic flux do not generate CMEs (Area C in Figure 1(a)). The proportion of confined flares of GOES class M1 is ∼93% (26 of 28), corresponding to the AR with larger than Mx. We examined two special eruptive events (M4.0-class flare on 2014 October 24 in Figure 10 and X1.8-class event on 2014 December 20) in Area C of Figure 1(a) and found that they either were located at the edge of the AR or caused a sympathetic eruption of a nearby quiescent filament. If the AR has a moderate magnetic flux (larger than Mx and smaller than Mx), the likelihood of eruptive and confined events appears to be almost equal (132 eruptive flares and 126 confined events of 258 in Area B of Figure 1(a)). The scatter plot of the flare peak X-ray flux versus total AR area shows a similar trend (Figure 1(b)). All flares in ARs with an area smaller than are eruptive (Area A in Figure 1(b)) and all flares in ARs larger than are confined (Area C in Figure 1(b)).


Figure 1. Relations of the eruptive character of large solar flares with unsigned AR magnetic flux and AR area. Top: scatter plots of flare peak X-ray flux vs. unsigned AR magnetic flux and AR area. Blue (red) circles are the eruptive (confined) flares. The two vertical dashed–dotted lines in panel (a) respectively refer to AR magnetic flux of and Mx. The two vertical dashed–dotted lines in panel (b) respectively correspond to AR areas of and cm2. Middle: histograms of AR magnetic flux and AR area for confined (red) and eruptive (blue) events. The dotted vertical lines indicate the means of the log values. Bottom: proportions of eruptive flares PE vs. unsigned AR magnetic flux and AR area. The orange lines show the results of linear fitting, and slopes α and Spearman rank-order correlation coefficients rs are shown to the bottom left.


Download figure:
Standard image High-resolution imageFigures 1(c)–(d) display the histograms for confined and eruptive events. There are significant differences in distributions of AR magnetic flux and AR area between the confined and eruptive cases. The confined events have larger AR magnetic flux and AR area. The averages of the log values of (indicated by vertical dotted lines) are Mx and Mx for confined and eruptive cases, respectively. The log-mean values of AR area for the confined and eruptive events are and , respectively. Based on the the number distributions of AR magnetic flux and AR area between the confined and eruptive cases, we display the relations of the proportions of eruptive flares PE (PE = NE/(NE + NC), NE, and NC are numbers of eruptive and confined events, respectively) with and AR area in Figures 1(e)–(f). It can be seen that PE decreases with . The proportion PE has a strong anticorrelation with at the Spearman rank-order correlation coefficient rs of –0.97. The Spearman rank correlation provides a measure of the monotonic relationship between two variables. The linear fitting to the scatter plot provides the relation of


where is in units of [Mx].

Similarly, the proportion PE shows a strong anticorrelation with AR area (rs = −0.95), and provides the relation of

where SAR is in units of [cm2].
3.2. Role of the Background Coronal Fields
We investigate the role of the background coronal fields by calculating the decay index n above the ARs. Figure 2 shows four examples including one eruptive flare in Area A of Figure 1(a) and three confined flares in Area C of Figure 1(a). The black asterisks denote the versus h profiles and blue diamonds are the versus h profiles. The error bars mark the corresponding standard deviation. The critical height for torus instability hcrit corresponds to the height where reaches a value of 1.5 (Kliem & Török 2006; Fan & Gibson 2007). Clearly, the hcrit value of AR 11305 (∼17 Mm) with a small magnetic flux is lower than those of three other ARs (36–60 Mm) with larger magnetic fluxes, which means that the constraining field above AR 11305 producing an eruptive flare decays more rapidly than other ARs with confined flares, and therefore a perturbation in the lower corona may cause the CME seed to erupt out more easily (Wang & Zhang 2007; Liu et al. 2018).


Figure 2. Decay index of the coronal background fields for four examples. (a) SDO/HMI photospheric magnetograms Bn with contours of the AIA 1600 Å flare ribbon brightenings (red contours) overplotted. From left to right: eruptive M3.9-class flare in AR 11305, confined flares of class M1.7 in AR 11520, M8.7 in AR 12192, and M1.3 in AR 12242. The green curves denote the flare-relevant PILs along which the mean decay index is calculated. (b) (black asterisks) and (blue diamonds) as a function of height. The error bars mark the corresponding standard deviation. The horizontal black lines denote the position where equals 1.5 and the red vertical lines correspond to the critical height hcrit for each event.


Download figure:
Standard image High-resolution imageFollowing the procedure described above, we estimated the critical decay index heights hcrit for 82 events (including all the events in Areas A and C of Figure 1(a) and 15 flares in Area B of Figure 1(a)). Figure 3(a) shows the scatter plot of hcrit versus . It can be seen that hcrit increases with . This indicates that ARs with a larger magnetic flux tend to have a stronger constraining field. The critical decay index height has a strong correlation with AR magnetic flux at the Spearman rank-order correlation coefficient rs of 0.86. The linear fitting to the scatter plot provides the relation


where hcrit and are in units of [Mm] and [Mx], respectively.


Figure 3. Scatter plots of critical decay index height vs. unsigned AR magnetic flux and flare peak X-ray flux vs. critical decay index height. Blue (red) circles are eruptive (confined) flares. The black solid line in panel (a) shows the result of a linear fitting, and slope α and Spearman rank-order correlation coefficients rs are shown to the bottom right. The two vertical dotted lines in panel (a) denote the positions where respectively equals and Mx. The two horizontal dashed–dotted lines in panel (a) and the two vertical dashed–dotted lines in panel (b) respectively refer to critical decay index heights of 27 and 47 Mm.


Download figure:
Standard image High-resolution imageUsing this equation, an value of Mx yields a hcrit of ∼27 Mm (left vertical and bottom horizontal lines in Figure 3(a)) and Mx corresponds to a hcrit of about 47 Mm (right vertical and top horizontal lines in Figure 3(a)). In Figure 3(b), we plot the flare peak X-ray flux versus hcrit. All flares M1 (28 events) with a hcrit value smaller than 27 Mm are eruptive (Area A in Figure 3(b)), and about 95% (20 of 21) of events with hcrit larger than 47 Mm are confined (Area C in Figure 3(b)). The results of Figures 1 and 3 suggest that stronger strapping fields over the ARs with a larger magnetic flux play the main role in confining the eruption.


3.3. Relations of Flare Reconnection Flux with Flare Peak X-Ray Flux
Figure 4 shows scatter plots of flare ribbon reconnection flux and cumulative flare ribbon area versus flare peak X-ray flux. We find that flare reconnection flux correlates with flare peak X-ray flux FSXR at a moderate rank-order correlation coefficient rs of 0.51 for all the flares (Figure 4(a)). By fitting the data, we obtained their empirical relationship


where and FSXR are in units of [Mx] and [W m−2], respectively.


Figure 4. Scatter plots of unsigned flare reconnection magnetic flux and ribbon area vs. flare peak X-ray flux for confined (red) and eruptive (blue) flares. The red, blue and green straight lines show the results of linear fitting respectively for confined, eruptive and total events. The slopes α and Spearman rank-order correlation coefficients rs are shown to the bottom right.
Download figure:
Standard image High-resolution imageThe rank-order correlation coefficient rs for the subset of eruptive flares (rs = 0.58) is larger than rs for the confined flares (rs = 0.42). The corresponding fitting parameters for the subsets of confined and eruptive flares show no significant differences.
The ribbon area and flare peak X-ray flux (Figure 4(b)) also show a moderate correlation with a rank-order correlation coefficient rs of 0.58 and their relation is

where Sribbon and FSXR are in units of [cm2] and [W m−2], respectively.
Similarly, there are no significant differences in the fitting parameters when considering confined and eruptive flares separately.
3.4. Flare Reconnection Flux Ratio and Area Ratio in Confined and Eruptive Flares
In Figures 5(a)–(b), we display the histograms of flare reconnection flux ratio Rflux (/) and ribbon area ratio RS (Sribbon/SAR) for confined and eruptive events. It can be seen that the distributions of both Rflux and RS show evident differences, with Rflux and RS for confined events smaller than those for eruptive flares. Rflux ranges between 1% and 41% for eruptive flares and ranges between 1% and 21% for confined events. The proportion of eruptive flares reaches ∼89% (39 of 44), corresponding to a flux ratio Rflux higher than 15%. The log averages of flux ratio Rflux are 6.3% and 9.5% for confined and eruptive events, respectively. Similarly, the confined flares have a smaller area ratio RS (1%–18%) than eruptive events (1%–30%). The log-mean values of area ratio RS are 4.0% and 6.1% for confined and eruptive cases, respectively.


Figure 5. Histograms of the ratios of flare reconnection flux/AR flux and ribbon area/AR area for confined (red) and eruptive (blue) events. The dotted vertical lines indicate the means of the log values.
Download figure:
Standard image High-resolution image4. Appearances of Typical Flare Examples
4.1. Two Confined Flares within ARs of Large Magnetic Flux
We investigate the dynamic evolution of confined flares originating from ARs with a large magnetic flux ( Mx), including 26 events from 5 different ARs (ARs 11339, 11520, 11967, 12192, and 12242). After examining the AIA observations of these confined flares, we find that they have common characteristics: slipping reconnection, strong shear, and a stable filament. Here, two confined events from ARs 11520 and 12242 are taken as examples to analyze the flare dynamics and magnetic topological structures in detail.

On 2012 July 10, a confined M1.7 flare occurred in the sigmoidal region of AR 11520 with of Mx. The flare was initiated at 04:58 UT and the GOES SXR flux peaked at 05:14 UT. Before the flare started, a filament was located along the PIL at the flaring region (left panel in Figure 6(a)). It did not show any rise process during the flare and was stably present after the flare (right panel in Figure 6(a)). A comparison of the 304 Å image with the HMI LOS magnetogram showed that the flare consisted of two positive-polarity ribbons PR1–PR2 and two negative-polarity ribbons NR1–NR2 (middle panel in Figure 6(a)). Ribbons PR1 and NR1 were located at two ends of the filament and PR2 and NR2 resided at both sides of the main body (axis) of the filament. High-temperature flare loops at 94 Å displayed notable dynamic evolution (Figure 6(b)). To display the fine structures of the EUV images, the 94 Å filter channel data have been processed using the multiscale Gaussian normalization (MGN) method (Morgan & Druckmüller 2014). At the start of the flare, two sets of loop bundles L1 (connecting PR2–NR1) and L2 (connecting PR1–NR2) overlying the stable filament became bright. Starting from about 05:10 UT, a group of brightened short loops L3 was formed connecting PR2 and NR2; meanwhile another longer loop bundle L4, linking PR1–NR1, can be discerned. During the flare, the north parts of loop bundles L2 and L3 exhibited apparent bidirectional slipping motions along ribbon NR2. Finally, strongly sheared post-flare loops (PFLs) appeared above the noneruptive filament. Based on the dynamic evolution of flare loops and their relations with flare ribbons, we suggest that slipping magnetic reconnection (Priest & Démoulin 1995; Aulanier et al. 2006) between loop bundles L1 and L2 occurred and led to the formation of L3 and L4. We estimated the inclination angles θ of PFLs with respect to the PIL, corresponding to the angle between the tangents of the PFL and PIL at their intersection (left panel in Figure 6(c)). The complementary angle of θ has been referred to as the shear angle in previous studies (Su et al. 2007; Aulanier et al. 2012). We derive small θ values, ranging from 10° to 30°, indicative of a high nonpotentiality in the form of a strong shear. Then more high-temperature PFLs gradually cooled down and formed PFLs overlying the stable filament at 171 Å (Figure 6(c)).


Figure 6. Appearance of the confined M1.7-class flare in AR 11520 on 2012 July 10. (a) SDO/AIA 304 Å images showing the stable filament before and after the flare. The green and blue contours are the LOS magnetic fields at ±750 G levels. PR1–PR2 are two positive-polarity flare ribbons and NR1–NR2 are two negative-polarity ribbons. (b) AIA 94 Å images displaying the dynamic evolution of high-temperature flare loops. The red contours denote the AIA 1600 Å flare brightenings. L1–L4 outline four sets of loop bundles and the white arrow points to sheared PFLs. (c) AIA 171 Å images showing the low-temperature PFLs. Two sets of PFLs (purple and blue dashed–dotted curves) are delineated to estimate their inclination angles with respect to the PIL (green dashed–dotted line). The animation of this figure includes the AIA 304, 171 ,and 94 Å images; it also includes 94 Å images sharpened using the MGN method. The images run from 04:58 UT to 05:41 UT. The video duration is 3 s.
(An animation of this figure is available.)
Download figure:
Video Standard image High-resolution imageUsing the photospheric vector magnetic field observed by SDO/HMI at 04:24 UT, we make a nonlinear force-free extrapolation by applying the optimization method (Wheatland et al. 2000; Wiegelmann 2004) and obtain the 3D coronal magnetic fields. There are two sets of sheared magnetic systems (MS1 and MS2 in Figure 7(a)) overlying a twisted flux rope (FR) prior to the flare onset. By comparing the AIA observations with the extrapolation results, we suggest that the two magnetic systems MS1 and MS2 approximately correspond to two sets of loop bundles L1 and L2 (Figure 6(b)) and the flux rope FR bears a good resemblance to the observed noneruptive filament (Figure 6(a)). Based on the extrapolated 3D coronal magnetic field, we calculated the squashing factor Q (Liu et al. 2016b), which defines the locations of the quasiseparatrix layers (QSLs; Démoulin et al. 1996; Titov et al. 2002). As seen from the distribution of Q (Figure 7(b)), the observed flare ribbons roughly match the locations of high Q values, implying that the magnetic reconnection involved in the flare probably occurs in regions of very strong magnetic connectivity gradients, i.e., QSLs.

Figure 7. Magnetic field configuration of the flare region. (a) Side view of extrapolated field lines showing two magnetic systems MS1–MS2 and the underlying flux rope FR. (b) Map of the squashing factor Q on the HMI bottom boundary calculated from the nonlinear force-free field. The green contours outline the flare ribbon brightenings in the AIA 1600 Å channel.
Download figure:
Standard image High-resolution imageFigure 8 shows another confined M1.3-class flare on 19 December 2014 in AR 12242, which has a large of Mx. The flare was initiated at 09:31 UT and peaked at 09:44 UT. It occurred in the northwest of AR 12242 and a filament was present along the PIL at the flaring region (Figure 8(a)). During the flare process, the main body of the filament did not show any rise phase except for the mild activation at its south part. After the flare, the filament remained stabilized, similar to the filament in the confined M1.7-class flare in AR 11520 (Figure 6(a)). Two quasi-parallel flare ribbons were distinguished from AIA 304 Å images, including ribbon PR in the leading positive-polarity sunspot and the negative-polarity ribbon NR. As shown from the high-temperature 131 Å observations, the flare loops were composed of two sets of magnetic systems S1 and S2 overlying the noneruptive filament, displaying a clear "X-shape" structure (Figure 8(b)). The south ends of systems S1 and S2 were anchored in ribbon PR and their north ends were in ribbon NR. During the flare evolution, S1 and S2 exhibited apparent slipping motions along ribbons PR and NR, and more flare loops successively appeared. In the gradual phase of the flare, low-temperature PFLs were formed, as best observed in the AIA 171 Å channel (Figure 8(c)). Similarly, the early formed PFLs also displayed an "X-shape" structure. We estimated the inclination angles θ of PFLs with respect to the PIL and found θ values in the range of 20°–28°. The small θ values imply that the PFLs are strongly sheared and have a higher nonpotentiality.


Figure 8. Appearance of the confined M1.3-class flare in AR 12242 on 19 December 2014. (a) SDO/AIA 304 Å images showing the noneruptive filament throughout the flare. The green and blue contours are the HMI LOS magnetic fields at ±350 G levels. NR and PR are two quasi-parallel flare ribbons. The white square denotes the field of view of Figure 9. (b) AIA 131 Å images displaying two magnetic systems S1 and S2. The green dashed–dotted curve "A–B" shows the cut position used to obtain the stack plot shown in Figure 9. (c) AIA 171 Å images showing the low-temperature PFLs. The red and blue dotted curves outline the PFLs at different times and the black dashed–dotted line delineates the PIL associated with the flare. The animation of this figure includes the AIA 304, 171, and 131 Å images; it also includes 131 Å images sharpened using the MGN method. The images run from 09:25 UT to 10:11 UT. The video duration is 3 s.
(An animation of this figure is available.)
Download figure:
Video Standard image High-resolution imageThe apparent slipping motions of the fine structures within flare ribbons are further displayed in Figure 9. Ribbon PR was composed of numerous bright dot-like substructures, corresponding to the footpoints of high-temperature flare loops. These substructures exhibited apparent slipping motions in opposite directions (Figure 9(a)). We followed the trails of three different substructures within ribbon PR. From 09:33:10 UT, the bright knot "1" slipped toward the east with a displacement of about 3.8 Mm in 110 s (with a velocity of ∼30 km s−1). Meanwhile, another bright knot "2" displayed a rapid slipping motion in the opposite direction at a velocity of ∼130 km s−1. At 09:34:58 UT, the bright knot "3" at the middle part of PR underwent a fast slippage toward the northeast. In order to analyze the slipping motions of the substructures, we create a stack plot (Figure 9(c)) along slice "C–D" in the AIA 131 Å images (blue curve in Figure 9(a)). As seen from the stack plot, the slipping motions along ribbon PR were in both directions with speeds of 20–150 km s−1. Figure 9(b) shows the stack plot of the other ribbon NR along slice "A–B" (green dashed–dotted curve in Figure 8(b)). Similarly, the slippage along ribbon NR was bidirectional, with apparent speeds of 20–30 km s−1, smaller than those of ribbon PR.

Figure 9. Apparent slipping motions of fine structures within flare ribbons PR and NR. (a) Time series of SDO/AIA 131 Å images showing the slippage of traced bright knots ("1"–"3") within the ribbon PR. Bright knots "1" and "3" slipped toward the east end of PR and knot "2" slipped in the opposite direction. The blue curve "C–D" shows the cut position used to obtain the stack plot shown in panel (c). (b)–(c) 131 Å stack plots along slices "A–B" and "C–D" showing the bidirectional slippage along ribbons NR and PR.
Download figure:
Standard image High-resolution image4.2. One Special Eruptive Event within an AR of Large Magnetic Flux
A large majority of flares (26 of 28 events) originating from ARs of Mx are confined; however, there are two special eruptive flares among the 28 events. One event is the M4.0 flare on 2014 October 24 and the other is the X1.8 event on 2014 December 20. The X1.8 flare caused a sympathetic eruption of a nearby quiescent filament and generated a CME. Figure 10 displays the appearance of the eruptive M4.0 flare on 2014 October 24. The flare was initiated at 07:37 UT and peaked at 07:48 UT. It was located in the southeast of AR 12192, far away from the main PIL of the AR. The flare was triggered by a blowout jet, as seen in AIA 304 and 131 Å images, and produced a CME at 08:12 UT observed by LASCO/C2. It was suggested that the eruptive flare on the southern border of the AR was close to neighboring open field regions (Thalmann et al. 2015) and thus the jet successfully escaped from the solar surface and formed a CME.


Figure 10. Appearance of the eruptive M4.0-class flare in AR 12192 on 2014 October 24. (a) SDO/HMI LOS magnetogram with contours of the AIA 1600 Å flare brightenings (green contours) overplotted. (b)–(c) AIA 304 and 131 Å images displaying the blowout jet at the southeast edge of AR 12192. (d) LASCO/C2 running-difference image showing the associated CME.
Download figure:
Standard image High-resolution image4.3. One Eruptive Flare within an AR of Small Magnetic Flux
About 92% of events occurring in ARs with smaller than Mx are eruptive. Here, we present an eruptive M3.9 event on 2011 October 2 as an example (Figure 11). The flare originated from AR 11305 (N09°, W12°) with a smaller of ∼. It started at 00:37 UT and reached its peak at 00:50 UT. A high-temperature flux rope erupted toward the southwest in the 131 Å image. The angle of separation between SDO and STEREO B on 2011 October 2 was around 97°. An erupting CME bubble can be observed at the west limb in the STEREO B/EUVI 195 Å image. Starting from about 01:05 UT, an Earth-directed CME was observed by the COR1 coronagraph on board STEREO B.


Figure 11. Overview of the eruptive M3.9 flare on 2011 October 2 in AR 11305. (a) SDO/HMI LOS magnetogram with contours of the AIA 1600 Å flare brightenings (green contours) overplotted. (b) AIA 131 Å image displaying the eruptive flux rope. (c) STEREO B/EUVI 195 Å image showing the generated CME bubble. (d) STEREO B/COR1 image displaying the associated CME.
Download figure:
Standard image High-resolution image4.4. One Eruptive and One Confined Flare within the Same AR of Medium Magnetic Flux
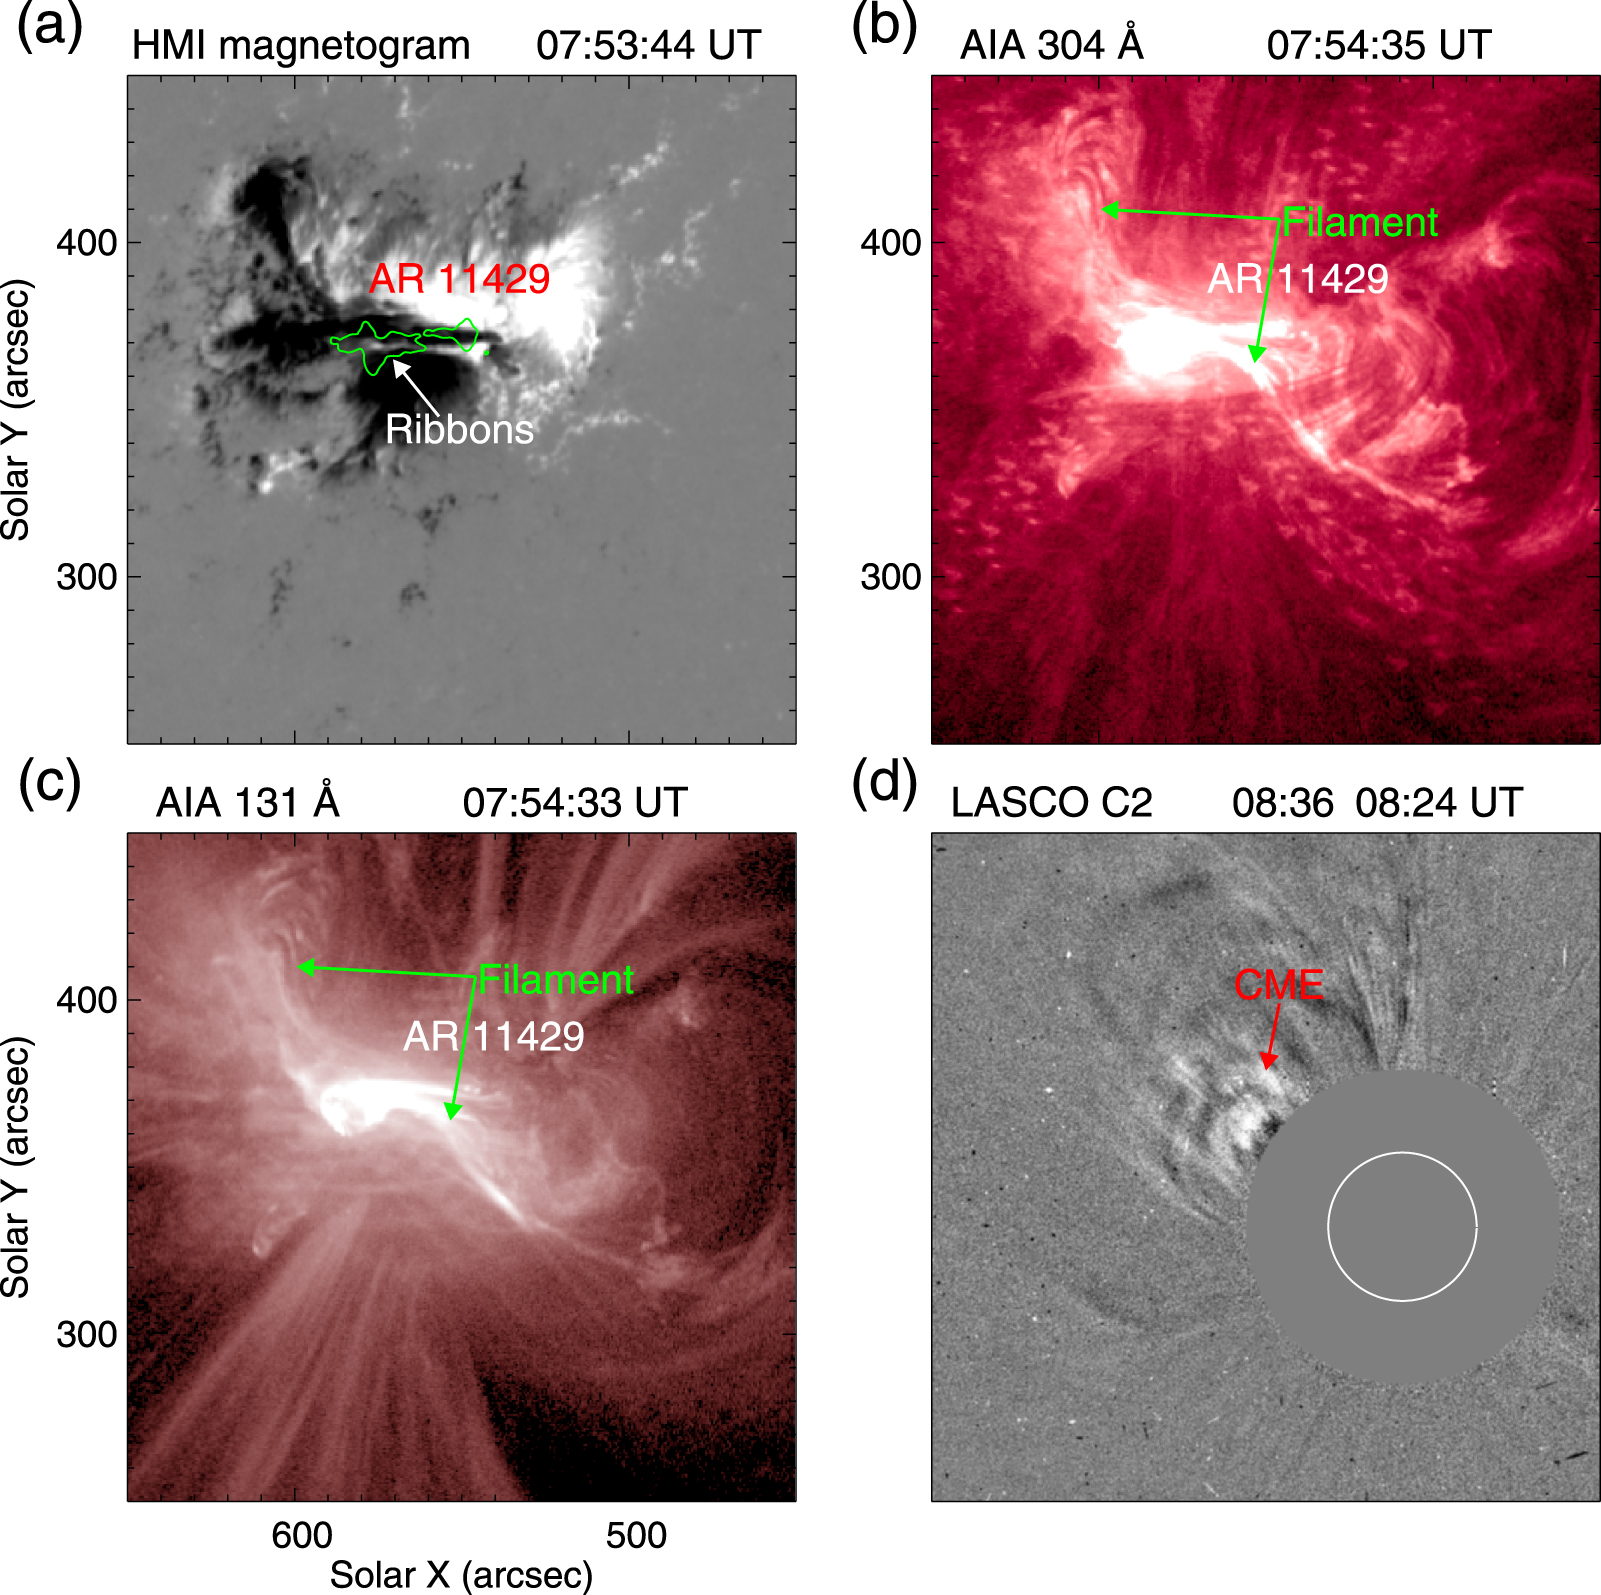
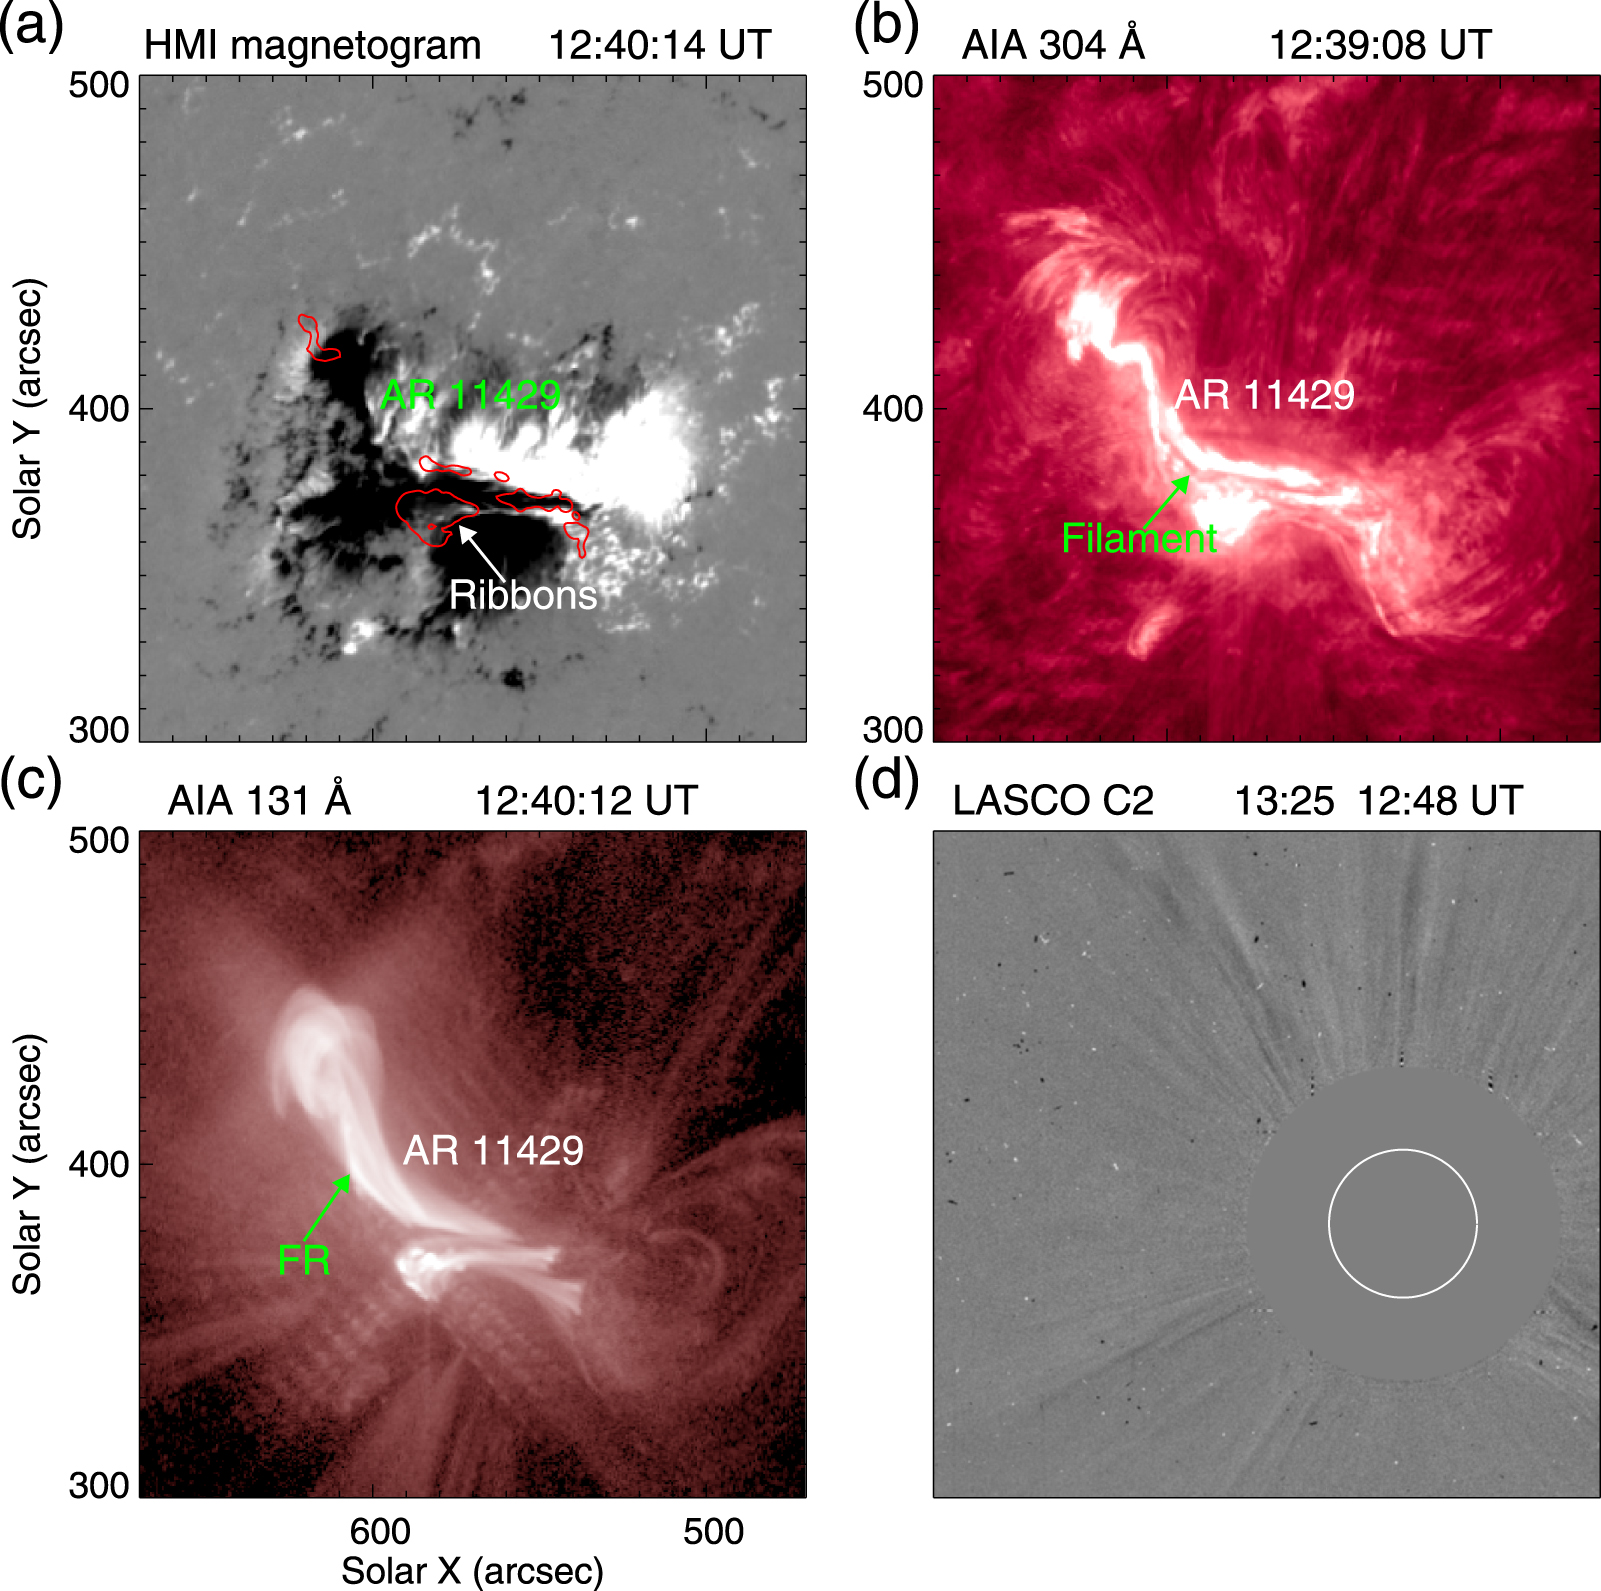
When is between and Mx, almost half of flares are confined. Here, we show two examples from the same AR 11429 on 2012 March 6. At 07:52 UT, an eruptive M1.0-class flare occurred in AR 11429 with of about Mx measured before the flare onset (Figure 12). A reverse-S shaped filament was located along the PIL. During the flare, the middle part of the filament erupted and caused a CME. The AR was emerging persistently and the magnetic flux increased to ∼ Mx at 12:00 UT. Then another confined M2.1-class flare occurred at 12:23 UT and peaked at 12:41 UT (Figure 13). The filament in the AR did not erupt except for the activation at the north part. A flux rope was illuminated and started to rise at 12:26 UT as observed in 131 Å images. The rise lasted for about 10 minutes and ceased at 12:37 UT. Then the flux rope seemed to stay at a certain height and faded away gradually. The eruption of the flux rope failed and did not generate any CME.


Figure 12. Appearance of the eruptive M1.0-class flare in AR 11429 on 2012 March 6. (a) SDO/HMI LOS magnetogram with contours of the AIA 1600 Å flare brightenings (green contours) overplotted. (b)–(c) AIA 304 and 131 Å images displaying the partial-eruptive filament. (d) LASCO/C2 running-difference image showing the associated CME.
Download figure:
Standard image High-resolution image
Figure 13. Appearance of the confined M2.1-class flare in AR 11429 on 2012 March 6. (a) SDO/HMI LOS magnetogram with contours of the AIA 1600 Å flare brightenings (red contours) overplotted. (b) AIA 304 Å image displaying the noneruptive filament along the PIL. (c) AIA 131 Å image showing the failed eruption of the flux rope. (d) LASCO/C2 running-difference image.
Download figure:
Standard image High-resolution image5. Summary and Discussion
In this work, we established an extensive database of eruptive/confined large flares in the SDO era (a total of 322 events including 170 eruptive and 152 confined cases). The morphological properties of flaring ARs and flare ribbons, and their statistical relationships have been investigated. The main results of our study are as follows.
- 1.We find that the total unsigned magnetic flux of ARs plays an important role in governing the eruptive character of flares, and the proportion of eruptive flares exhibits a strong anticorrelation with (rs = −0.97). About 93% flares originating from ARs with an unsigned magnetic flux larger than Mx are confined, i.e., they are not associated with a CME. About 92% events occurring in ARs with smaller than Mx are eruptive.
- 2.We also find a very high positive correlation (rs = 0.86) empirical relation between critical decay index height hcrit and . This implies that ARs with a large magnetic flux have a strong magnetic cage, which confines the eruption. This is the first time that such a fundamental relation between the total AR flux and the confinement properties for large flares is derived.
- 3.We find that the flare ribbon reconnection flux and flare ribbon area are correlated with the peak X-ray flux. There are no significant differences in the fitting parameters when considering confined and eruptive flares separately. These findings are consistent with previous studies (Veronig & Polanec 2015; Kazachenko et al. 2017; Tschernitz et al. 2018), while the obtained correlation coefficients between flare reconnection flux and flare peak X-ray flux FSXR are different, probably due to the different ranges of flare classes in different statistical studies.
- 4.The ratio of AR magnetic flux that is involved in the flare reconnection process ranges between 1% and 41% for eruptive flares and between 1% and 21% for confined events. Similarly, the confined flares have a smaller area ratio RS (1%–18%) than eruptive events (1%–30%).
- 5.By analyzing the dynamic evolution of 26 confined flares occurring in ARs with Mx, we find that these flares have several characteristics in common: stable filament, slipping magnetic reconnection, and strongly sheared PFLs, belonging to "type I" flares as proposed in our previous work (Li et al. 2019).


Our results show that the magnetic flux of ARs is a key parameter in determining the eruptive character of large solar flares, and the proportion of eruptive flares exhibits a strong anticorrelation with . This relation was first found in our work and has never been revealed before. This means that the association rate of flares and CMEs is decreasing with the increasing magnetic flux of ARs. This finding is further supported by the high correlation obtained between and the critical height for torus instability. The ARs seem to be classified into three situations according to their different magnetic properties: strong confinement ( Mx or Mm), moderate confinement (3.0 Mx or Mm), and weak confinement ( Mx or Mm). The values we use to discriminate between classes, and Mx, are arbitrary. In the case of strong confinement, the flare energy and associated magnetic reconfigurations are insufficient to break through the overlying field even if it is an X-class flare (e.g., AR 12192), thus they tend to generate confined flares (Guo et al. 2010; Jing et al. 2018; Sarkar & Srivastava 2018; Duan et al. 2019). On the contrary, if the constraining effect of the background field is small, a small disturbance in the lower corona can result in the generation of a CME, which explains the high proportion of eruptive flares originating from ARs with low magnetic flux. When the confinement of overlying magnetic cage is moderate, almost half of flares are confined (Area B in Figure 1(a); also see two examples in Figures 12–13). This indicates that the overlying confinement and AR nonpotentiality (Falconer et al. 2002; Nindos & Andrews 2004) may jointly determine the class of the flare in the moderate-confinement environment. Previous statistical studies have shown that confined flares are often located much closer to the AR centers where the strapping field is higher, whereas eruptive flares occur at the periphery of an AR (Wang & Zhang 2007; Baumgartner et al. 2018).


Moreover, it is also found that the flux ratio Rflux and area ratio RS for confined flares are significantly smaller than those for eruptive events. This result is similar to the statistical result of Toriumi et al. (2017), who showed the parameter of the ribbon area normalized by the sunspot area determines whether a given flare is eruptive or not. They suggested that the relative structural relation between the flaring region and the entire AR controls the CME productivity.
Our findings reveal a new relation between the magnetic flux of ARs and the occurrence of CMEs in association with large flares. They also have important implications for stellar CMEs and the recently detected "superflares" on solar-type stars (Maehara et al. 2012; Lynch et al. 2019). In order to produce a large flare, the magnetic flux of the source AR has to be large (Aulanier et al. 2013; Shibata et al. 2013; Tschernitz et al. 2018). Historical observational data show that the largest magnetic flux of flaring ARs is up to a few times 1023 Mx (Zhang et al. 2010; Chen et al. 2011; Schrijver et al. 2012). Here, between 1% and 41% of the magnetic flux of the source AR for eruptive flares and between 1% and 21% of for confined events are involved in the flare reconnection process. If we assume that the maximum percentage of 40% of the magnetic flux contained in the AR contributing to the flare reconnection process (Kazachenko et al. 2017; Tschernitz et al. 2018), a total reconnection flux of ∼1.0 Mx can be obtained for an AR with of Mx (the maximum magnetic flux in our sample). According to the relation between the flare ribbon reconnection flux and the peak X-ray flux (Equation (4) and Figure 4), a flare of GOES class ∼X100 could be powered.


Our results are interesting in two aspects. For the solar case, for the strongest space weather effects (which are predominantly due to the CME rather than the flare), we cannot simply extrapolate that the space weather effects will be increasingly stronger for flares produced by large ARs present on the Sun. For the stellar case we may speculate that in cases where much larger ARs (stellar spots) are needed to produce the reported "superflares" on solar-type stars, the flares are probably mostly confined, as they will be associated with a very strong overlying AR strapping field. This may provide an explanation for why the detection of stellar CMEs is rare (Drake et al. 2013; Odert et al. 2017; Argiroffi et al. 2019; Moschou et al. 2019), and implies that the solar-stellar connection between flare rates and CME rates may be fundamentally nonlinear and actually "breaking" when it comes to very large events (Drake et al. 2013; Odert et al. 2017).
The confined flares from ARs with Mx are characterized by slipping reconnection, strong shear, and a stable filament. They belong to "type I" confined flares proposed by Li et al. (2019), who classified confined flares into two types based on their different dynamic properties and magnetic configurations. Similar to the appearance of confined flares in AR 12192 (Li et al. 2019), the filaments in ARs 11339, 11520 (Figures 6–7), 11967, and 12242 (Figures 8–9) were all stably present and seemed not to be involved in flare evolution. The footpoints of high-temperature flare loops exhibited apparent slipping motions in both directions along flare ribbons (Figure 9), which implies the occurrence of slipping magnetic reconnection overlying the noneruptive filaments (Li & Zhang 2015; Dudík et al. 2016; Chen et al. 2019; Lörinčík et al. 2019; Shen et al. 2019). We suggest that the slipping flare loops along the two directions correspond to two different magnetic systems, and the continuous slipping magnetic reconnection between two magnetic systems causes the exchange of their magnetic connectivity and apparent bidirectional slipping motions of reconnecting field lines. Moreover, the PFLs observed in the gradual phase of the flares were strongly sheared, indicating a high nonpotentiality. These observational characteristics of "type I" confined flares are inconsistent with the 2D standard CSHKP flare model (Carmichael 1964; Sturrock 1966; Hirayama 1974; Kopp & Pneuman 1976), which suggests that the reconnection is associated with the filament/flux rope eruption and occurs at a current sheet below the erupting filament. Our observations have revealed several different features. First, the filament/flux rope seemed to be neither disturbed nor erupting during or after the flare. Second, the reconnection site is more likely along the QSLs between two magnetic systems overlying noneruptive filaments. In summary, the signatures of "type I" confined flares in ARs with a large magnetic flux pose a challenge to the 2D classical flare model and prove the need to establish 3D MHD models.

We thank the referee for helpful comments that improved the paper. We thank Xudong Sun for useful discussions. This work is supported by the National Natural Science Foundations of China (11533008, 11773039, 11903050, 11673035, 11790304, 11673034, 11873059, and 11790300), the National Key R&D Program of China (2019YFA0405000), the B-type Strategic Priority Program of the Chinese Academy of Sciences (XDB41000000), Key Programs of the Chinese Academy of Sciences (QYZDJ-SSW-SLH050), Young Elite Scientists Sponsorship Program by CAST (2018QNRC001), the Youth Innovation Promotion Association of CAS (2014043 and 2017078), and NAOC Nebula Talents Program. Lijuan Liu was supported by NSFC (11803096) and the Open Project of the CAS Key Laboratory of Geospace Environment. Astrid M. Veronig acknowledges the support by the Austrian Science Fund (FWF): P27292-N20. SDO is a mission of NASA's Living With a Star Program, STEREO is the third mission in NASA's Solar Terrestrial Probes Program, and SOHO is a mission of international cooperation between ESA and NASA.