


Abstract
We explore the environmental influences on the star formation (SF) in low-mass galaxies with stellar mass 8 ≤ log(M⋆/M⊙) ≤ 10 at a redshift of 0.01 < z < 0.07. We identify the neighboring galaxies for our sample using the spectroscopically observed galaxies in the Sloan Digital Sky Survey (SDSS). Our 287 selected pair candidates have a neighboring galaxy with a stellar mass ratio of MNeighbor/MCandidate ≤ 4 at a projected separation within dproj ≤ 1500 kpc and a line-of-sight kinematic separation of ΔvLOS ≤ 300 km s−1. Our control galaxies are isolated from other galaxies within a projected radius of 1500 kpc. All selected galaxies in our sample are spectroscopically observed by the fourth generation of SDSS/Mapping Nearby Galaxies at Apache Point Observatory (SDSS-IV/MaNGA) integral field spectroscopy survey. We radially bin our selected galaxies into three regions with a radial distance of 0 ≤ R/Re ≤ 0.5 (inner), 0.5 ≤ R/Re ≤ 1.0 (middle), and 1.0 ≤ R/Re ≤ 1.5 (outer), in which Re is the effective radius at where the galaxy emit half of its light. We conclude that the SF activities in low-mass galaxies are affected by their environmental conditions when ΔvLOS ≤ 100 km s−1 at dproj ≤ 400 kpc. We use stellar-mass-weighted SF rate surface density ( ) to describe the SF strength in each radially binned region. For the pair candidates with 0.25 ≤ MNeighbor/MCandidate ≤ 4 at dproj ≤ 100 kpc and
  , we observe an SF enhancement of
  (
( =
= ![$[{({\rm{\Sigma }}\mathrm{SFR}/{M}_{\star })}_{\mathrm{Pair}}-{({\rm{\Sigma }}\mathrm{SFR}/{M}_{\star })}_{\mathrm{Control},\mathrm{mean}}]$](https://content.cld.iop.org/journals/0004-637X/894/1/57/revision1/apjab6deeieqn5.gif) /
/ ) in their inner regions, which decreases with increasing galactic radii.
Export citation and abstract BibTeX RIS
1. Introduction
Variations in the evolution of galaxies are connected with the diverse environments in which they reside. The Lambda cold dark matter (ΛCDM) model suggests that galaxies in larger mass scales are formed through the hierarchical clustering of lower-mass galaxies (White & Rees 1978). Interactions between galaxies are widely believed to be of critical importance to the growth and evolution of galaxies with  in the low-redshift universe at z < 0.1 (e.g., Toomre & Toomre 1972; Sanders et al. 1988; Schweizer 2000; Ellison et al. 2011; Scudder et al. 2012). Observational studies have found that the star formation activities can be enhanced when the host galaxies are close to their neighboring galaxies (e.g., Patton et al. 2013; Barrera-Ballesteros et al. 2015; Behroozi et al. 2015).
To date, few observational studies have investigated how interactions between low-mass galaxies influence their internal properties. Although low-mass galaxies are numerous, they tend to be faint and therefore difficult to observe. For this reason, most of the existing studies focus on either the Magellanic Clouds or other low-mass galaxies within the Local Group (e.g., Tolstoy et al. 2009; D'Onghia & Fox 2016; Simpson et al. 2018), and most of these low-mass galaxies are under the disturbance of gas stripping. The interaction between the Magellanic Clouds, and possibly the Milky Way, has displaced more than 2 × 10⁹ M⊙ of gas from these galaxies (Brüns et al. 2005; Barger et al. 2013; Fox et al. 2014). The low-mass galaxies within the Local Group tend to be gas poor and their star formation is either shutting down or has ceased (e.g., Fillingham et al. 2015, 2016, 2018), indicating that they are being influenced by the massive Milky Way and Andromeda galaxies. The existence of nearby higher-mass galaxies is therefore widely accepted to play a crucial role in quenching star formation in low-mass galaxies. Geha et al. (2012) found that the star formation in low-mass galaxies can still be suppressed even when the distance to its higher-mass neighbor galaxy is up to 1.5 Mpc in the low-redshift universe at z < 0.1.
When low-mass galaxies are not under the influence of a massive galaxy, the interaction between low-mass galaxies (hereafter referred to as the dwarf–dwarf interaction) is suggested to be responsible for the elevation of their star formation activities. The TiNy Titans (TNT) project (Stierwalt et al. 2015, hereafter the SBP15 study) started the first systematic study to explore the star formation activities in dwarf–dwarf interacting systems at the low-redshift universe with 0.005 < z < 0.07. This study applies data from the Data Release 7 of Sloan Digital Sky Survey (SDSS DR7; Abazajian et al. 2009), which uses a single fiber with a diameter of 3'' to spectroscopically observe the brightest knot for galaxies. Those spectroscopically observed galaxies in SDSS have r-band Petrosian magnitude r ≤ 17.77 mag; more details on those selection criteria have been introduced in Strauss et al. (2002). For dwarf–dwarf systems that are not accompanied by massive galaxies ( ) within a projected radius of 1500 kpc, the SBP15 study found that their star formation rate (SFR) is elevated by a factor of 2.3 ± 0.7 when the projected separation is less than 50 kpc.
The SBP15 study and other studies greatly assist us in comprehending the evolution of low-mass galaxies in isolated dwarf–dwarf systems. However, these studies often suffer from a few technical limitations. First, the star formation (SF) activity in low-mass galaxies is often explored using only a small sample of dwarf–dwarf systems. Majority of studies only target on individual galaxy pair using data from H i 21 cm observations (e.g., Martin et al. 2002; Lee-Waddell et al. 2018; Stein et al. 2018) or UV surveys (e.g., Paudel et al. 2015; Sengupta et al. 2015; Sacchi et al. 2018). Second, many of the studies that examine the SF activity with larger galaxy samples tend to use single-fiber spectroscopy toward their brightest spot to characterize its SF activity; some of these studies further use photometry infer the star formation properties of the galaxy that is not spectroscopically sampled (such as the SBP15 study). In those studies, the internal properties of galaxies can only be derived through imaging and simulation, thus their interpretation may be biased by the spectroscopic features in the target region. Privon et al. (2017) observe one merging galaxy selected from the SBP15 study using the first Very Large Telescope/Multi Unit Spectroscopic Explorer optical integral field unit (IFU) survey; they find that the total SFR within the full optical extent of the system is 2.7 times higher than the SFR inferred using SDSS single-fiber data. Moreover, Pan et al. (2019) suggest that the degree of interaction-triggered SFR enhancement can be diluted as the radial coverage of the target region increases when they check the radial profile of the SFR for galaxies with stellar mass  using data from the fourth-generation SDSS (SDSS-IV)/Mapping Nearby Galaxies at Apache Point Observatory (MaNGA) survey. Several studies also point out that the interaction-triggered SFR enhancement peaks at the galactic center but can also be observed in the outskirts of galaxies with
  using data from the MaNGA survey (e.g., Pan et al. 2019; Thorp et al. 2019); however, it is unclear whether this feature can be observed in galaxies with lower stellar mass. Overall, the spatially resolved star formation features in a larger-scaled sample of low-mass galaxies are still uncharted, and the global enhancement on star formation induced by the interaction between low-mass galaxies is expected to be further explored.
The shortcoming of single-spectrum studies can be overcome by the new technological breakthrough of integral field spectroscopy, which can obtain multiple spectra over spatially resolvable objects. Benefiting from this technical advancement, we conduct a study on the spatially resolved star formation activities in low-mass galaxies within the stellar mass range of  at the redshift of 0.01 < z < 0.07. We explore the environmental impacts that dwarf–dwarf galaxy interactions have on their current star formation properties using observations from the SDSS-IV/MaNGA survey. In this work, we intentionally exclude low-mass galaxies that are within a projected distance of 1500 kpc from a massive galaxy, as the star formation in low-mass galaxies can be quenched due to the harassment from a massive neighbor.
This paper is organized as follows. We provide an introduction to the MaNGA survey and its data products in Section 2. We describe the detailed sample selection procedure in Section 3, and we further use the calculation method in Section 4 to determine their SFR and star formation surface density. We explore how the star formation properties of low-mass galaxies are affected in diverse environments using all 386 galaxies included in our sample. The results are described in Section 5 and are further discussed and compared to the SBP15 study in Section 6. Finally, we summarize the conclusions of this work in Section 7. For this work, we adopt a ΛCDM cosmology model with Ωm = 0.3, ΩΛ = 0.7, and H0 = 70 km s−1 Mpc−1 unless otherwise noted.
2. MaNGA Survey and Data Products
The MaNGA survey is one of the core projects in SDSS-IV (Smee et al. 2013; Blanton et al. 2017). The 15th data release (DR15) of SDSS (Aguado et al. 2019) brought the 7th MaNGA Product Launch (MPL-7) to the public, which includes 4621 spectroscopically resolved galaxies. An overview of MaNGA is presented by Bundy et al. (2015).
MaNGA selects galaxies from the NASA-Sloan Atlas (NSA) catalog (Blanton, M. http://nsatlas.org/data), and this selection procedure is described in Wake et al. (2017). MaNGA aims to observe 10,000 galaxies by 2020; these selected galaxies span a redshift range of 0.01 ≤ z ≤ 0.15 and are observed over a wavelength range of 3600 ≤ λ ≤ 10300 Å. The MaNGA galaxies are designed to be representative; they are diverse in galaxy type and are evenly distributed by mass between  . These galaxies are observed with IFUs using the SDSS 2.5 m telescope at Apache Point Observatory (Gunn et al. 2006; Drory et al. 2015; Law et al. 2015; Yan et al. 2016a, 2016b). Galaxies in the primary sample (two-thirds of the targets) and secondary sample (one-third of the targets) of MaNGA are spatially resolved out to a radius of 1.5 Re and 2.5 Re, respectively. Here, we use Re to represent the effective radius at which half of the total light is emitted.
The MaNGA data is reduced by the standard SDSS-IV/MaNGA data reduction pipeline (DRP); a detailed description of the DRP is given by Law et al. (2016). This pipeline subtracts the atmospheric contribution using the collected spectroscopic map of the background sky. The correction for the dust attenuation in the Milky Way is performed, and the calibration of fiber spectra after the dithering exposure is determined from the observed data of standard stars. The DRP eventually organizes the data into three-dimensional (3D) data cubes with spaxel size set to 0.5 × 0.5 arcsec2. The accuracy of the wavelength calibration during this procedure corresponds to a Δvcalibration ≈ 5 km s−1 uncertainty in the velocity, where the median spectral resolution of these observations is Δvresolution ≈ 72 km s−1.
The 3D data cubes are further processed by the SDSS-IV/MaNGA data analysis pipeline (DAP). The overview of the DAP is provided by Westfall et al. (2019). More specifically, the analysis of the emission-line properties in DAP is introduced by Belfiore et al. (2019). The DAP simultaneously fits the stellar continuum and emission lines using the latest version of the penalized pixel-fitting program package (pPXF; Cappellari 2017). A hybrid binning approach is applied in this procedure, where stellar kinematics are derived using the Voronoi binned data and emission lines are modeled using individual spaxels. The flux of emission lines is determined through both numerical integration and a single Gaussian profile. The products from the DAP include two-dimensional (2D) position maps of the stellar kinematics, emission-line properties, and stellar continuum features. Additionally, the associated statistical uncertainties and data quality flags are provided in the DAP. However, it needs to be noted that the Gaussian-fitted gas velocity for each emission line is underestimated in the DAP when the signal-to-noise ratio (S/N) is less than 10. This underestimation is caused by the formal error in pPXF, as the covariance between the fluxes and the gas kinematics is currently ignored. Extra corrections are suggested to rectify this underestimation.
Furthermore, Belfiore et al. (2019) demonstrates that Gaussian-fitted emission-line fluxes are statistically well fit in DAP when  , and elevated uncertainties are found at a higher S/N region due to the limitation of using the single Gaussian profile. However, it is also pointed out that the average S/N for Hα emission is around 29.5 at the radial distance R ≤ 1 Re for MaNGA galaxies. To ensure that there are sufficient data for the later analysis, the numerically integrated flux for each emission line in the DAP product is adopted for this investigation.
3. Sample Selection
We select low-mass galaxies with stellar mass 8 ≤ log(M⋆/M⊙) ≤ 10 and redshift 0.01 < z < 0.07 from the MPL-7 (Figure 1), which is publicly available in the SDSS-IV DR15. The position (R.A., decl., and redshift z) and stellar mass for our galaxy sample are extracted from the NSA galaxy catalog (Blanton, M. http://nsatlas.org/data) catalog, where the stellar mass of galaxy is calculated by applying a K-correction software package (Blanton & Roweis 2007, 2017) with the Hubble constant of H0 = 100 km s−1 Mpc−1. Because our investigation adopts a different the Hubble constant of H0 = 70 km s−1 Mpc−1, we apply an h-scale factor to achieve consistency in stellar mass for each selected galaxy (Croton 2013).
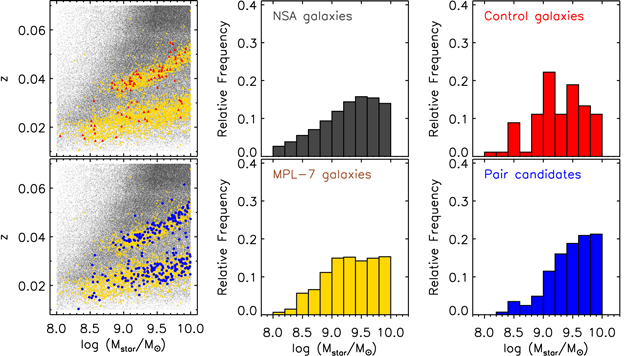
Figure 1. Redshift and stellar mass in logarithm for galaxies with  in the NSA catalog (black), MPL-7 (yellow), our "Control" category (red), and our "Pair" category (blue). Our control galaxies and pair candidates are selected from the MPL-7; all MaNGA galaxies are selected from the NSA galaxy catalog. For the scatter plots in the first column on the left, the upper and lower concentrations for MPL-7 galaxies represent the secondary and the primary sample, respectively.
Download figure:
Standard image High-resolution imageWe identify the neighboring galaxies for our selected sample using the NSA galaxy catalog, which includes all galaxies with  that have been spectroscopically observed in SDSS DR13 at redshift z < 0.15. To categorize the environmental conditions for our sample, we use the projected separation (dproj) and the difference in line-of-sight velocity (ΔvLOS) to describe the physical and line-of-sight kinematic separations. We further determine the relative stellar mass scale of the neighboring galaxies using the stellar mass ratio MNeighbor/MMaNGA for each MaNGA target galaxy. We call a neighboring galaxy a "minor" neighbor if MNeighbor/MMaNGA ≤ 4; otherwise we call it a "major" neighbor. This scheme is inspired by the commonly accepted definition of galaxy major and minor mergers (e.g., Rodriguez-Gomez et al. 2015), in which the merger events are classified using the stellar mass ratio of the two involved galaxy components. The nearest major neighbor for each of our selected galaxy is required to be at a projected separation of at least 1500 kpc so that all our selected low-mass galaxy systems are isolated from their neighboring higher-mass galaxies and their star formation activities will not be affected by the disturbance of gas stripping.
Our pair candidates are selected to include low-mass galaxies that are in various stages of dwarf–dwarf interaction; their nearest neighbors (hereafter the first neighbor) are minor neighbors with dproj ≤ 1500 kpc and ΔvLOS ≤ 300 km s−1. To further rule out the influence on star formation from other minor neighbors, all other minor neighbors are required to be at least 150 kpc away from both components in the selected dwarf–dwarf galaxy system. For target galaxies that are not found to have any neighbors in the NSA catalog within the projected radius of 1500 kpc, they are extremely isolated and will be classified under the "Control" category.
After excluding galaxies with bad quality on the MaNGA DRP and DAP product from our sample, we radially bin their 2D nebular emission-line maps so that we can further compare their properties in the inner (0 ≤ R/Re ≤ 0.5), middle (0.5 ≤ R/Re ≤ 1.0), and outer (1.0 ≤ R/Re ≤ 1.5) regions. Although a subset of the MaNGA galaxies was observed out to a radius of R ≈ 2.5 Re, most only have spatially resolved spectra out to R ≈ 1.5 Re. To keep the consistency, we thus set a cutoff threshold of the radial distance R = 1.5 Re for this investigation. For each selected target galaxy, at least half of their spaxels in the data cube need to be "valid" spaxels within each of these three radially binned regions. In this work, a spaxel with S/N ≥ 3 and Hα emission equivalent width EW ≥ 1 Å is considered to possess valid data and is referred to as a "valid" spaxel. The fraction with the number of valid spaxels as the numerator and all spaxels as the denominator for all radially binned regions are presented in Table 1. It should be noted that our sample only include galaxies with the semiminor axis (b) to semimajor axis (a) ratio b/a ≥ 0.3. We exclude galaxies with an extremely thin body (e.g., edge-on galaxies) so that we can compare how the star formation varies at different radii from the galactic center for our selected galaxies.
Table 1. Information for Galaxies in Our Sample
| Star Formation Surface Densityd | Fraction of Valid Spaxelsf | ||||||||||||||
|---|---|---|---|---|---|---|---|---|---|---|---|---|---|---|---|
| PlateIFU | MaNGA-ID | Category | Rea | b/aa |
 b
b
|
 c
c
|
 c
c
|
 c
c
|

|

|

|
 e
e
|

|

|

|
| (arcsec) | (kpc) | (km s−1) | ( ) ) |
( ) ) |
|||||||||||
| 8338-6101 | 1-574691 | Pair | 5.78 | 0.56 | 9.78 | 16 | 181 | 0.11 | 0.0482 | 0.0134 | 0.0026 | 0.3183 | 59/59 | 178/178 | 284/284 |
| 8329-6104 | 1-592743 | Pair | 6.63 | 0.86 | 9.72 | 16 | 31 | 0.97 | 0.0178 | 0.0123 | 0.0062 | 0.1362 | 117/117 | 358/358 | 592/595 |
| 9510-12701 | 1-584931 | Pair | 11.87 | 0.77 | 9.50 | 21 | 149 | 0.03 | 0.0012 | 0.0009 | 0.0006 | 0.0081 | 339/338 | 1026/1026 | 1106/1700 |
| 8941-6101 | 1-604928 | Pair | 3.41 | 0.52 | 9.54 | 25 | 57 | 0.39 | 0.0379 | 0.0249 | 0.0094 | −999.0000 | 17/17 | 58/58 | 102/102 |
| 8085-12701 | 1-38368 | Pair | 10.94 | 0.57 | 9.54 | 29 | 256 | 0.33 | 0.0066 | 0.0060 | 0.0022 | 0.0520 | 219/219 | 648/648 | 904/1082 |
| 9493-9101 | 1-384936 | Pair | 4.34 | 0.73 | 9.17 | 35 | 31 | 0.30 | 0.0100 | 0.0018 | 0.0005 | 0.0614 | 44/44 | 118/131 | 173/216 |
| 8318-1901 | 1-284321 | Pair | 2.87 | 0.60 | 9.57 | 36 | 55 | 0.54 | 0.0010 | 0.0005 | 0.0002 | 0.0046 | 15/15 | 46/46 | 68/74 |
| 8261-6102 | 1-258315 | Pair | 5.55 | 0.86 | 9.64 | 42 | 121 | 0.04 | 0.0042 | 0.0031 | 0.0011 | 0.0231 | 83/83 | 250/250 | 422/422 |
| 8331-3704 | 1-251043 | Pair | 5.59 | 0.44 | 9.73 | 44 | 129 | 0.02 | 0.0016 | 0.0013 | 0.0006 | 0.0085 | 46/46 | 122/128 | 160/217 |
| 7968-3704 | 1-635629 | Pair | 4.22 | 0.48 | 9.23 | 44 | 73 | 0.65 | 0.0203 | 0.0135 | 0.0056 | 0.0580 | 28/28 | 80/80 | 133/133 |
Notes.
aThe effective radius (Re) and the semiminor to semimajor axis ratio (b/a) derived from the elliptical Petrosian analysis in the MaNGA DAP. bThe stellar mass in logarithm derived from the K-correction fit in the NSA catalog (Blanton, M.; http://nsatlas.org/data). cProjected separation (dproj), line-of-sight kinematic separation ( ), and stellar mass ratio
  (
( ) to the first neighbor.
dThe star formation surface density within the inner, middle, and outer regions are represented by "
) to the first neighbor.
dThe star formation surface density within the inner, middle, and outer regions are represented by " ," "
," " ," and "
 ," respectively.
eThe star formation rate within the 3'' SDSS single fiber is represented by "
," respectively.
eThe star formation rate within the 3'' SDSS single fiber is represented by " ." The
  is derived from the product of
  and the area of the 3'' fiber (see Section 6.1.2). It needs to be noted that six galaxies (PlateIFU = 8941-6101, 7991-12701, 9883-3701, 9024-6102, 7443-6102, and 9891-1901) in our sample are not observed by the SDSS single-fiber survey; their
  within the fiber thus are not able to be recovered using the MaNGA IFU data. For these six galaxies, their
  are given by "−999.0000." in this table. These six galaxies are also excluded in the discussion of star formation activity within the fiber coverage in Section 6.1.2.
fThe number fraction of valid spaxels within the inner region, middle region and outer region is represented by
are given by "−999.0000." in this table. These six galaxies are also excluded in the discussion of star formation activity within the fiber coverage in Section 6.1.2.
fThe number fraction of valid spaxels within the inner region, middle region and outer region is represented by  ,
,  , and
, and  , respectively. In the fraction value for each region, the number in front of the slash sign presents the number of valid spaxels, while the number of all observed spaxels is presented by the number after the slash sign.
Only a portion of this table is shown here to demonstrate its form and content. A machine-readable version of the full table is available.
Download table as: DataTypeset image
The calculation method for star formation properties is elaborated in Section 4, in which the nonvalid spaxels are masked out. The dominant ionization mechanism throughout the IFU sight is examined for each selected target galaxy using the [N ii] Baldwin–Phillips–Terlevich (BPT; Baldwin et al. 1981) diagnostic map with classification lines in Kewley et al. (2001) and Kauffmann et al. (2003a), in which EW ≥ 1 Å are required for each involved emission line. To simplify the ionization condition and the star formation behavior, target galaxies with spaxels dominantly ionized by active galactic nuclei (AGNs) are excluded in this investigation. After calculating the star formation properties, one pair candidate with dproj ≈ 1000 kpc and two control galaxies are found to possess star formation activities that are more than 10 times stronger than the average level of control galaxies within our entire radial coverage. These three galaxies are moved from their original category to the "Robust" category (hereafter referred to as the "RB" category), and their extreme star formation behavior will be discussed separately in Section 6.2.
A general visual check is further conducted using the SDSS SkyServer and the MaNGA Marvin interface (Cherinka et al. 2019) on those selected MaNGA galaxies, as the NSA catalog does not include galaxies that have not been spectroscopically observed using the 3'' single fiber. After the visual check, three galaxies in the "Control" category and one galaxy in the "Pair" category are suspected to possess an extra neighboring galaxy with dproj ≤ 30 kpc. Information on the redshift and stellar mass of those recovered neighbors are missing due to the lack of spectroscopy data, so that their line-of-sight kinematic separation ΔvLOS and stellar mass ratio to the associated target galaxies remain vague. We exclude those four galaxies from their original category and classify them under the "Recovered" category (the "RC" category).
Two pair candidates have been observed twice by MaNGA; their MaNGA IDs are 1-235530 and 1-178443. For these repeatedly observed galaxies, their latest observations will be kept in the "Pair" category for the later analysis and discussions, and the older version of their observations will be moved to the "Repeated" category (the "RP" category). All of those repeated observations will be used to provide a supplemental exploration of the uncertainties in our calculation about the star formation properties in galaxies.
The 386 target galaxies in our sample consist of 90 control galaxies, 287 pair candidates, 3 "Robust" galaxies, 4 Recovered pairs, and 2 with repeat observations in the "RP" category. Two of the pair candidates (PlateIFU = 9045-3702 and 9045-12702) belong to the same galaxy pair with dproj ≈ 1300 kpc and ΔvLOS = 19 km s−1. In this system, the galaxy with identifier PlateIFU = 9045-12702 is 3.23× more massive than the galaxy with identifier PlateIFU = 9045-3702. We designate both of these two galaxies to the "Pair" category, and we explore how these respective galaxies affect their companion separately. The information for those galaxies can be found in the complete machine-readable table, a portion of which is shown in Table 1. Figure 1 displays the distribution of redshift and stellar mass for our control galaxies and pair candidates. Those control galaxies in our sample have a median stellar mass of  at a median redshift of z = 0.038; our pair candidates have a median stellar mass of
  at a median redshift of z = 0.030. These pair candidates have a median line-of-sight kinematic separation of ΔvLOS = 80 km s−1. The stellar mass ratio for galaxies in the "Pair" category spans a 0.004 ≤ MNeighbor/MCandidate ≤ 4 range with a median value of (MNeighbor/MCandidate)median = 0.4 (see Figure 2).

Figure 2. Environmental condition (projected separation  , line-of-sight kinematic separation
  , and stellar mass ratio
  ) for pair candidates.
Download figure:
Standard image High-resolution image4. Calculation Method
4.1. Dust Extinction
The dust attenuation is corrected for all explored nebular emission lines using the reddening law in Calzetti et al. (2000). We determine the color excess  by comparing the observed Balmer decrement, Hα and Hβ flux ratio
  , with the intrinsic decrement value
  for case B recombination. Because those galaxies in our sample are compatible to the Large Magellanic Cloud (LMC) on the stellar mass scale, our calculation adopts the LMC extinction factor of RV = 3.41 ± 0.06 and RV = 2.76 ± 0.09 for general regions and starburst regions, respectively (Gordon et al. 2003). Inspired by the definition of starburst in the SBP15 study, starburst regions in our galaxies consist of spaxels with Hα EW > 100 Å.
Because the Hβ emission is intrinsically fainter than the Hα emission, some spaxels have detectable Hα emission but do not have detectable Hβ emission. The Balmer decrement is thus unable to be measured in Hβ-missing spaxels. We assume that the E(B − V) for Hβ-missing spaxels in the inner, middle, and outer regions can be roughly approximated to be the median E(B − V) in the respective region. The 3σ outliers (σ represents the standard deviation) of E(B − V) in each radially binned region are also smoothed out during this procedure.
4.2. SFR and Surface Density
The SFR describes the total mass of stars formed per unit time. There are several indicators of the current SFR, which has been thoroughly reviewed in Kennicutt (1998). Strong recombination emission lines (especially Hα) are widely adopted to describe current star formation activity in galaxies, because they are good tracers of ionization imprints that massive stars leave on their surrounding gas. In this study, we apply the intrinsic Hα energy flux Fi(λHα) to calculate the current SFR using the luminosity–SFR relation in Kennicutt (1998),
where ν2 is the  –SFR calibrator. The Hα luminosity is calculated from
  , where d is the distance to the host galaxy using redshift and Hubble's law. The redshift (zHα) adopted in the calculation of d is extracted from the MaNGA DAP product, which is the flux-weighted mean redshift of the Hα emission line within an angular radius of 1
 25 at the galactic center. Accordingly, the uncertainty for Gaussian-fitted Hα emission-line velocity within the same angular radius is extracted from the DAP product. More specifically, the included valid spaxels within this region are also required to have
  , so that the velocity uncertainty is underestimated in this data product. The MaNGA wavelength calibration (Δvcalibration ≈ 5 km s−1; Law et al. 2016) is also considered when we estimate the uncertainty for zHα. Eventually, the median fractional uncertainty of zHα is around 0.05%.
The original LHα–SFR calibrator in Kennicutt (1998) is estimated using solar metallicity (Z⊙) and a Salpeter initial mass function (IMF) over the mass range of 0.1 ≤ M/M⊙ ≤ 100. However, it has been pointed out by Weilbacher & Fritze-v. Alvensleben (2001) that the SFR in dwarf galaxies is overestimated when using the calibrator in Kennicutt (1998), as higher metallicity can be translated into higher SFR and dwarf galaxies generally have a subsolar metallicity. To explore the calibrator for galaxies that do not have solar metallicity, Weilbacher & Fritze-v. Alvensleben (2001) conducted a series of simulations over the metallicity range 0.001 ≤ Z ≤ 0.04 (1/20 ≲ Z/Z⊙ ≲ 2), and a Salpeter IMF is adopted over two mass ranges (0.15 ≤ M/M⊙ ≤ 85 and 0.15 ≤ M/M⊙ ≤ 120). In this work, we presume a calibrator of Z = 0.4 Z⊙ of  . This adopted calibrator represents the average value of the simulated calibrators over 0.15 ≤ M/M⊙ ≤ 85 and 0.15 ≤ M/M⊙ ≤ 120, and the half-difference between these two simulated calibrators is used to describe the uncertainty of our adopted calibrator. This selection is made because our galaxies and the LMC have similar stellar masses (
 in van der Marel et al. 2009), and the LMC has a metallicity of ZLMC ≈ 0.008 (Glatt et al. 2010).
The uncertainty of Hα-based SFR has five sources: Hα redshift  , the emission-line flux of Hα and Hβ before the dust extinction
  and
and  , the extinction factor RV, and the LHα–SFR calibrator ν2. Overall, our selected galaxies possess a fractional SFR uncertainty of 12.4% for each spaxel. This uncertainty is mainly contributed by the uncertainty of the extinction factor and LHα–SFR calibrator, as the median fractional uncertainties for
  and
and  in the MaNGA DAP product are only in the scale of 1.4% and 6.8% for each spaxel.
The 2D SFR map for all selected galaxies are displayed in Figure 16; the three radially binned regions are separated by the ellipses with different radii in terms of Re. The total SFR (SFRtotal) for each radially binned region can be obtained simply by adding up the calculated SFR for each valid spaxel within the respective region; the number of valid spaxels for each radially binned region is displayed in Table 1. It needs to be pointed out, however, that the calculated total SFR above are area dependent because the radially binned region with larger radial distance contains more spaxels. The area-weighted SFR for each galaxy, also known as the star formation surface density (ΣSFR), is subsequently determined for each radially binned region (Figure 3) using the relation  , where Nspaxel is the number of spaxels within this region, and Aspaxel = 0.5 × 0.5 arcsec2 is the angular area for each spaxel in MaNGA. The summation for the SFRtotal considerably reduces the uncertainty of SFRtotal. The fractional uncertainty of Hα-based ΣSFR in the inner, middle, and outer regions for each selected galaxy is typically on the scale of 1.8%, 1.1%, and 1.0%, respectively. Furthermore, the repeated observations in our sample exhibit an average ΣSFR percentage difference of 8.3%, 5.5%, and 5.7% for the inner, middle and outer regions, respectively.

Figure 3. Star formation surface density of control galaxies (top row) and pair candidates (the bottom three rows) within the inner (left column), middle (middle column), and outer (right column) radially binned regions as a function of stellar mass. The gray triangular symbols in the top row represent the 3σ outliers on star formation strength in control galaxies for each radially binned region. Pair candidates with stellar mass ratio of  ,
,  , and
, and  are represented by stars, squares, and circles in the last three rows, respectively. The ΣSFR is in units of
  .
.
Download figure:
Standard image High-resolution image5. Results
5.1. Environmental Impact on the Star Formation Strength in Low-mass Galaxies
There is a tight proportional correlation between SFR and stellar mass for galaxies within any given stellar mass range, which is well known as the SF main sequence (e.g., Noeske et al. 2007; Wang et al. 2019). In this investigation, we adopt the stellar-mass-weighted ΣSFR (ΣSFR/M⋆) to represent the SF strength, so that the impact of the stellar mass can be removed.
Figure 3 presents the distribution of ΣSFR and stellar mass for our control galaxies and pair candidates. The ΣSFR and stellar mass of control galaxies are adopted to estimate the average level of SF strength for each radial binned region. The average control level for each radially binned region is represented by the average value and the associated standard deviation of the mean (also known as the standard error) for SF properties in control galaxies after removing the 3σ outliers (σ represents the standard deviation). We found that the average SF strength of our control galaxies is  , −11.36 ± 0.06, and −11.70 ± 0.05 in their inner, middle and outer regions, respectively (see Figure 4). The unit of ΣSFR/M⋆ is
  . We use these average control levels to compare the SF activity of our pair candidates.
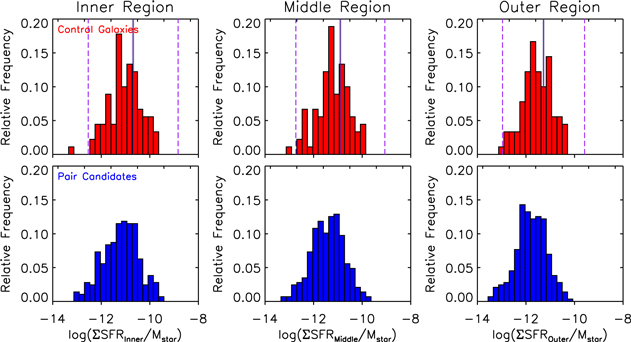
Figure 4. Distribution of star formation strength within the inner (left column), middle (middle column), and outer (right column) radially binned regions for control galaxies (top row) and pair candidates (bottom row). The unit of  is
is  . In the top three panels, galaxies outside of the region between the two dashed lines are those 3σ outliers in the top row of Figure 3; those galaxies are excluded when we estimate the average level of SF strength for control galaxies. The solid lines and the associated envelopes in the top three panels represent the calculated average value and standard error of SF strength within each radially binned region for control galaxies.
Download figure:
Standard image High-resolution imageOur pair candidates probe different potential environmental influences on their star formation, including the projected separation (dproj), line-of-sight kinematic separation (ΔvLOS), and stellar mass ratio (MNeighbor/MCandidate) between the MaNGA target galaxies and their associated nearest neighbor. We divided our pair candidates into different bins according to their environmental conditions and illustrate their ΣSFR as a function of stellar mass in each environmental bin in Figure 3. Pair candidates with a stellar mass ratio of 0.25 ≤ MNeighbor/MCandidate ≤ 4 are accompanied by neighboring galaxies with a comparable stellar mass; pair candidates with a stellar mass ratio of 0.1 ≤ MNeighbor/MCandidate < 0.25 correspond to the more massive galaxy in each associated galaxy pair. And the pair candidates with a stellar mass ratio of MNeighbor/MCandidate < 0.1 are accompanied by extremely small neighboring galaxies. We separated the pair candidates into three evenly spaced ΔvLOS groups so that we could estimate its influence on the SF activity of our galaxy sample. These ΔvLOS groups include 0 ≤ ΔvLOS ≤ 100 km s−1, 100 ≤ ΔvLOS ≤ 200 km s−1, and 200 ≤ ΔvLOS ≤ 300 km s−1. We binned the SF strength for each of these ΔvLOS groups in ascending order of dproj, which is included in Figure 5.
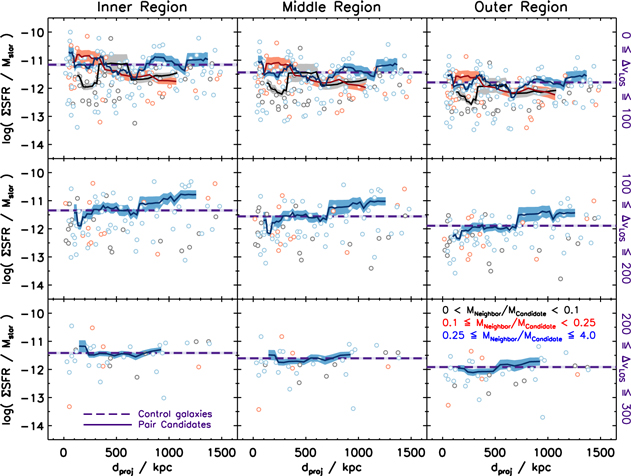
Figure 5. SF strength along with the ascending order of projected separation for pair candidates in different environmental bins. The  for different radially binned regions are displayed in different columns and different
  ranges are plotted in different rows. We color code each individual pair candidate (circles) by their stellar mass ratio
  . The SF strength trends (solid line and the associated shadow) for pair candidates in each bin are presented by the moving average of
  ; each of these average values (solid line) and the associated standard errors (shadow) are calculated from the respective subset that consists of 10 adjacent galaxies along with the ascending order of
  . For pair candidates with
  , the moving-average values are only estimated for galaxies with a stellar mass ratio of 0.25 ≤ MNeighbor/MCandidate ≤ 4.0 because there are not enough galaxies in other mass ratio bins. The average control level in logarithm for each radially binned region is represented by the average
  (dashed line) and the associated standard error (rectangular shadow) of control galaxies.
Download figure:
Standard image High-resolution imageFor pair candidates with ΔvLOS > 100 km s−1 in Figure 5, we were only able to explore the SF trends for pair candidates with stellar mass ratio 0.25 ≤ MNeighbor/MCandidate ≤ 4.0 because there were too few galaxies in the other stellar mass ratio bins. Throughout all three radially binned regions, the pair candidates with stellar mass ratio 0.25 ≤ MNeighbor/MCandidate ≤ 4.0 and 200 ≤ ΔvLOS ≤ 300 km s−1 have a relatively flat SF trend that is well matched to the control level; this implies that the SF activities in these galaxies are no longer affected by their companions when ΔvLOS > 200 km s−1.
For galaxies with an intermediate line-of-sight kinematic separation (100 ≤ ΔvLOS ≤ 200 km s−1) in Figure 5, the estimated SF trend for galaxies with a stellar mass ratio of 0.25 ≤ MNeighbor/MCandidate ≤ 4.0 matches with the control level at 300 ≤ dproj ≤ 700 kpc; however, there is an increase in star formation in all three radially binned regions at 850 ≤ dproj ≤ 1250 kpc because of five galaxies with extremely strong SF. We also find that the SF strength drops at 100 ≤ dproj ≤ 200 kpc for those galaxies with a stellar mass ratio of 0.25 ≤ MNeighbor/MCandidate ≤ 4.0. No evidences suggest that the SF becomes elevated at small projected separations.
We find that pair candidates with ΔvLOS ≥ 100 km s−1 generally have weaker SF compared to the average control level, which is illustrated in Figure 5 where the circular symbols represent the estimated ΣSFR/M⋆ for our pair candidates. Overall, we do not observe SF enhancement for dwarf–dwarf systems with ΔvLOS ≥ 100 km s−1 at small projected separation in Figure 5.
We explore the global SF trends for pair candidates with ΔvLOS ≤ 100 km s−1 in all three stellar mass ratio bins as a function of projected separation. Galaxies with a stellar mass ratio of 0.1 ≤ MNeighbor/MCandidate < 0.25 generally show a decreasing SF trend throughout the entire dproj range, and their SF strength is greater than the control level only when dproj ≤ 400 kpc (see Figure 5). We find that the SF activity for galaxies with a stellar mass ratio of 0 < MNeighbor/MCandidate < 0.1 is lower than the average control level in Figure 5, especially when dproj ≤ 400 kpc. For those galaxies in the 0.25 ≤ MNeighbor/MCandidate ≤ 4.0 stellar mass ratio bin, we observe an enhancement in their SF strength when dproj ≤ 100 kpc (see Figure 5).
Furthermore, we use the fractional change in star formation strength ( ) to describe how the SF activity in these pair candidates varies compared to the average control level (Figure 6). The fΔSF in Figure 6 is calculated from
where (ΣSFR/M⋆)Pair is the average SF strength calculated using the moving-average method for our pair candidates and (ΣSFR/M⋆)Control,mean is the average SF strength of our control galaxies. A positive fΔSF at a small projected separation suggests that the star formation activities in this pair candidates are stronger than the average control level, thus we can use the maximum fΔSF within this dproj region to represent the scale of enhancement on SF strength. Similarly, the minimum fΔSF can be adopted to describe the scale of suppression on SF strength if a galaxy in a close pair possesses a negative fΔSF.
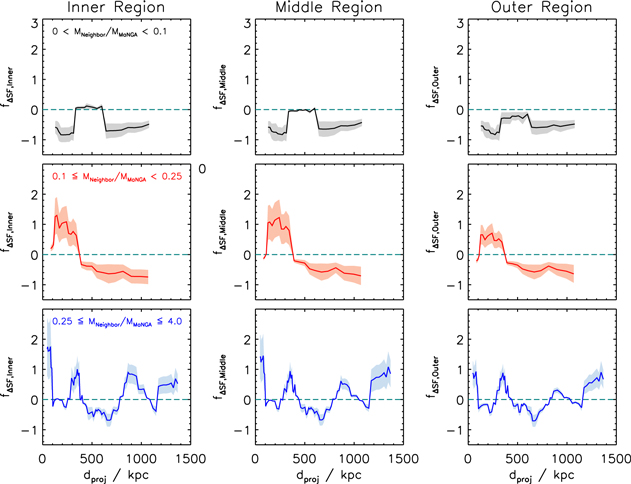
Figure 6. Fractional change in star formation strength along with the ascending order of projected separation for each radially binned region in pair candidates with ΔvLOS ≤ 100 km s−1. The interaction-triggered enhancement on SF strength is observed when pair candidates present an fΔSF > 0 at small dproj. The standard errors of each derived fΔSF for each environmental bin are presented by the associated envelopes, which are derived using the standard error of the average control level and the standard error of each moving-average value in the SF strength trend for pair candidates.
Download figure:
Standard image High-resolution imageThe SF activity in pair candidates with a stellar mass ratio of 0 < MNeighbor/MCandidate < 0.1 and ΔvLOS ≤ 100 km s−1 is suppressed throughout the entire projected separation range explored in this study (dproj ≤ 1500 kpc) in all three radially binned regions (see Figure 6 and Table 2). For pair candidates with a stellar mass ratio of 0 < MNeighbor/MCandidate ≥ 0.1, we observe an elevated SF strength that peaks in the inner region and diminishes with increasing galactic radii when ΔvLOS ≤ 100 km s−1 (see Table 3 and Figure 6).
Table 2.
The Scale of Suppression on SF Strength for Pair Candidates with  and a Stellar Mass Ratio of

|
||||
|---|---|---|---|---|
| Projected Separation | Stellar Mass Ratio | Inner Region | Middle Region | Outer Region |

|
|
−0.84 ± 0.24 | −0.83 ± 0.23 | −0.83 ± 0.16 |
Download table as: ASCIITypeset image
Table 3.
The Scale of Enhancement on SF Strength for Pair Candidates with  and a Stellar Mass Ratio of

|
||||
|---|---|---|---|---|
| Projected Separation | Stellar Mass Ratio | Inner Region | Middle Region | Outer Region |
| dproj ≤ 400 kpc | 0.1 ≤ MNeighbor/MCandidate < 0.25 | 1.30 ± 0.61 | 1.23 ± 0.60 | 0.71 ± 0.34 |
| dproj ≤ 100 kpc | 0.25 ≤ MNeighbor/MCandidate ≤ 4 | 1.75 ± 0.96 | 1.45 ± 0.73 | 0.93 ± 0.41 |
Download table as: ASCIITypeset image
The SF strength and the fractional change in SF strength trends with increasing projected separation in Figures 5 and 6 distinctly indicate that the SF activities in dwarf–dwarf system are under the impact of stellar mass ratio when ΔvLOS ≤ 100 km s−1. The observed weak SF activity in pair candidates with a stellar mass ratio of MNeighbor/MCandidate < 0.1 and ΔvLOS ≤ 100 km s−1 at dproj ≤ 400 kpc suggests that the SF strength in low-mass galaxies can be significantly reduced when their associated nearest neighbor is over 10 times smaller in mass scale, which could be caused by the fact that these small neighboring galaxies do not have enough gas storage to fuel the SF for their higher-mass companion. This assumption is further supported by the observed feature that galaxies with a higher stellar mass ratio tend to possess higher SF strength at dproj ≤ 400 kpc. The greater SF strength for galaxies with a stellar mass ratio of 0.1 ≤ MNeighbor/MCandidate < 0.25 is also consistent with the fact that the SF in galaxies with larger mass scales can be elevated in a minor merger event (e.g., Weistrop et al. 2012; Kaviraj 2014).
Galaxies with 0.25 ≤ MNeighbor/MCandidate ≤ 4.0 and 0 ≤ ΔvLOS ≤ 100 km s−1 also show a greater dispersion on SF strength as the projected separation decreases. This large dispersion is also reflected by the large uncertainties on their fraction of SF strength at dproj ≤ 100 kpc throughout all the three radially binned regions in Figure 6. Those features suggest that galaxies under that environmental condition present strong diversity in their SF activity, which matches the well-accepted opinion that the SF activities in these galaxies are generally vicious and ceases shortly after their gas is drained during the interaction (e.g., Geach et al. 2018). The observed feature also implies that the interaction between low-mass galaxies is also responsible for the quenching of star formation in a dwarf–dwarf system. However, another possibility is that some of these galaxies may only be "projected pairs" that are not actually physically interacting. Jian et al. (2012) points out that about 36% of their simulated galaxy pairs that consist of galaxies with a B-band magnitude of −21 ≤ MB ≤ −19 mag fail to interact in the end, even though they match all their selection criteria for close pairs (dproj ≤ 50h−1 and 0 ≤ ΔvLOS ≤ 500 km s−1). This so-called "close-pair contamination" is suggested to result from the projection effect, where the high relative 3D velocities between the galaxy pairs are responsible for the failure of interaction in those contaminated pairs. Our pair candidates may also be "contaminated" in that way, which can be responsible for the weak SF activities observed in some close dwarf–dwarf galaxy systems.
Moreover, we observe that both the control galaxies and pair candidates in our sample tend to be predominantly central star forming with a decreasing ΣSFR/M⋆ at larger galactic radii. On average, the SF strength in the inner region is 1.6 times stronger than the middle region and is 3.5 times stronger than the outer region.
5.2. Environmental Impact on the Neutral Gas Fraction in Low-mass Galaxies
Diemer et al. (2019) found that the star formation activity within galaxies is tightly correlated with their H i mass ( ). Diemer et al. (2019) also found that galaxies with higher stellar mass tended to have lower neutral gas fraction (fgas), where
  . To explore the connection between the H i gas content and star formation in our galaxy sample, we further examine the neutral gas fraction for our sample.
The H i-MaNGA program is an H i 21 cm radio survey that is in the process of observing the MaNGA galaxies using the Green Bank Telescope (Masters et al. 2019). Their released data provide detected H i mass for around one-third of our selected galaxies and estimation of upper limits for around one-fifth of our galaxies (Figure 7). In their program, they observe MaNGA galaxies using the L band (1.15–1.73 GHz); the beam has an FWHM of 8 8 at these frequencies. Because of the relatively large beam size of their H i observations in comparison to the angular size and separation of our pair candidates, some of our close pairs are both enclosed within their beam. When this occurs, we derive their neutral gas fraction using the total stellar mass of these close pairs (right panel in Figure 7). Otherwise, we derive the neutral gas fraction for our pair candidates only using their own stellar masses (middle panel in Figure 7).
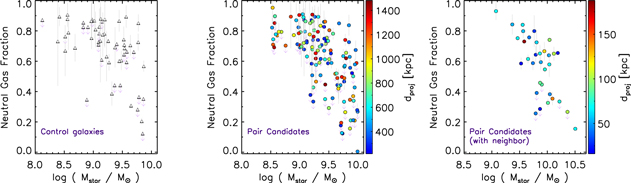
Figure 7. Neutral gas fraction as a function of stellar mass for control galaxies and pair candidates. All pair candidates in the middle and right panels are color coded by the projected separation to their nearest neighboring galaxies. In the middle panel, we only include well separated pair candidates in which their companion galaxies lie outside of the H i beam. We include pair candidates that have companions that lie within the Green Bank Telescope's H i beam in the right-hand panel, where their neutral gas fractions represents an average fraction for both galaxy components and the stellar mass represents the total stellar mass of those galaxy components. The uncertainties on fgas (gray bars) are derived using the uncertainties of H i fluxes in the H i-MaNGA program. The upper limits for galaxies in those panels are labeled with the downward arrow.
Download figure:
Standard image High-resolution imageBlanton & Moustakas (2009) found that the optical extent of galaxies generally is on the scale of at least 2 ≤ Roptical/Re ≤ 4, where Re is the effective radius at where half of the light of the galaxy is emitted. Moreover, Swaters et al. (2002) suggest that the H i content is RH i = (1.8 ± 0.8)Roptical times larger than the optical content for late-type dwarf galaxies with major diameter greater than 15 in the B band. When determining the H i mass of the MaNGA galaxy and its nearest minor neighbor, we assume that their maximum optical component extends out to  and that their maximum H i radio component extends out to
  or RH i ≲ 4.2 Roptical so that we can estimate whether or not the pair candidate and its nearest minor neighbor are both enclosed within the H i radio beam. We extract the effective radius of the minor neighbors for each pair candidate from the NSA galaxy catalog. When we examine the neighborhood of our pair candidates, we check whether the Δθbeam = 88 H i beam overlaps with our pair candidate and its associated companion galaxy. For pair candidates in close pairs with θsep + RH i,nbr,max ≤ Δθbeam/2, we determine the neutral gas fraction of the pair by
  with
with  the total stellar mass of the pair candidate and its associated neighbor, where θsep is their angular separation and where we used the effective radius of the neighboring galaxy to determine the maximum radial extent of its H i emission (
 ). Overall, pairs that are within a projected separation of dproj ≤ 200 kpc tend to both be enclosed within the H i beam coverage. Therefore, the neutral gas fraction for the close pair that is both enclosed within the H i beam represents an average fraction for both of the galaxies in that pair, whereas the neutral gas fraction for a galaxy pair with a greater angular separation is representative of only the pair candidate observed by MaNGA. In Figure 7, we show the neutral gas fraction of our control galaxies and pair candidates as a function of their stellar mass; we include close pairs within the H i beam in the right-hand panel, and the middle panel only displays the neutral gas fraction for distant pairs where their companion galaxies lie outside of the H i beam.
We find no distinct differences in the neutral gas fraction of pair candidates with a stellar mass ratio of MNeighbor/MCandidate ≥ 0.1 and control galaxies (see Figure 7). We further check whether the neutral gas fraction of our pair candidates vary with projected separation. We find that the neutral gas fraction of our pair candidates is dproj independent (see Figure 8). We observe that those pair candidates with a stellar mass ratio of MNeighbor/MCandidate < 0.1 possess relatively lower neutral gas fraction and lower SF strength compared to those galaxies with higher stellar mass ratio, which implies that their low neutral gas fraction may be responsible for the weak SF activity in those galaxies. We also find that galaxies with  generally have a neutral gas fraction of fgas ≥ 0.6.
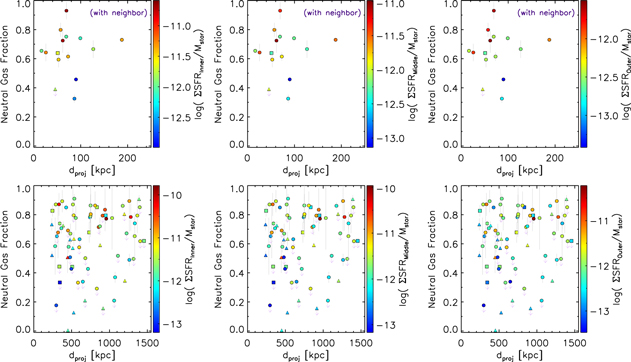
Figure 8. Neutral gas fraction as a function of projected separation for pair candidates with 0 ≤ ΔvLOS ≤ 100 km s−1, color coded by star formation strength within each radially binned region. Pair candidates with a stellar mass ratio of MNeighbor/MCandidate < 0.1, 0.1 ≤ MNeighbor/MCandidate < 0.25, and 0.25 ≤ MNeighbor/MCandidate ≤ 4 are represented by those triangles, squares, and circles. Similar to Figure 7, we separate these pair candidates into two groups. Those pair candidates in the top row and their companions are both enclosed within the H i beam in the H i-MaNGA program, where their neutral gas fraction is representative of the average fraction for both galaxy components. We include pair candidates that are in a more distant pair in the bottom row, where their neutral gas fraction represents the fraction for the the observed MaNGA galaxy component.
Download figure:
Standard image High-resolution image6. Discussion
6.1. The Comparison with the SBP15 Study
6.1.1. Comparison of Sample Selection Procedures
The SBP15 study selects their galaxies from the SDSS Data Release 7, whereas our galaxy sample is selected from the MPL-7 in SDSS DR15. Their galaxy sample spans a mass range of 7 ≤ log(M⋆/M⊙) ≤ 9.7 at the redshift of 0.005 < z < 0.07. The median stellar mass of their sample is log(M⋆/M⊙) = 8.9, whereas the pair candidates in our sample have a median stellar mass of log(M⋆/M⊙) = 9.5. The isolated dwarf pairs in the SBP15 study are all at least 1.5 Mpc away from galaxies with log(M⋆/M⊙) > 9.7. Their galaxy pair sample includes a main sample with a projected separation of less than 50 kpc and extended sample with a projected separation of out to 300 kpc. They use these selected pairs to explore how the SFR in these galaxies varies as a function of projected separation. More than 90% of their galaxy sample have a velocity separation ΔvLOS < 150 km s−1. Isolated dwarf pairs in SBP15 study have a higher-mass compared to the lower-mass companion galaxy with stellar mass ratios of M⋆,high/M⋆,low ≤ 10, but most of their pairs have the stellar mass ratio  and only 4 of 60 pairs have stellar mass ratio
  .
.
We outline our selection procedure in Section 3 above. Here we summarize the differences in the selection criteria used in the SBP15 study and this work. Both our pair candidates and the isolated dwarf pairs in the SBP15 study are not accompanied by massive galaxies within the projected radius of dproj ≤ 1500 kpc. However, we define the stellar mass of a massive neighboring galaxy differently. The SBP15 study considers all galaxies with  to be a massive galaxy; we identify massive galaxies to be ones with a stellar mass ratio that exceeds the stellar mass ratio for each pair candidate and its corresponding neighbor by a stellar mass ratio of MNeighbor/MCandidate > 4. Another major difference is in the range of their projected separation. The SBP15 study focuses on pairs that have a projected separation to dproj ≤ 50 kpc as these galaxies have a higher probability of experiencing a nonnegligible tidally interacting with their companion. They select this limit because SF enhancements in interacting galaxies have been primarily observed in massive galaxy pairs that have separations around half of the virial radius (e.g., Patton et al. 2013). The SBP15 study estimated that their low-mass galaxies have a typical virial radius of rvir ≈ 120 kpc and therefore they anticipate that interaction signatures will be observable for pairs with a separation range of dproj ≲ 50 kpc. Because our galaxies span a similar stellar mass range, it is reasonable to assume that they have a similar virial radius to those galaxies in the SBP15 study. We have 22 pair candidates in our sample that have a projected separation of less than half a virial radius (
 ); 265 of our pair candidates span a projected separation between
  . We include galaxies that span a larger range of projected separations because we are able to spectroscopically explore the SF properties of our galaxy sample out to a larger galactic radius of R = 1.5 Re, and we did not want to assume a priori that the outskirts of the galaxies are not influenced by their companions at larger separations. In contrast, the SBP15 study only spectroscopically explores their galaxies toward the optically brightest location in their galaxy, which is most often at the central region of their galaxies. Further, we also did not want to assume that the typical separation of half a virial radius or less for SF enhancements occurs in large galaxy pairs applied to low-mass pairs, as Geha et al. (2012) suggest that galaxies with
  can still leave imprints on SF activity in their neighboring galaxies at a distance of 1.5 Mpc. In this way, this large projected separation enables us to explore if and at what projected separation the SF becomes enhanced in different radial regions within our galaxy sample. In Section 5.1, we found that the SF in low-mass galaxies can be affected by a low-mass companion galaxy out to a projected separation of dproj ≲ 400 kpc (see Figure 6).
The galaxies in the SBP15 sample are intentionally selected to be star forming within the 3'' SDSS single fiber, which is classified using the [N ii] BPT line-ratio cutoffs given in Kauffmann et al. (2003a). We do not perform this selection criterion for our sample, but we do examine the ionization mechanism of our galaxies using the MaNGA spatially resolved data. We found that around 75% of our galaxies would be classified as "star forming" using this classification scheme within the SDSS single-fiber coverage. We also compare our calculation results to the single-fiber classifications published by Kauffmann et al. (2003a) on the SDSS CasJobs workbench and our classifications are found to be consistent.
Like the work in the SBP15 study, our exploration of the neutral gas fraction of our sample occurred after our galaxies were already selected for our study. The analysis in the SBP15 study suggests that the enhanced SFR in their isolated dwarfs are not strong enough to deplete their gas, because there are no significant differences in neutral gas fraction between their isolated dwarf pairs and control group. Galaxies in their study are also found to be gas rich (fgas > 0.6) in general, and their neutral gas fraction is not separation dependent. The neutral gas fraction for our galaxies has a higher dispersion, which could be related to their slightly higher stellar mass than those galaxies in the SBP15 study (Figure 1) as galaxies with higher stellar mass generally have lower neutral gas fraction (e.g., Diemer et al. 2019).
6.1.2. Comparison of SFR Trend
To conduct a comparison with the SFR trends in the SBP15 study, we only use a subset of our sample to better match the sample used in their study. This subset only includes galaxies with a stellar mass of  and pair candidates with a stellar mass ratio of 0.25 ≤ MNeighbor/MCandidate ≤ 4.0 and that span a velocity separation of 0 ≤ ΔvLOS ≤ 100 km s−1 to their nearest minor neighbors. We additionally exclude one control galaxy (PlateIFU = 9891-1901) and one pair candidate (PlateIFU = 8941-6101) from this subset because they were not observed in the SDSS single-fiber survey; thus, we are unable to characterize their star formation properties within the 3'' single-fiber radius without making assumptions on where the single fiber would have been positioned. This comparison subset consists of 72 control galaxies and 77 pair candidates.
We determined our SFRs slightly differently than the SBP15 study. Here we summarize those differences. In our work, we use the data from the MaNGA IFU survey and the location of the single SDSS fiber in the NSA galaxy catalog to recover the SFR within the 3'' fiber (SFRFiber) for our galaxies. The position of the SDSS single-fiber observations tends to be at the brightest optical spot of the galaxy, which is most often the center of the galaxy, but is sometimes a bright star-forming knot. The SFRFiber is derived from the product of star formation surface density within the fiber coverage (ΣSFRFiber) and the area of the 3'' fiber, where the ΣSFRFiber is derived using the SFR summed up from all valid spaxels within the fiber coverage (around 37 on average) divided by the area of those included spaxels within the 3'' fiber (Figure 9). Further, to ensure that we account for the fractional area of MaNGA spaxels that are only partially within a 3'' fiber beam coverage, we do this by weighting the star formation of the spaxels on the edge of the region of interest by the fraction of area that is within the beam footprint. Our SFR trend for pair candidates is revealed by using the moving-average method. It should be noted that our pair candidates are the only component galaxy in each galaxy pair that are observed by MaNGA with the exception of one galaxy pair that had both components observed in the MaNGA survey. Therefore, our SFR trend is estimated using the SFR of one member in each galaxy pair, whereas the SBP15 study used both members of the pair. Additionally, we calculate the average SFR of all our control galaxies to construct a uniform average control level as the standard level when we examine the environmental impact on the star formation in low-mass galaxies. Our control galaxies have ![$\mathrm{log}[{\mathrm{SFR}}_{\mathrm{fiber}}/({M}_{\odot }\,{\mathrm{yr}}^{-1})]=-1.36\pm 0.05$](https://content.cld.iop.org/journals/0004-637X/894/1/57/revision1/apjab6deeieqn101.gif) and
and ![$\mathrm{log}[({\mathrm{SFR}}_{\mathrm{fiber}}/{M}_{\star })/{\mathrm{yr}}^{-1}]=-10.46\pm 0.06$](https://content.cld.iop.org/journals/0004-637X/894/1/57/revision1/apjab6deeieqn102.gif) .
.
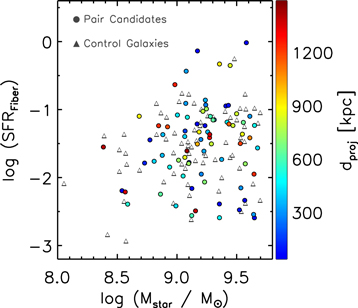
Figure 9. SFR within the 3'' fiber in the galactic center as a function of stellar mass; pair candidates are color coded by the projected separation.
Download figure:
Standard image High-resolution imageThe SBP15 study extracted their SFRs from Brinchmann et al. (2004), which were derived by applying the luminosity–SFR relation and calibrator in Kennicutt (1998); this enabled them to calculate the average SFR of both members in the associated dwarf pair. Furthermore, every dwarf pair in the SBP15 study has a matched isolated dwarf with similar stellar mass and redshift. The SFR trend in the SBP15 study for their isolated dwarf pairs and matched isolated dwarfs is estimated from the average SFR in bins of 50 kpc projected separation (left panel of Figure 5 in the SBP15 study); the SFRs for those matched isolated dwarfs are estimated in each separation bin to represent the control level of star formation. Because the SBP15 study and our work use different luminosity–SFR calibrator ν2, we apply a  -scale factor to achieve consistent SFRs.
In general, the  trends for our pair candidates and control galaxies match those trends found in the SBP15 study in that we also observe an increase in SFR at small projected separations of
  and that our control levels are similar (see Figure 10). Our
  trends support those results in the SBP15 study that the SFR is enhanced within the SDSS single-fiber coverage when the projected separation is less than 100 kpc, but it is also noticeable that some of our pair candidates have significantly high SFRs throughout the entire projected separation range of dproj ≤ 1500 kpc. We check the stellar mass for those active star-forming galaxies in Figure 9, and it turns out that those galaxies also have higher stellar mass than others. This fact is consistent with the well-accepted tight correlation between SFR and stellar mass (the SF main sequence).
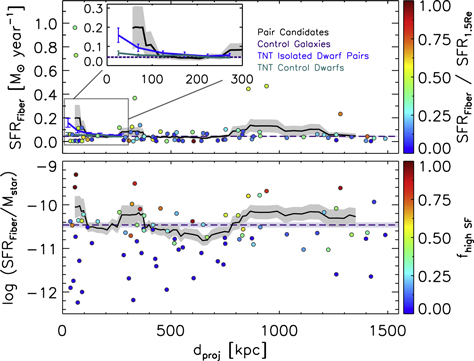
Figure 10. Top panel shows the SFR within the 3'' fiber in the galactic center as a function of projected separation with the color coding representing the SFR within the fiber in the galactic center divided by the SFR within  . The bottom panel shows the SF strength within the fiber as a function of projected separation, and the color code represents the high-ΣSFR fraction within 1.5 Re. Pair candidates that are included in these panels have a stellar mass ratio of
  and
and  . The circular symbol represents the data for each individual pair candidate under this environmental condition. The SF trends (solid line) and standard error (shadow in gray) are calculated using the moving-average method, where we estimated each average value using a subset of 10 adjacent galaxies in ascending order of
  . The control level in each panel is represented by the average value (dashed line) and the associated standard error (rectangular shadow in purple) of control galaxies. The average SFRs for TNT isolated dwarf pairs and TNT control dwarfs are extracted from the left panel of Figure 5 in the SBP15 study, and the error bars show the standard error. In the top panel, we apply a
  scale to the SFR trends in TNT and the
  , in which
  is the
  calibrator in Equation (1). To better compare our SFR trend with that in the SBP15 study, we zoom in our SFR trend to the projected separation range of dproj ≤ 300 kpc in the attached plot in the top panel.
Download figure:
Standard image High-resolution imageWe further examine the scale of the SF enhancement by normalizing our SFR trend as a function of dproj with the control level (bottom panel of Figure 10). We find that there is a significant enhancement in the SFR for galaxies with a projected separation of dproj ≤ 100 kpc that peaks at  (see Figure 11). The SBP15 study observed an enhancement of only
  , which is a factor of 2.0 ± 1.3 less than the value in our results. This difference could be in part because we did not have as many extremely low-mass galaxies as the SBP15 study had within the stellar mass range of
  , which are generally expected to have weaker star formation according to the star formation main sequence. Further, around 55% of our pair candidates have a higher stellar mass than its associated companion (Figure 12). We refer to the galaxy that has a greater stellar mass in the pair as the "primary" component and the less massive companion as the "secondary" component. Kaviraj (2014) found that during tidal interaction, the primary component in galaxy pairs tends to experience greater SF enhancement than the secondary component. We also observe that the enhancement of SF strength within the SDSS 3'' fiber coverage peaks at
  for our pair candidates within a projected separation of
  (see Figure 11). This is essentially the same as the results on SF enhancement we obtained for the spatially resolved inner region (
 ) at
) at  (Figure 6 and Table 3).

Figure 11. Change in star formation rate and star formation strength within the 3'' SDSS fiber along with the ascending order of projected separation for pair candidates with a stellar mass ratio of  and
and  . The standard errors of each derived fraction are presented by the envelopes.
Download figure:
Standard image High-resolution image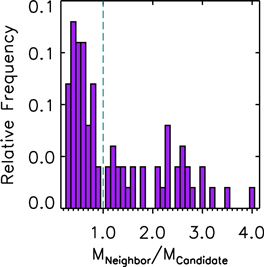
Figure 12. Distribution of the stellar mass ratio for pair candidates in Figure 10. The pair candidates selected from the MaNGA survey are primary components in the associated galaxy pairs if  . Otherwise, they are considered as the second components.
Download figure:
Standard image High-resolution imageTo further check our SF trend, we also explore the distribution of star formation within the entire  , because it is possible that the star formation activities in galaxies are not well represented by their behavior within a single fiber. We use the
  to investigate how much star formation occurring within the fiber region compares to the entire galaxy within the radial coverage of
  . The SFR within the entire
  region (
 ) is calculated by adding up the total SFR of all three radially binned regions, in which the total SFR for each binned region is estimated using the product of the respective ΣSFR and the region area. A high SFR fraction
  correlates to a more representative SF behavior within the fiber coverage. On average, our control galaxies have
  (see Figure 13), which suggests that the SDSS 3'' fiber region contributes 18% of the SF budget within the region R ≤ 1.5 Re for these galaxies. For those pair candidates with SF strength above the control level, their SFR fractions are normally greater than 0.25. Overall, we find that this SFR fraction is independent of the projected separation for our pair candidates, which is shown by the color of the data symbols in the top panel of Figure 10. This SFR fraction is also found to be independent of dproj for those pair candidates.
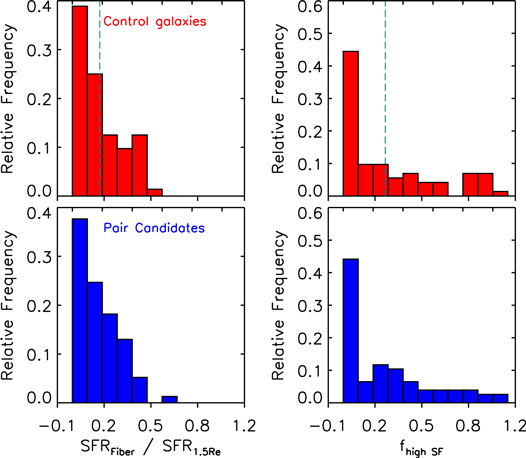
Figure 13. Fraction of star formation within the fiber and the fraction of spaxels with high ΣSFR for control galaxies and pair candidates in Figure 10. The vertical dashed lines in the histograms of control galaxies represent their average level.
Download figure:
Standard image High-resolution imageWe also use the high-ΣSFR fraction within R ≤ 1.5 Re to describe how SF spread out within the entire galaxy (the color coding in the bottom panel of Figure 10). The high-ΣSFR fraction ( ) is calculated from
  , where
  is the total amount of spaxels within R ≤ 1.5 Re and
  describes how many spaxels with ΣSFR higher than the average ΣSFR of spaxels in control galaxies. The average star formation surface density of our control galaxies is
  within the radial region of R ≤ 1.5 Re. On average, our control galaxies have a high-ΣSFR fraction of
  (see Figure 13).
For these control galaxies and pair candidates in this comparison subset, we find no distinct differences in the distribution of their SFR fraction  and
and  (see Figure 13). Around 15.2% control galaxies and 18.3% pair candidates have
  higher than the average control level but their
  are lower than the average value in control galaxies, which suggests that these galaxies have strong SF activities occurring outside of the fiber coverage. Therefore, galaxies with high
  do not necessarily have high
  . The star formation activities in those galaxies with displaced SF may not be properly represented by their SFR within the fiber coverage.
6.2. SF Activities in Recovered and Robust Galaxies
6.2.1. Robust Galaxies RB1–RB3
There are three Robust galaxies (RB1–RB3 in Figure 14) that are found to have a  over 10 times higher than the average control level throughout the three radially binned regions. The RB1 galaxy originates from the "Pair" category, and the dproj is around 957 kpc to its nearest neighbor. The RB2 galaxy and RB3 galaxy are originally in the "Control" category. None of these RB galaxies have extra-close neighbors in their surrounding environments.

Figure 14. The optical image, Hα equivalent width (EW) map, Hα-base SFR map, and [N ii] BPT map for galaxies in the Recovered category (RC1–RC4) and Robust category (RB1–RB3). The hexagons in the optical images represent the sight of the associated MaNGA IFU. The Hα EW and SFR are in units of angstroms and  , respectively. The x-axis and y-axis for those two-dimensional maps represent the position in units of arcseconds, and the interval between adjacent ticks represents 5'', which is the same as the scale in the optical images. The smallest cyan circle represents the sight view of the SDSS 3'' single fiber. The three solid-line, dashed-line, and dashed–dotted-line ellipses in these maps are positioned at
  ,
,  , and
, and  , respectively, along the semimajor axes. The "Star-forming" (SF), "Composite" (COMP), and "Active galactic nuclei" (AGN) ionized region in the BPT maps are identified based on the classification lines in Kewley et al. (2001) and Kauffmann et al. (2003b).
Download figure:
Standard image High-resolution imageFigure 14 reveals that these RB galaxies are all relatively compact, as their effective radius are all found to be around 5''. The strength of Hα emission compared to the stellar continuum can be traced by the equivalent width (EW) of the Hα line; the Hα EW are all significantly higher in the galactic center for these RB galaxies. Their spatially resolved SFR maps also demonstrate that their SF activities are all concentrated in the central region. We further adapt the BPT diagnostic diagram with those classification lines in Kewley et al. (2001) and Kauffmann et al. (2003a) to investigate the ionization mechanism in those galaxies; all involved emission lines are required to have equivalent width greater than 1 Å. The region labeled as "Star-forming" (SF) is ionized by the SF activity, and the "Active galactic nuclei" (AGN) area is powered by AGNs or other ionization mechanisms that are much more energetic than SF activities. The "Composite" (COMP) area is a mixture of the region powered by AGNs and SF. The spatially resolved BPT maps show that the ionization in these RB galaxies is all dominated by SF activities.
6.2.2. Recovered Galaxies RC1–RC4
Four galaxies are found to have recovered close neighbors through a visual check on the SDSS SkyServer. These "recovered" (RC) pairs are photometrically identified and recovered neighbors for those MaNGA galaxies were not present in the NSA galaxy catalog. These galaxies in the "RC" category are shown in the bottom four rows of Figure 14. The RC1 galaxy originates from the "Pair" category and its nearest neighbor in the NSA catalog is dproj ≈ 1400 kpc away; the rest of the three RC galaxies are originally in the "Control" category. For each recovered galaxy, we estimate their projected separations using their R.A. and decl. position information provided by SDSS SkyServer photometry data. We do not know the redshift and stellar mass of these recovered neighbors due to the lack of spectroscopy observation. The line-of-sight kinematic separations and stellar mass ratios are vague for these recovered galaxy pairs, which makes it difficult to examine to which environmental bins in Figure 5 they belong.
The star formation strength of those recovered galaxies is not significantly enhanced compared with the average control level for any radially binned region (Figure 15). The SFR within the fiber coverage for RC1–RC3 galaxies is considerably higher than the average level of control galaxies (SFRFiber ≈ 0.04  ). However, it is unclear whether this active star formation is triggered by the interaction because although these galaxies are spatially close to their companions on the sky, we do not know their line-of-sight kinematic separation.

Figure 15. SF strength in logarithm is plotted as a function of the recovered projected separation for recovered pairs, in which  is the separation from the target galaxies to their recovered neighbors. Each individual recovered pair is represented by the symbol that is color coded by their SFR within the fiber coverage. The average control level for each radially binned region is represented by the average
  (dashed line) and the associated standard error (rectangular envelope) of control galaxies.
Download figure:
Standard image High-resolution image7. Conclusion
We explore the environmental influences on star formation activities in low-mass galaxies using the SDSS-IV/MaNGA spatially and spectroscopically resolved data set for 386 low-mass galaxies with stellar mass  at a redshift of 0.01 < z < 0.07. We use these observations specifically to explore how different configurations of projected separation, line-of-sight kinematic separation, and the stellar mass ratio of galaxy pairs impact their star formation strength at different galactic radii compared to the isolated control galaxy sample. In this study, we intentionally exclude low-mass MaNGA galaxies that are accompanied by a higher-mass neighboring galaxy (MNeighbor/MMaNGA > 4) within a projected distance of dproj ≤ 1500 kpc as tidal interactions with a massive galaxy can trigger the star formation within a gas-rich satellite galaxy and can ultimately quench its star formation by stripping its gas. We identify the neighboring galaxies for our sample using the NSA galaxy catalog, which includes all galaxies with r-band Petrosian magnitude r ≤ 17.77 and spectroscopically determined redshift at z < 0.15 in the 13th data release of SDSS (SDSS DR13). Our pair candidates have projected separations of dproj ≤ 1500 kpc and line-of-sight kinematic difference of ΔvLOS ≤ 300 km s−1 to their nearest low-mass neighboring galaxies with stellar mass ratio of MNeighbor/MCandidate ≤ 4. Galaxies in our control group do not have neighboring galaxies at any given stellar mass in the NSA galaxy catalog within a projected radius of dproj ≤ 1500 kpc. Our sample of low-mass galaxies are predominantly classified as star forming, with a mass-weighted star formation surface density that diminishes with radial distance from their galactic center.
We radially bin our selected galaxies into inner (0–0.5 Re), middle (0.5–1.0 Re), and outer (1.0–1.5 Re) regions to investigate the variation of their star formation strength ( ) as a function of radial distance from their galactic center, where Re is the effective radius where half of the light is emitted by the galaxy. We use the fractional change in star formation strength (fΔSF in Equation (2)) to describe how much the star formation activities in our selected galaxies are enhanced (fΔSF > 0) or suppressed (fΔSF < 0) under different environmental conditions compared to the average level of control galaxies. We summarize our conclusions as follows:
- 1.Low-mass galaxies that are within ΔvLOS ≤ 100 km s−1 of a lower-mass companion at MNeighbor/MCandidate < 0.1 tend to have weaker star formation activity when dproj ≤ 400 kpc compared to the average level of those control galaxies with fΔSF ≈ −0.87 throughout the galaxy.
- 2.Low-mass galaxies with ΔvLOS ≤ 100 km s−1 possess enhanced star formation at dproj ≤ 400 kpc when their neighboring galaxies have 4–10 times smaller stellar mass. We find that their star formation is elevated by an average level of fΔSF = 1.30 ± 0.61, 1.23 ± 0.60, and 0.71 ± 0.34 in the inner, middle and outer regions, respectively.
- 3.We observe the strongest interaction-induced enhancement on star formation when the low-mass galaxies that are paired with other low-mass neighboring galaxies that have compatible stellar mass (with stellar mass ratio 0.25 ≤ MNeighbor/MCandidate ≤ 4). When these galaxies are within ΔvLOS ≤ 100 km s−1 and dproj ≤ 100 kpc from their companion, we find that their star formation is enhanced by
 , 1.45 ± 0.73, and 0.93 ± 0.41 in the inner, middle and outer regions, respectively, compared to our isolated control sample.
 - 4.We find that the neutral gas fraction of our pair candidates and control sample does not vary with projected separation for close kinematic pairs with ΔvLOS ≤ 100 km s−1. We also find that the pair candidates with stellar mass ratio MNeighbor/MCandidate ≥ 0.1 have a similar neutral gas fraction to the control group. All star-forming low-mass galaxies with have a neutral gas fraction that is . Galaxies in our sample tend to have a lower neutral gas fraction when they are accompanied by a lower-mass companion with a stellar mass that is over 10 times smaller.
- 5.We compared our spectroscopically and spatially resolved results with SFRs derived within the SDSS 3'' single-fiber footprint for selected pair candidates with a stellar mass of. We found that their average SFR becomes significantly higher than the control sample when , , and stellar mass ratio , peaking at . The star formation strength of these galaxies within the fiber coverage is enhanced by .


Funding for the Sloan Digital Sky Survey IV has been provided by the Alfred P. Sloan Foundation, the US Department of Energy Office of Science, and the Participating Institutions. SDSS-IV acknowledges support and resources from the Center for High-Performance Computing at the University of Utah. The SDSS website is www.sdss.org.
SDSS-IV is managed by the Astrophysical Research Consortium for the Participating Institutions of the SDSS Collaboration including the Brazilian Participation Group, the Carnegie Institution for Science, Carnegie Mellon University, the Chilean Participation Group, the French Participation Group, Harvard-Smithsonian Center for Astrophysics, Instituto de Astrofísica de Canarias, The Johns Hopkins University, Kavli Institute for the Physics and Mathematics of the Universe (IPMU)/University of Tokyo, the Korean Participation Group, Lawrence Berkeley National Laboratory, Leibniz Institut für Astrophysik Potsdam (AIP), Max-Planck-Institut für Astronomie (MPIA Heidelberg), Max-Planck-Institut für Astrophysik (MPA Garching), Max-Planck-Institut für Extraterrestrische Physik (MPE), National Astronomical Observatories of China, New Mexico State University, New York University, University of Notre Dame, Observatário Nacional/MCTI, The Ohio State University, Pennsylvania State University, Shanghai Astronomical Observatory, United Kingdom Participation Group,Universidad Nacional Autónoma de México, University of Arizona, University of Colorado Boulder, University of Oxford, University of Portsmouth, University of Utah, University of Virginia, University of Washington, University of Wisconsin, Vanderbilt University, and Yale University.
Appendix: SFR Maps for All Selected Galaxies
The Hα-based SFRs for all selected galaxies are calculated using the methods in Section 4. The complete set of the 2D SFR maps for all galaxies in our sample is presented in Figure 16.

Figure 16.
Two-dimensional SFR maps for all selected galaxies. The color in each map reflects the value of the SFR for each spaxel; the first and second printed value within the parentheses represents the minimum and maximum value of log SFR for each galaxy. The three solid-line, dashed-line, and dashed–dotted-line ellipses in these maps are positioned at R = 0.5 Re, 1.0 Re, and 1.5 Re, respectively, along the semimajor axes. The smallest cyan circle in each map represents the targeted region in the SDSS single-fiber survey; each circle has a diameter of 3''. No cyan circles are shown for those six galaxies that do not have data in the SDSS single-fiber survey. The PlateIFUs of these galaxies are displayed in green. (An extended version of this figure is available.)
Download figure:
Standard image High-resolution image