


Abstract
Precise stellar ages of stars are necessary to study the evolution of the Milky Way. The age determination is significantly affected by C and O abundances of stars due to their contribution to the overall metallicity and opacity. On the basis of C and O abundances derived from high-resolution observations, we determine the ages of 148 FGK-type dwarfs in the solar neighborhood by considering C and O enhancements individually. Our results show that using C and O enhancements individually could affect the age determination of the high-α population, especially for stars with [O/α] > 0.2 dex, making them about 1 Gyr younger compared to the results using traditional α-enhanced models. This results in a steeper slope in the age–[α/Fe] relation for the high-α population (changes from 0.0339 ± 0.0075 to 0.0436 ± 0.0086), indicating a higher formation rate. We find no tight relation between age and [α/Fe] or [O/Fe] in the high-α populations. The distribution of space velocity for young α-rich stars shows that they are more likely characterized to the low-α populations.
Export citation and abstract BibTeX RIS
1. Introduction
The Milky Way consists of a halo, a disk, and a bulge. Each of them has a formation history. To study the formation and evolution of the Galaxy, it is necessary to analyze the distribution functions of stars with different components in space, dynamics, age, and chemical composition.
Since the galactic disk was first separated into a thin disk and thick disk with different scale heights (Gilmore & Reid 1983), many works have studied these two different populations chemically or kinematically (e.g., Adibekyan et al. 2012; Haywood et al. 2013; Bensby et al. 2014; Silva Aguirre et al. 2018; Buder et al. 2019). There have also been doubts about whether the thick disk exists (Bovy et al. 2012; Hayden et al. 2017). Generally, it is assumed that the thin disk and the thick disk can be separated by space velocities. The population of the thick disk should be kinematically hotter than that of the thin disk. So the timescales of formation history, related to the chemical enrichment history, are different. Thus, these two populations show different trends in both kinematic and chemical spaces. However, the kinematic evolution of the Galaxy altered the original spatial and kinematic distributions of stars in a population (Nissen 2013), thus the chemical abundances are more likely to be regarded as population tracers. Due to the wide age range of dwarfs and the preservation of initial chemical abundances, the F, G, or K type dwarfs are thought to be good tracers of stellar populations.
To study both the kinematic and the chemical evolutions of different populations in the Milky Way, age measurements of stars are necessary. However, stellar ages are quite challenging to determine, and one reliable method is to use grid-based modeling to estimate the stellar parameters of stars. In a stellar evolution model, the metal mixture is a crucial part that can directly affect the opacity and the overall metallicity Z. The α-enhanced models are widely used, and consider O with the same enhancement as other α elements and do not include C enhancement, e.g., YY isochrones (Yi et al. 2001, 2003; Kim et al. 2002; Demarque et al. 2004), Dartmouth Stellar Evolution Database (Dotter et al. 2008), and Padova stellar models (Girardi et al. 2000; Salasnich et al. 2000; Bressan et al. 2012). However, observations suggest that the O enhancement is different from other α elements (Bensby et al. 2005; Reddy et al. 2006; Nissen et al. 2014; Bertran de Lis et al. 2015). Many stars with C enhancement are also observed (Bensby et al. 2005; Reddy et al. 2006; Nissen et al. 2014). The O enhancement could differently influence the stellar evolution compared with other α elements (Dotter et al. 2007; VandenBerg et al. 2012). The C enhancement could also influence the stellar evolution (Dotter et al. 2007; VandenBerg et al. 2012). With high-resolution observations released, we should consider detailed O and C abundances in stellar models. It is proposed that using models with C and O enhancements could influence the age determination of metal-poor α-enhanced stars (Ge et al. 2016).
We aim to study the impact of C and O abundances on the age determination. We determine the ages of 148 disk stars using models considering C and O enhancements and compare them with results from traditional α-enhanced models. These stars mainly consist of main-sequence turnoff stars and include some subgiant stars as well. We show relations between age and chemical properties. With the Gaia DR2 database, we determine the kinematic properties of these stars. The paper is structured as follows. Section 2 describes the sample selection. Section 3 presents the stellar evolution model. Section 4 describes the results, including chemical and kinematical analysis. Section 5 summarizes our findings.
2. Data Selection
2.1. Samples
To build a sample of dwarfs in the solar neighborhood with precise chemical abundances (especially C and O) and atmospheric parameters, we selected the targets from the following samples:
- 1.From Zhao et al. (2016, hereafter Z16) we select 39 galactic field FGK-type stars with metallicity −3 ≤ [Fe/H] ≤ +0.3. The spectra of most stars are obtained using the Hamilton Echelle Spectrograph mounted on the Shane 3 m telescope of the Lick observatory with the resolving power of R =
 = 60,000, covering a wavelength range from 3700 Å to 9300 Å. For most stars the signal-to-noise ratios (S/Ns) at 5500 Å are higher than 100. The C abundances are measured from three indicators : C i, the molecular CH, and C2 lines. The O abundances are determined from the O i IR lines.
 - 2.Brewer & Fischer (2016, hereafter B16) presents a catalog of uniformly determined stellar properties and abundances for 1617 F, G, and K stars, which are observed using the HIRES spectrograph at Keck Observatory. The HIRES spectra cover a wavelength range from 5160 Å to 7800 Å and has R ∼70,000 with typical S/Ns of 200. Brewer et al. (2016) restricted the sample to main-sequence stars with S/N > 100, 4800 K 6100 K, km s−1 and log g ≤ 3.5. These cuts resulted in a sample of 849 dwarf stars in the local neighborhood. We select 62 stars with relatively higher C, O, and α (Mg, Si, Ca, Ti) enhancements ([C/Fe] > 0.1, [O/Fe] > 0.2, [α/Fe] > 0.1).
- 3.The HARPS planet search program includes three subsamples: HARPS-1 (Mayor et al. 2003), HARPS-2 (Lo Curto et al. 2010), and HARPS-4 (Santos et al. 2011). The whole sample comprises 1111 FGK-type dwarf stars with spectra at a resolution R ∼110,000 and an S/N between ∼40 and ∼2000. Adibekyan et al. (2012, hereafter A12) presented a detailed abundance analysis of 12 refractory elements (Na, Mg, Al, Si, Ca, Ti, Cr, Ni, Co, Sc, Mn, and V). Bertran de Lis et al. (2015) selected 762 stars from the HARPS samples and derived their oxygen abundances with the 6158 Å and 6300 Å O lines. Suárez-Andrés et al. (2017) presented a detailed spectroscopic analysis of these stars and measured the C abundances from the CH band at 4300 Å. Based on these works and considering the high C and O abundance errors, we only select 12 stars from this sample that have high O enhancement ([O/Fe] > 0.3) and that fit in with our metal mixtures and opacities.
- 4.Nissen et al. (2014, hereafter N14) determined C and O abundances for more than 100 F and G main-sequence stars in solar vicinity. The sample includes the HARPS–FEROS sample and UVES–FIES sample, with resolutions of R ∼115,000 and R ∼48,000 for spectra individually. The C abundances are derived from the C i lines at 5052 Å and 5380 Å and the O abundances are derived from the forbidden [O i] line at the 6300 Å and ∼7774 Å O i triplet lines. The high α-enhanced stars of this sample have been studied, and their ages are determined considering C and O enhancements individually by Ge et al. (2016). We select the rest sample including 35 stars with low α enhancements.


For the B16, Z16, and A12 samples, the [α/Fe] values are calculated by taking the averages of [Mg/Fe], [Si/Fe], [Ca/Fe], and [Ti/Fe]. For the N14 sample, the [α/Fe] values of the UVES–FIES sample are calculated with the same approach used for the B16, Z16 and A12 samples; for the HARPS–FEROS sample, the [α/Fe] values are calculated by taking averages of [Mg/Fe], [Si/Fe], and [Ti/Fe] from Adibekyan et al. (2012). Table 1 lists the typical errors for Teff, log g, and [Fe/H] for stars from each sample, the C and O lines used in each sample, and the non-LTE (local thermodynamic equilibrium) corrections for each sample. The atmospheric parameters, element abundances, and typical errors for  , log g, and [Fe/H] of the whole sample are listed in Table 2.
Table 1. Spectral Properties of Each Sample
| Source |
![$\mathrm{err}[{T}_{\mathrm{eff}}]$](https://content.cld.iop.org/journals/0004-637X/889/2/157/revision1/apjab66c7ieqn5.gif)
|
![$\mathrm{err}[\mathrm{log}{\text{}}g]$](https://content.cld.iop.org/journals/0004-637X/889/2/157/revision1/apjab66c7ieqn6.gif)
|
![$\mathrm{err}[[\mathrm{Fe}/{\rm{H}}]]$](https://content.cld.iop.org/journals/0004-637X/889/2/157/revision1/apjab66c7ieqn7.gif)
|

|

|
NLTE |
| B16 |

|
±0.03 | ±0.01 | 63 atomic carbon lines |
 , OH lines , OH lines |
No |
| Z16 |

|

|

|
the atomic C i and the molecular CH and C2 lines | O i IR lines | Yes |
| N14 |

|
±0.05 | ±0.03 | the C i lines at 5052 Å and 5380 Å | the forbidden [O i] line at the 6300 Å and ∼7774 Å O i triplet lines | Yes |
| A12 |

|
±0.06 | ±0.03 | the CH band at 
|
the 6158 Å and 6300 Å O lines | No |
Download table as: ASCIITypeset image
Table 2.
The Atmospheric Parameters, Element Abundances, and Typical Errors for the  , Log g, and [Fe/H] of the Whole Sample
| Star |

|

|
![$[\mathrm{Fe}/{\rm{H}}]$](https://content.cld.iop.org/journals/0004-637X/889/2/157/revision1/apjab66c7ieqn21.gif)
|
![$[{\rm{C}}/\mathrm{Fe}]$](https://content.cld.iop.org/journals/0004-637X/889/2/157/revision1/apjab66c7ieqn22.gif)
|
![$[{\rm{O}}/\mathrm{Fe}]$](https://content.cld.iop.org/journals/0004-637X/889/2/157/revision1/apjab66c7ieqn23.gif)
|
![$[\alpha /\mathrm{Fe}]$](https://content.cld.iop.org/journals/0004-637X/889/2/157/revision1/apjab66c7ieqn24.gif)
|

|
|---|---|---|---|---|---|---|---|
| ID | (K) | (dex) | (dex) | (dex) | (dex) | (dex) | |
| HD 199476 | 5501 ± 25 | 4.55 ± 0.03 | −0.52 ± 0.01 | 0.09 ± 0.03 | 0.24 ± 0.04 | 0.15 | B16 |
| HD 45205 |

|
4.08 ± 0.03 | −0.87 ± 0.03 | 0.26 ± 0.04 | 0.61 ± 0.10 | 0.25 | Z16 |

|

|

|

|

|

|

|

|
Only a portion of this table is shown here to demonstrate its form and content. A machine-readable version of the full table is available.
Download table as: DataTypeset image
2.2. Systematic Consistency
The A12 sample and B16 samples do not consider the non-LTE corrections of C and O abundances, thus we need to see whether there exist system deviations between the A12 and B16 and A12 and B16 samples and other samples. Figure 1 shows the distribution of C and O abundances for the whole sample. There exist system deviations between the B16 sample and other samples: the relations of [C/Fe], [O/Fe] versus [Fe/H] show deviations from other samples. For the A12 sample, the deviation is not obvious in Figure 1. Two stars (HD 111777 and HD 119173) from the A12 sample seem to deviate a little from the other sample; their [C/Fe] are −0.01 and −0.04 respectively, which have little effect on our results. The O abundances for the A12 sample are derived from Bertran de Lis et al. (2015), who proposed that non-LTE corrections for O i 6158 Å are negligible, and would not affect [O i]6300 Å. Thus, we do not make a system correction for the A12 sample.
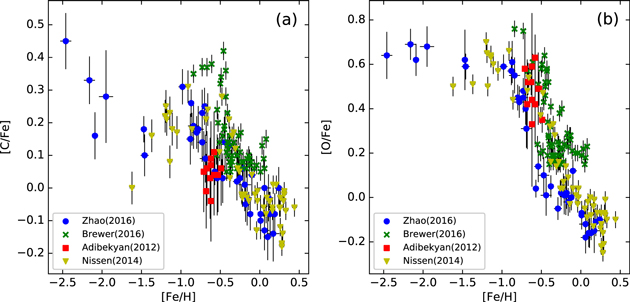
Figure 1. Relation between [C/Fe] or [O/Fe] and [Fe/H] for the total sample. The plots are color-coded by the sub-sample sources as given in the legends.
Download figure:
Standard image High-resolution imageFor the B16 sample, the deviation is obvious. To perform the system correction, we check the atmospheric parameters and chemical abundances of nine stars found in both the B16 sample and Z16 sample, including  , log g, [C/H], [O/H], [Fe/H], [Mg/H], [Si/H], [Ca/H], and [Ti/H]. Figure 2 shows comparisons of these parameters between the B16 and Z16 samples. As Figure 2 (green circle) shows, there exist clear deviations between these two samples. We use the offsets to revise the atmospheric parameters and chemical abundances of nine stars from B16 to be consistent with the Z16 sample. Note that all the offsets could be considered constants, and the constant is the mean difference in each case. We then use these offsets to make system corrections for the B16 sample. Figure 2 (blue circle) shows the results after performing a system correction.
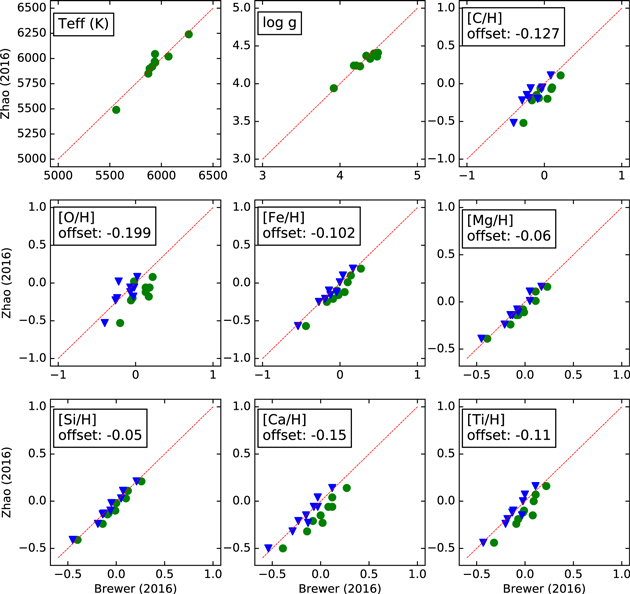
Figure 2. Comparison of atmospheric parameters and element abundances of nine stars found in both the Z16 and B16 samples. Green filled circle: before making a system correction; blue filled triangle: after making a system correction (see the text for the correction). The constant represents the value of the offset (mean difference) in each case. The red dashed line shows the agonic line.
Download figure:
Standard image High-resolution imageFigure 3 shows the distribution of C and O abundances from the whole sample upon applying offsets to the B16 sample. It shows a good consistency between these samples after making system corrections. However, it is difficult to confirm that the overlap sample between the B16 sample and Z16 sample spans the full parameter range. To show how much these offsets affect the results, we determine ages of stars from the B16 sample without applying offsets. See Section 4 for our analysis.

Figure 3. Relation between [C/Fe] or [O/Fe] and [Fe/H] for the total sample upon applying a system correction to the B16 sample. The plots are color-coded by the sub-sample sources as given in the legends.
Download figure:
Standard image High-resolution image2.3. C, O, and [α/Fe]
Figure 4 shows the correlation between [C/Fe], [O/Fe], and [α/Fe] for the entire sample. We plot one-to-one lines to show that the abundances of these elements can differ from [α/Fe]. The C and O enhancements are not obvious where [α/Fe] ≤ 0.1. For [α/Fe] ≥ 0.1, the [C/Fe] has large scatter; [O/Fe] is generally higher than [α/Fe] by about 0.3 dex ([O/α] > 0.3), which is also found in other works (Bensby et al. 2005; Reddy et al. 2006; Bertran de Lis et al. 2015).
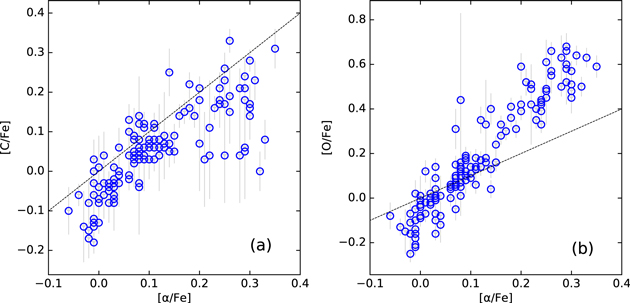
Figure 4. Relations between [C/Fe], [O/Fe], and [α/Fe] for the whole sample. (a): [C/Fe] as a function of [α/Fe]. (b): [O/Fe] as a function of [α/Fe]. The black dashed line shows the agonic line.
Download figure:
Standard image High-resolution imageFigure 5 shows the differences between [C/Fe], [O/Fe], and [α/Fe]. [C/Fe] and [O/Fe] can vary over large range sat fixed [α/Fe], e.g., for stars with [α/Fe] ∼0.3, their [C/Fe] could range from 0 to 0.4, and their [O/Fe] could range from 0.4 to 0.7. Stars with a fixed [α/Fe] can have several metal mixtures. Therefore, additional consideration of C and O abundances is necessary.
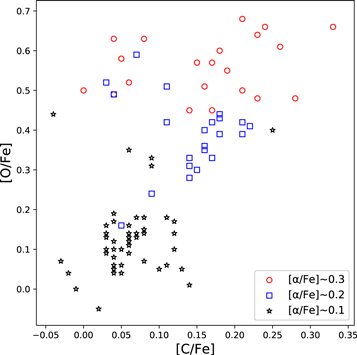
Figure 5. Left: relations between [C/Fe] and [O/Fe] at fixed [α/Fe]. Red circle: stars with [α/Fe] ∼ 0.3; blue square: stars with [α/Fe] ∼ 0.2; black asterisk: stars with [α/Fe] ∼ 0.1.
Download figure:
Standard image High-resolution image3. Stellar Models
3.1. Input Physics
With the Yale Rotation and Evolution Code (Guenther et al. 1992), we construct models to estimate the fundamental parameters (mass, age, luminosity and radius) of our sample. We use the physical quantities of the OPAL equation-of-state tables EOS2005 (Rogers & Nayfonov 2002), and the solar mixture GS98 from Grevesse & Sauval (1998). The opacity tables are OPAL high-temperature opacities9
supplemented by the low-temperature opacities (Ferguson et al. 2005). The helium abundances are modified with standard solar models Y = 0.248 + 1.3324 Z. The mixing-length parameter  is fixed to 1.75. Gravitational settling (atomic diffusion) has a significant impact on the old solar-type stars because it could affect Teff in stars where diffusive settling is taking place, resulting in younger age determinations of old stars (Jofré & Weiss 2011). Therefore, we include the gravitational settling of helium and heavy elements using the formulation of Thoul et al. (1994) for models with masses less than
  .
.
3.2. C and O Enhancements
In traditional α-enhanced metal mixtures, all the α elements (O, Ne, Mg, Si, S, Ca, Ti) have the same enhancement factors and the C enhancement is not considered. In CO-extreme metal mixtures, the enhancement factors of C and O are added individually, which differs from traditional α-enhanced models (Ge et al. 2016). In this work, all the input chemical abundances and element-enhanced factors ([Fe/H], [C/Fe], [O/Fe], [α/Fe]) are from observations. Table 3 lists all the metal mixtures used in the CO-extreme model.
Table 3. Metal Mixtures Used in Our Models
![$[{\rm{C}}/\mathrm{Fe}]$](https://content.cld.iop.org/journals/0004-637X/889/2/157/revision1/apjab66c7ieqn38.gif)
|
![$[{\rm{O}}/\mathrm{Fe}]$](https://content.cld.iop.org/journals/0004-637X/889/2/157/revision1/apjab66c7ieqn39.gif)
|
![$[\alpha /\mathrm{Fe}]$](https://content.cld.iop.org/journals/0004-637X/889/2/157/revision1/apjab66c7ieqn40.gif)
|
|---|---|---|
| (dex) | (dex) | (dex) |
| 0 | 0.4 | 0.3 |
| 0.1 | 0.2 | 0.1 |
| 0.1 | 0.3 | 0.1 |
| 0.1 | 0.5 | 0.3 |
| 0.1 | 0.6 | 0.3 |
| 0.2 | 0.3 | 0.2 |
| 0.2 | 0.4 | 0.2 |
| 0.2 | 0.5 | 0.2 |
| 0.2 | 0.5 | 0.3 |
| 0.2 | 0.6 | 0.3 |
| 0.3 | 0.5 | 0.2 |
| 0.3 | 0.6 | 0.2 |
| 0.3 | 0.6 | 0.3 |
| 0.3 | 0.7 | 0.3 |
| 0.4 | 0.5 | 0.2 |
| 0.4 | 0.6 | 0.2 |
Download table as: ASCIITypeset image
Figure 6 shows the stellar evolution tracks with different C and O enhancements. Figure 6(a) shows the stellar evolution tracks of fixed metallicity ([Fe/H] = −1). Figure 6(b) shows the stellar evolution tracks of fixed mass (Mass =  ). All the evolution tracks are calculated with [α/Fe] = 0.2. For each track, we choose one model at the end of the main sequence, which results in 24 models to compare. Table 4 lists the parameters of these 24 models (M1 ∼ M24). At the same [Fe/H] (Fe/H] = −1), comparing M1 (O enhancement is the same as other α elements) and M4 (O enhancement is differ from other α elements and C is enhanced), models considering C and O enhancements tend to have lower Teff. Comparing M2 and M3, when [O/Fe] is fixed and [C/Fe] is higher by 0.2 dex, the Teff is nearly unchanged. Comparing M3 and M4, when [C/Fe] is fixed and [O/Fe] is higher by 0.1 dex, the Teff is lower by about 20K. Thus, [O/Fe] is the dominant reason for the Teff difference. The Teff differences between M1 and M4, M5 and M8, and M9 and M12 are ∼70K, ∼80K, and ∼100K respectively, indicating that the Teff difference tends to become larger with higher mass. At the same mass (mass =
  ), the Teff differences between M13 and M16, M17 and M20, and M21 and M24 are ∼30K, ∼80K, and ∼120K respectively, which shows that the Teff difference is larger with smaller [Fe/H]. According to the Table 4, the Teff difference is generally larger than the observation error, especially for the metal-poor stars. Thus, the consideration of C and O enhancements is necessary.

Figure 6. (a): Stellar evolution tracks of fixed metallicity ([Fe/H] = −1) with different C and O enhancements. The mass range is 0.7  , 0.8
, 0.8  , and 0.9
  (from right to left). The black horizontal lines are markers of the age from 4 to 8 Gyr with 1 Gyr step. (b): Stellar evolution tracks of fixed mass (Mass = 0.8
  ) with different C and O enhancements. The [Fe/H] range is −0.5, −1.0, and −1.5 (from right to left). The red point represents the end of the main sequence.
Download figure:
Standard image High-resolution imageTable 4. Parameters of 24 Models at the End of the Main Sequence
| Model | Mass | [Fe/H] | [C/Fe] | [O/Fe] |

|

|
Age |
|---|---|---|---|---|---|---|---|
( ) ) |
(dex) | (dex) | (dex) | (K) | (dex) | (Gyr) | |
| M1 | 0.7 | −1.0 | 0.0 | 0.2 | 5848 | 4.33 | 19.0 |
| M2 | 0.7 | −1.0 | 0.2 | 0.5 | 5796 | 4.35 | 19.3 |
| M3 | 0.7 | −1.0 | 0.4 | 0.5 | 5799 | 4.36 | 19.1 |
| M4 | 0.7 | −1.0 | 0.4 | 0.6 | 5779 | 4.36 | 19.3 |
| M5 | 0.8 | −1.0 | 0.0 | 0.2 | 6127 | 4.26 | 11.6 |
| M6 | 0.8 | −1.0 | 0.2 | 0.5 | 6067 | 4.29 | 11.7 |
| M7 | 0.8 | −1.0 | 0.4 | 0.5 | 6070 | 4.29 | 11.6 |
| M8 | 0.8 | −1.0 | 0.4 | 0.6 | 6049 | 4.30 | 11.6 |
| M9 | 0.9 | −1.0 | 0.0 | 0.2 | 6386 | 4.21 | 7.39 |
| M10 | 0.9 | −1.0 | 0.2 | 0.5 | 6315 | 4.23 | 7.34 |
| M11 | 0.9 | −1.0 | 0.4 | 0.5 | 6314 | 4.23 | 7.26 |
| M12 | 0.9 | −1.0 | 0.4 | 0.6 | 6290 | 4.24 | 7.26 |
| M13 | 0.8 | −0.5 | 0.0 | 0.2 | 5713 | 4.32 | 15.2 |
| M14 | 0.8 | −0.5 | 0.2 | 0.5 | 5693 | 4.34 | 14.9 |
| M15 | 0.8 | −0.5 | 0.4 | 0.5 | 5693 | 4.34 | 14.7 |
| M16 | 0.8 | −0.5 | 0.4 | 0.6 | 5684 | 4.35 | 14.6 |
| M17 | 0.8 | −1.0 | 0.0 | 0.2 | 6127 | 4.26 | 11.6 |
| M18 | 0.8 | −1.0 | 0.2 | 0.5 | 6067 | 4.29 | 11.7 |
| M19 | 0.8 | −1.0 | 0.4 | 0.5 | 6070 | 4.29 | 11.6 |
| M20 | 0.8 | −1.0 | 0.4 | 0.6 | 6049 | 4.30 | 11.6 |
| M21 | 0.8 | −1.5 | 0.0 | 0.2 | 6431 | 4.21 | 10.4 |
| M22 | 0.8 | −1.5 | 0.2 | 0.5 | 6336 | 4.24 | 10.4 |
| M23 | 0.8 | −1.5 | 0.4 | 0.5 | 6328 | 4.24 | 10.4 |
| M24 | 0.8 | −1.5 | 0.4 | 0.6 | 6310 | 4.25 | 10.4 |
Download table as: ASCIITypeset image
3.3. Parameter Estimation
We adopted the method of Basu et al. (2010) and determined fundamental parameters in a Bayesian framework. In a Bayesian framework, the overall probability of the model Mi can be given by

where I is posterior probability, D is the observation properties for all the selected models,  represents the uniform prior probability for a specific model,
  is the likelihood function

and  is a normalization factor for the specific model probability:
where Nm is the total number of selected models. We adopt Teff,  , and [Fe/H] as observational constraints, and the Equation (1) can be simplified as follows:
The overall probability of model Mi can give all the fundamental parameters, and by constructing the marginal distribution for each parameter, we can obtain the uncertainties of the parameter. In Equation (4), the median value of each parameter is given with a probability P = 0.5, and we adopt a 1σ error for all the fundamental parameters (the low and high values of the parameter are P = 0.16 and P = 0.84, respectively).
4. Results
By determining the ages of 70 stars (mainly consists of halo stars) while considering C and O abundances, Ge et al. (2016) proposed that C and O abundances could influence the age determination of metal-poor α-enhanced stars. The primary goal of this work is to determine accurate ages of stars with models considering C and O enhancements individually, and then to study the chemical and kinematic properties of two different populations (high-α and low-α populations) in the Milky Way disk. We remove the stars with age error ranges larger than 4 Gyr. We find four stars with ages older than 15 Gyr, and remove them. These extremely old stars are discussed in a later section. We also include 18 thick disk stars from Ge et al. (2016). The final sample contains 137 stars.
Figure 7 shows the position of the stars on the Hertzsprung–Russell(HR) diagram. Our sample mainly consists of the turnoff stars with log  . The fundamental parameters of the sample stars are shown in Table 5.
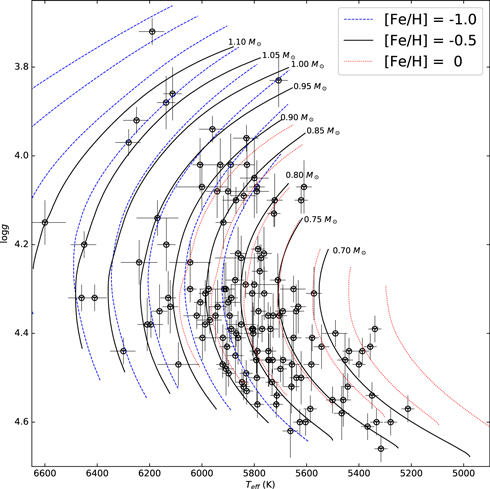
Figure 7. HR diagram (log g– ) of the total sample. The black circle represents the observational data. All the tracks are calculated from 0.70
  to 1.10
  with mass steps of 0.05
  (from right to left). Tracks with [Fe/H] = −0.5 are marked with their mass. The [Fe/H] ranges are −1.0 (blue dashed line), −0.5 (black solid line), and 0 (red dotted line).
Download figure:
Standard image High-resolution imageTable 5. Fundamental and Kinematic Parameters for the Whole Sample
| Star | Mass |

|

|
Distance |

|

|

|
|---|---|---|---|---|---|---|---|
| ID | ( ) ) |
(Gyr) | (Gyr) | (pc) | (km s−1) | (km s−1) | (km s−1) |
| HD 199476 |

|

|

|
30.9 | −87.7 | −61 | −8.72 |
| HD 45205 |

|

|

|
75.9 | −89 | −68.2 | 40.2 |

|

|

|

|

|

|

|

|
Only a portion of this table is shown here to demonstrate its form and content. A machine-readable version of the full table is available.
Download table as: DataTypeset image
Figure 8 shows our chemically selected high-α and low-α sequences in the [Fe/H]–[α/Fe] plane with the criterion from Adibekyan et al. (2012), resulting in a high-α sequences of 52 stars and a low-α sequence of 85 stars. Based on these two populations, we analyze their age distributions and relations between chemical parameters, kinematic parameters, and age.
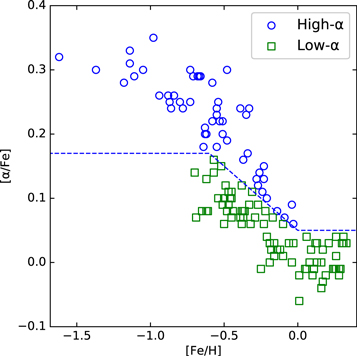
Figure 8.
 /Fe] as a function of metallicity: high-α sequence: blue open circle; low-α sequence: green open square. The dashed blue lines are empirical separation lines between low- and high-α sequences based on chemistry.
Download figure:
Standard image High-resolution image4.1. The Age Distribution
Figure 9 shows the age distribution of the two populations. The dashed curve is the nonparametric kernel density estimator to the age distribution. The stars of the low-α sequence have a peak at 5.47 Gyr; the high-α sequence has a peak at about 9.19 Gyr. We also find 6 young α rich stars (Y α R stars), their ages are younger than 5 Gyr with [α/Fe] higher than 0.15 dex. Previous works show that the age of the low-α sequence is around 2 Gyr (Silva Aguirre et al. 2018) or 3 Gyr (Buder et al. 2019). The difference between our results and these previous works for the low-α sequence may mainly be due to sample selection. To make the comparisons, we choose the sample from Buder et al. (2019), which contains 7066 dwarf, turnoff, and subgiant stars (hereafter, B18). We chemically select the low-α population from the B18 sample that contains 6184 low-α stars. Figure 10 shows the metallicity distribution function (MDF) for the low-α population. Figure 10(a) shows the MDF of our sample, and 10(b) shows the MDF of the B18 sample. For our sample, the mean [Fe/H] of the low-α population is −0.16; for B18 sample, the mean [Fe/H] of the low-α population is −0.04. It shows that the low-α stars in our sample are relatively more metal-poor, leading to an older age. For the high-α sequence, the age is similar to that of other works (e.g., Silva Aguirre et al. 2018).
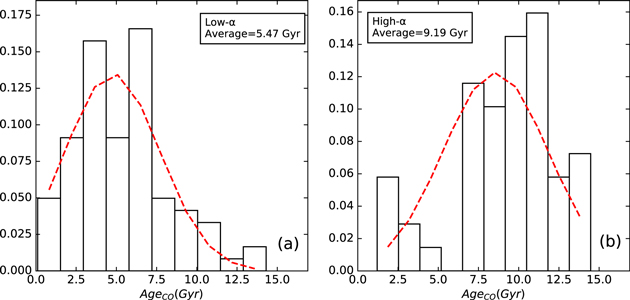
Figure 9. Age distributions for the low- and high-α disk components. The y-coordinate represents the kernel density for stellar age. The solid red lines delineate a nonparametric kernel density estimator for the age distribution profiles.
Download figure:
Standard image High-resolution image
Figure 10. (a): MDF for the low-α populations from our sample. (b): MDF for the low-α populations from B18 sample. The y-coordinate represents the kernel density for [Fe/H]. The solid red lines delineate a nonparametric kernel density estimator to the metallicity distribution profiles for our sample; the solid blue lines delineate a nonparametric kernel density estimator to the metallicity distribution profiles for B18 sample.
Download figure:
Standard image High-resolution imageFigure 11 shows a comparison between ages determined from the CO-extreme model and the traditional α-enhanced model of 64 stars with high C and O enhancement. As we mentioned, O enhancement is the dominant reason for the Teff difference, thus we divide these 64 stars into two groups (high-O and low-O groups) based on whether or not their [O/α] > 0.2 dex. Figure 11(a) shows the one-to-one line for age distribution. It shows an overall deviation from the one-to-one line ( ) in the high-O group, especially for stars older than 10 Gyr; for the low-O group, the age difference is unclear. Figure 11(b) shows the relation of age difference and [α/Fe]. An age difference for stars from the high-O group exists; ages of stars from the high-O group are overall about 1 Gyr younger than those from the traditional α-enhanced model. Stars with large age differences are generally highly α-enhanced, indicating that using the CO-extreme model or not significantly affects age determinations for high-α stars.
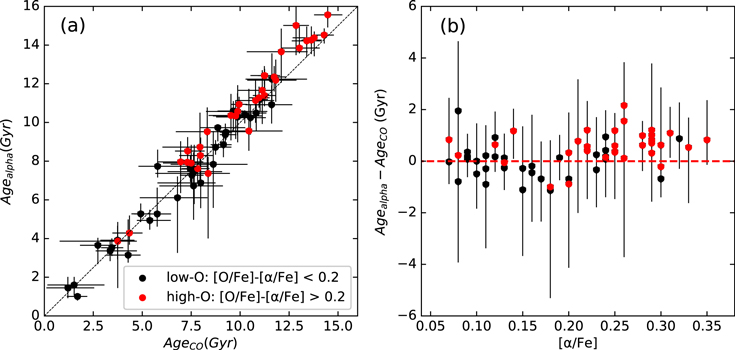
Figure 11. (a): One-to-one line for age distribution. The dashed black line shows the agonic line. (b): Age difference as a function of [α/Fe]. Black squares: stars with [O/α] < 0.2. Red points: stars with [O/α] > 0.2. The red dashed line shows the agonic line.
Download figure:
Standard image High-resolution imageFigure 12 shows the age difference as a function of [α/Fe] for different samples. The parameters of nine overlap stars used in the system correction do not span the full parameter range. To study the influence caused by offsets on the B16 sample, we compare results when applying the offsets and results without applying the offsets. The offsets are −0.127, −0.199, −0.102, −0.060, −0.050, −0.150, and −0.110 for [C/H], [O/H], [Fe/H], [Mg/H], [Si/H], [Ca/H], [Ti/H], respectively. Without applying the offsets, the mean age error of the B16 sample is  Gyr, and it changes to
  Gyr when applying the offsets. The mean age difference caused by the offsets is ∼1 Gyr, which is within the age error ranges. This indicates that these offsets have little influence on our results.
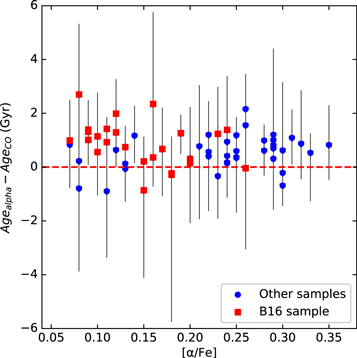
Figure 12. Age difference as a function of [α/Fe]. Red square: B16 sample. Blue points: other samples. The red dashed line shows the agonic line.
Download figure:
Standard image High-resolution image4.2. Chemical Evolution: Abundance versus Age
Figure 13 shows the relation between [α/Fe] and age. Figure 13(a) shows the results using the CO-extreme model. Most stars from the high-α sequence are around 6 to 14 Gyr, and the [α/Fe] has a huge range at any age. The transition between the low-α sequence and the high-α sequence occurs at about  , where an overlap appears between these two populations. Due to the abnormal behavior of YαR stars, we exclude them in this section and discuss them later. We also notice a number of stars older than 10 Gyr with [α/Fe]
  , confirming that old stars are not necessarily α-rich (Silva Aguirre et al. 2018). Figure 13(b) presents the results using the traditional α-enhanced models. The number of stars older than 12 Gyr increases compared to Figure 13(a).
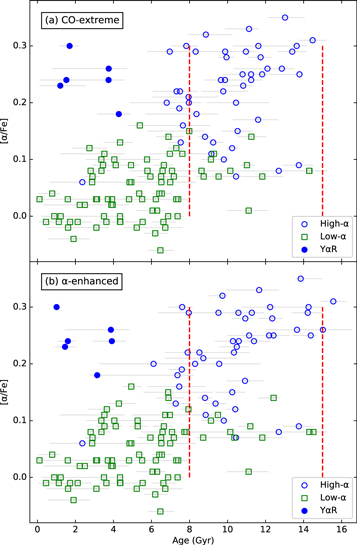
Figure 13. [α/Fe] as a function of age. High-α sequence: blue open circle; low-α sequence: green open square; Yα R stars (stars with [α/Fe] > 0.15 and age <5 Gyr): blue point. The red dashed lines represent the location at age = 8 Gyr (left line) and age = 15 Gyr (right line). (a): Result computed from the CO-extreme model. (b): Result computed from the α-enhanced model.
Download figure:
Standard image High-resolution imageFigure 14 shows the trend in the age–[α/Fe] relation. We illustrate the abundance bins for [α/Fe]. The stars are sorted by their [α/Fe] and then divided into 13 bins with each bin containing 10 stars (the 13th bin comprises 12 stars). Finally, we compute the mean age and [α/Fe] for each bin as well as their standard deviations. The bin with [α/Fe] ∼ 0.12 occurs at ∼7.5 Gyr, where these two populations overlap. Bins with [α/Fe] < 0.12 are mainly composed of low-α stars, and bins with [α/Fe]  0.12 mainly consist of high-α stars. Thus, we perform linear fittings for bins with [α/Fe] < 0.12 (low-α bins) and bins with [α/Fe]
  0.12 (high-α bins), respectively. The specific formulas are
As Figure 14 shows, for low-α bins, the slope of the linear fitting changes from 0.0151 ± 0.0059 to 0.0152 ± 0.0060, indicating that the result of α-enhanced models is nearly the same as that of CO-extreme models; for high-α bins, the upward trend of the [α/Fe]–age relation for the CO-extreme model tends to be steeper than that for the traditional α-enhanced model, since the slope of the linear fitting changes from 0.0339 ± 0.0075 to 0.0436 ± 0.0086. As we mentioned above, a higher [O/α] contributes to a larger age difference (this is mainly the case for the last two bins). The last two bins lead to steeper trends for the [α/Fe]–age relation in the high-α sequence, which probably indicates a higher formation rate for the high-α sequence (as seen for the thick disk) and faster chemical enhanced history. The uncertainty of the linear fit is non-negligible. It shows that the upward trend for [α/Fe] and age in the CO-extreme model might be more flat than that for the traditional α-enhanced model. However, our number of sample stars is limited. We believe the uncertainty would be smaller if we had more data (more age bins).

Figure 14. [α/Fe] as a function of age. The points indicate the mean age and the mean [α/Fe] of the bin. The error bars indicate the standard deviation of each bin. (a): Result computed by the CO-extreme model (red circle). (b): Result computed by the α-enhanced model (blue square). Red solid line: linear fit for the CO-extreme results. Blue solid line: linear fit for the α-enhanced results. The red dashed lines represent the margin of error of the linear fit for the CO-extreme results. The blue dashed lines represent the margin of error of the linear fit for the α-enhanced results. The Y αR stars (stars with [α/Fe] > 0.15 and age <5 Gyr) are removed.
Download figure:
Standard image High-resolution imageFigure 15 shows the relations between age and different elemental abundances. Figure 15(a) shows the age–metallicity relation. There is a faint decline in the age–[Fe/H] relation, especially for the high-α sequence. The trend of [Fe/H] versus age is predominantly flat before 8 Gyr, which is occupied by the low-α sequence. After 8 Gyr, the decline is more clear in the high-α sequence. The flat trend of the low-α sequence is also shown in many other works (Feltzing et al. 2001; Casagrande et al. 2011; Haywood et al. 2013; Bensby et al. 2014; Silva Aguirre et al. 2018); the decline in the high-α sequence is also previously reported (Haywood et al. 2013; Bensby et al. 2014; Bergemann et al. 2014). However, some works have suggested there is no obvious age–[Fe/H] relation at all ages (Casagrande et al. 2011; Silva Aguirre et al. 2018). The absence of this relation may be caused by dynamic processes such as radial migration (Sellwood & Binney 2002).
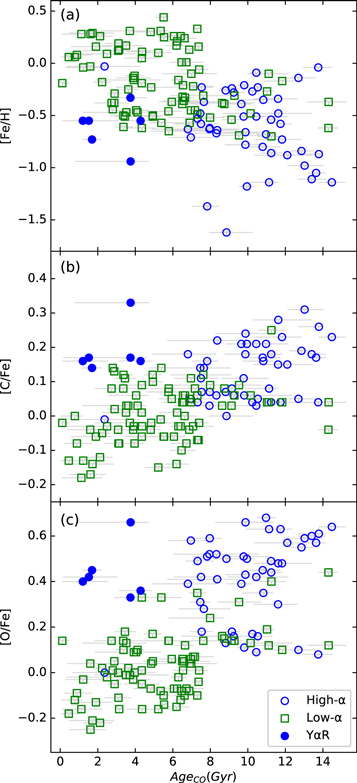
Figure 15. [Fe/H], [C/Fe], and [O/Fe] as a function of age. The symbols are the same as those in Figure 13.
Download figure:
Standard image High-resolution imageFigure 15(b) shows [C/Fe] as a function of age. There is no clear transition between the low-α population and high-α population. There is considerable scatter in [C/Fe] at any age. The lack of a tight relation is due to multiple sources of C production (Type II SNe, Wolf–Rayet stars, intermediate-mass and low-mass stars in the planetary nebula phase, and stars at the end of the giant phase, as mentioned in Nissen 2013).
Figure 15(c) shows the relation between [O/Fe] and age. Unlike the complex origin of C, O seems to be produced exclusively by α-capture on C in short-lived massive stars (Nissen 2013). Our previous work shows that there is a tight relation between age and [O/Fe] halo stars (Ge et al. 2016). In this work, we find no obvious relation of age-[O/Fe] in disk stars. This is because the formation histories for the halo and disk are quite different.
4.3. Kinematic Evolution: Spatial Velocity versus Age
We analyze the kinematic properties of our sample in the Gaia DR2 database (Gaia Collaboration et al. 2018). We calculate the space velocity components (U, V, W) with the available proper motion and radial velocity, and the distances estimated by Bailer-Jones et al. (2018). The space velocity components are derived with respect to the local standard of rest, adopting the standard solar motion (U, V, W) = (−8.5, 13.38, 6.49) (km s−1) (Coskunoǧlu et al. 2011). We also remove stars with age errors larger than 4 Gyr, and leave 116 stars (39 high-α stars; 77 low-α stars). All the kinematic properties of our sample are listed in Table 5.
Figure 16 shows the distribution of our chemically selected high-α and low-α populations in kinematic space. The results of kinematic separation are consistent with the results of chemical separation as found in other works (Adibekyan et al. 2012; Bensby et al. 2014). Most of the stars of the low-α populations show solar-like motion because their U, V, and W are similar to the local standard of rest.
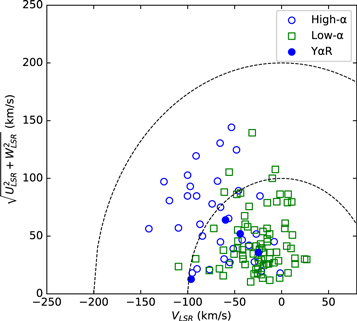
Figure 16. Toomre diagram for the entire sample. The dashed lines show the kinematic separation. The symbols are the same as those in Figure 13.
Download figure:
Standard image High-resolution imageFigure 17 shows the relation between [Fe/H] and VLSR. There are different trends for the two sequences. We perform a polynomial fit for both the low-α sequence and the high-α sequence. The specific formulae of the polynomial fits are
The VLSR increases with [Fe/H] in the high-α sequence and shows a flatter trend in the low-α sequence. This trend is also shown in other works (e.g., Adibekyan et al. 2013; Haywood et al. 2013).

Figure 17. [Fe/H] as a function of the V component of velocity. The symbols are the same as those in Figure 14. Red dashed line: the result of a polynomial fit for two different populations.
Download figure:
Standard image High-resolution imageFigure 18 shows relations between VLSR, the scatter of VLSR, and age. Figure 18(a) shows that VLSR values decrease with age. The specific formula of the polynomial fit is
The trend is that old stars (mainly consisting of high-α stars) tend to rotate slower than younger stars with low α enhancement. Figure 18(b) shows the relation of age and the scatter of VLSR. We divide the sample into seven bins according to the stellar ages (from young to old with a step of 2 Gyr). For each bin, we calculate the standard deviation of the VLSR ( ) and perform the polynomial fit:

The  values increase with stellar ages in the disk, which is also consistent with previous works (e.g., Almeida-Fernandes & Rocha-Pinto 2018).
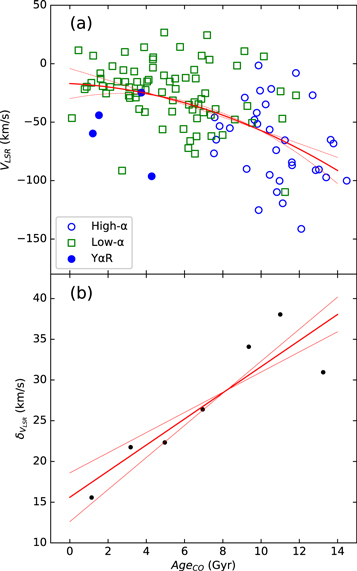
Figure 18. (a): LSR components of the velocity as a function of age for the chemically dissected populations. The symbols are the same as those in Figure 13. (b): Scatter of VLSR versus age. Black point: Age bins of stars. Red dashed line: Results of the polynomial fit.
Download figure:
Standard image High-resolution image4.4. Abnormal Stars
We find six stars with [α/Fe] > 0.15 and age <5 Gyr, which are regarded as YαR stars (Martig et al. 2015; Chiappini et al. 2015; Matsuno et al. 2018; Silva Aguirre et al. 2018). We analyze 4 of them chemically and kinematically. All the Y α R stars have high C enhancement (>0.15) and O enhancement (>0.3). Most Yα R stars have [O/α] < 0.2, which indicates that the ages of these stars may not be significantly affected by the C and O abundances. The Yα R stars have chemical properties similar to those of other high-α stars, and their kinematic properties are more thin disk-like, especially for the distribution of space velocity. The parameters of these Y α R stars are listed in Table 6. We find 11 extremely old stars, which are also presented in Table 6. Seven of them have large age error ranges (age error range >4 Gyr), and six have [O/α] > 0.2. All of these extremely old stars have low masses (<0.8  ). We have checked that these extremely old stars do not group up in any particular part of parameter space. The reason why these stars have ages older than the universe is not clear. These abnormal stars might reflect the complex formation history of the galaxy. We need more samples to study their possible origin and properties.
Table 6. Chemical and Kinematic Properties of the Abnormal Stars
| Star |
![$[\mathrm{Fe}/{\rm{H}}]$](https://content.cld.iop.org/journals/0004-637X/889/2/157/revision1/apjab66c7ieqn90.gif)
|
![$[{\rm{C}}/\mathrm{Fe}]$](https://content.cld.iop.org/journals/0004-637X/889/2/157/revision1/apjab66c7ieqn91.gif)
|
![$[{\rm{O}}/\mathrm{Fe}]$](https://content.cld.iop.org/journals/0004-637X/889/2/157/revision1/apjab66c7ieqn92.gif)
|
![$[\alpha /\mathrm{Fe}]$](https://content.cld.iop.org/journals/0004-637X/889/2/157/revision1/apjab66c7ieqn93.gif)
|
![$[{\rm{O}}/\alpha ]$](https://content.cld.iop.org/journals/0004-637X/889/2/157/revision1/apjab66c7ieqn94.gif)
|
Mass | Age | Distance | U | V | W |
|---|---|---|---|---|---|---|---|---|---|---|---|
| sample name | (dex) | (dex) | (dex) | (dex) | (dex) | ( ) ) |
(Gyr) | (pc) | (km s−1) | (km s−1) | (km s−1) |
| HD 16623 | −0.55 | 0.16 | 0.36 | 0.18 | 0.18 |

|

|
69 | 13 | −96 | 1.9 |
| HD 37124 | −0.55 | 0.17 | 0.42 | 0.24 | 0.18 |

|

|
32 | 32 | −44 | −41 |
| HD 65907 | −0.33 | 0.17 | 0.33 | 0.24 | 0.09 |

|

|
16 | 12 | −25 | 34 |
| HD 68017 | −0.55 | 0.16 | 0.40 | 0.23 | 0.17 |

|

|
22 | −49 | −60 | −41 |
| GJ53 | −0.94 | 0.33 | 0.66 | 0.26 | 0.40 |

|

|
... | ... | ... | ... |
| HD 106516 | −0.73 | 0.14 | 0.45 | 0.30 | 0.15 |

|

|
... | ... | ... | ... |
| HD 80367 | −0.07 | 0.11 | 0.12 | 0.07 | 0.05 |

|

|
29 | −32 | −47 | 7.0 |
| HTR376−001 | −0.05 | 0.07 | 0.05 | 0.09 | −0.04 |

|

|
... | ... | ... | ... |
| HD 126681 | −1.20 | 0.22 | 0.70 | 0.35 | 0.35 |

|

|
56 | −21 | −52 | −79 |
| HD 205650 | −1.19 | 0.25 | 0.65 | 0.30 | 0.35 |

|

|
60 | −127 | −90 | 7.4 |
| HD 216259 | −0.77 | 0.35 | 0.47 | 0.21 | 0.26 |

|

|
23 | −48 | 1.5 | −6.6 |
| HIP74346 | −0.02 | 0.13 | 0.13 | 0.06 | 0.07 |

|

|
52 | −46 | −50 | −48 |
| HD 37008 | −0.53 | 0.34 | 0.48 | 0.20 | 0.28 |

|

|
21 | 48 | 21 | −48 |
| HD 24238 | −0.56 | 0.40 | 0.54 | 0.21 | 0.33 |

|

|
21 | −60 | −17 | 13 |
| HIP91605 | −0.43 | 0.12 | 0.09 | 0.07 | 0.02 |

|

|
24 | 93 | −6.5 | −36 |
| HD 4628 | −0.35 | 0.09 | 0.09 | 0.07 | 0.02 |

|

|
7.4 | −1.0 | −48 | −13 |
| HIP94931 | −0.6 | 0.30 | 0.48 | 0.23 | 0.25 |

|

|
36 | 58 | −127 | −87 |
Download table as: ASCIITypeset image
5. Conclusions
C and O enhancements (especially O enhancement) can influence the evolution tracks, resulting in lower turnoff Teff. The difference between tracks with and without C and O enhancement increases with lower [Fe/H]. Thus, for metal-poor stars, the consideration of C and O enhancements is necessary. In this work, we determine more reasonable ages for 148 dwarf stars by considering C and O enhancements, and analyze the chemical and kinematic properties of these stars. Our sample stars come from Zhao et al. (2016), Brewer & Fischer (2016), Adibekyan et al. (2012), and Nissen et al. (2014) with a wide range of [Fe/H] (−1.62 ∼ 0.44 dex) and ages from 0.1 Gyr to 14.5 Gyr. Our conclusions are summarized as follows:
- 1.C and O enhancements influence the age determination for high-α stars. Particularly, for stars with [O/α] > 0.2, the ages are overall ∼1 Gyr younger compared to the results for the α-enhanced model.
- 2.For the high-α sequence, C and O enhancements change the slope of the [α/Fe]–age relation from 0.0339 ± 0.0075 to 0.0436 ± 0.0086, indicating a higher formation rate for the high-α sequence (thick disk). For the low-α sequence, the slope of the linear fitting changes from 0.0151 ± 0.0059 to 0.0152 ± 0.0060, indicating that C and O enhancements have little effect on the low-α sequence.
- 3.The scatter of [Fe/H] is large at any age, and there is a faint decline in the age–[Fe/H] relation. The [C/Fe]-age relation shows large scatter at any age due to the complex origins of C. The [O/Fe]-age relation in the halo stars presented by our previous work (Ge et al. 2016) could not be found in disk stars of this work. This is because the formation histories of these two populations are different.
- 4.Our chemically selected low- and high-α stars are well separated in kinematic space. The VLSR increases with [Fe/H] in the high-α sequence, while it shows a flat trend in the low-α sequence. The high-α population tends to rotate slower than the stars of the low-α population. There is an increase in at all ages.
- 5.The Y α R stars have [α/Fe] > 0.15 with age <5 Gyr. Most of them have [O/α] < 0.2, indicating that the ages of these stars may not be significantly affected by the C and O abundances. Their chemical properties are thick disk-like and their kinematic properties are thin disk-like.

This work is supported by the Joint Research Fund in Astronomy (U1631236) under cooperative agreement between the National Natural Science Foundation of China (NSFC) and Chinese Academy of Sciences (CAS), and the National Natural Science Foundation of China under grants No. 11625313 and 11573035. This work is also supported by the NSFC 11273007, 10933002, and 11773005.