


Abstract
The nearby SN 1987A offers a spatially resolved view of the evolution of a young supernova (SN) remnant. Here we present recent Hubble Space Telescope imaging observations of SN 1987A, which we use to study the evolution of the ejecta, the circumstellar equatorial ring (ER), and the increasing emission from material outside the ER. We find that the inner ejecta have been brightening at a gradually slower rate and that the western side has been brighter than the eastern side since ∼7000 days. This is expected given that the X-rays from the ER are most likely powering the ejecta emission. At the same time, the optical emission from the ER continues to fade linearly with time. The ER is expanding at 680 ± 50 km s−1, which reflects the typical velocity of transmitted shocks in the dense hot spots. A dozen spots and a rim of diffuse Hα emission have appeared outside the ER since 9500 days. The new spots are more than an order of magnitude fainter than the spots in the ER and also fade faster. We show that the spots and diffuse emission outside the ER may be explained by fast ejecta interacting with high-latitude material that extends from the ER toward the outer rings. Further observations of this emission will make it possible to determine the detailed geometry of the high-latitude material and provide insight into the formation of the rings and the mass-loss history of the progenitor.
1. Introduction
SN 1987A in the Large Magellanic Cloud (LMC) was discovered on 1987 February 23. It was a naked-eye object and the closest SN since Kepler's SN in 1604 (see McCray 1993 and McCray & Fransson 2016 for reviews). The Hubble Space Telescope (HST) was launched a few years after this historic event, making it possible to follow the evolution from SN to SN remnant with excellent spatial resolution. The HST images offer a resolved view of the ejecta, which are expanding into a circumstellar triple-ring nebula.
The three rings of the nebula are nearly circular with inclinations in the range ∼38–45° (Crotts & Heathcote 2000; Tziamtzis et al. 2011). The inner, equatorial ring (ER) has a radius of ∼0.6 lt-yr, while the two outer rings (ORs) are ∼2.2 times bigger. The expansion velocities of the rings suggest that they all formed around the same time, ∼20,000 yr before the explosion (Crotts & Heathcote 2000). Many scenarios have been proposed to explain the origin of the rings, including interaction of winds from different evolutionary stages of the progenitor star (Wang & Mazzali 1992; Blondin & Lundqvist 1993; Martin & Arnett 1995), a binary merger (Morris & Podsiadlowski 2007, 2009), bipolar outflows/jets (Akashi et al. 2015), and the remains of a protostellar disk (McCray & Lin 1994). Photoionization of the wind medium and/or photoevaporation of the ER by the radiation from the progenitor may also have been important in shaping the nebula (Chevalier & Dwarkadas 1995; Smith et al. 2013). The latter was suggested as an explanation for the blue supergiant (BSG) SBW1, which has a ring system that resembles SN 1987A (Smith et al. 2013). Similar ring systems have also been observed around the BSGs Sher 25 (Brandner et al. 1997) and HD 168625 (Smith 2007).
Understanding the formation of the rings is connected to understanding the progenitor. In the case of SN 1987A, the progenitor was a B3 Ia BSG (Walborn et al. 1987; West et al. 1987). Mass estimates assuming a single-star progenitor are in the range ∼15−20 M⊙ (Woosley et al. 1988; Fransson & Kozma 2002; Smartt et al. 2009; Pumo & Zampieri 2011; Orlando et al. 2015; Utrobin et al. 2019), although Utrobin et al. (2019) notes that there is no model that satisfies all observational constraints. Binary merger models suggest a somewhat larger mass (Menon & Heger 2017). The progenitor makes SN 1987A different from the majority of type II SNe, which originate from red supergiants (Smartt et al. 2009). Specifically, the relatively compact nature of the BSG progenitor resulted in a 56Ni-dominated peak in the light curve rather than a plateau. A number of other SN 1987A-like events have been observed and the rate has been estimated to 1%–3% of the core collapse rate (Pastorello et al.2012; Taddia et al. 2016). There is observational evidence that these SNe preferentially occur in low-metallicity environments (Pastorello et al. 2012; Taddia et al. 2013), which may explain explosions in the BSG stage (Arnett et al. 1989). Alternatively, the BSG progenitor of SN 1987A may be explained by a binary merger (e.g., Podsiadlowski et al. 1990, 1992; Menon & Heger 2017). Further insights into the explosion would be obtained from the properties of the compact object, but this has not been detected subsequent to the original neutrino emission (Alp et al. 2018).
The ring system was initially ionized by the SN flash and then faded with time as the gas recombined and cooled (Fransson et al. 1989; Lundqvist & Fransson 1996; Mattila et al. 2010). After ∼3000 days, the ejecta reached the ER, resulting in the appearance of optical "hot spots" (Sonneborn et al. 1998; Lawrence et al. 2000). Prior to this, radio and X-ray observations had revealed emission originating from the interaction between the ejecta and a low-density (∼102 cm−3) H ii region inside the ER (Staveley-Smith et al. 1992; Chevalier & Dwarkadas 1995; Hasinger et al. 1996). Subsequent multiwavelength monitoring showed that the interaction with the ER gave rise to rapidly increasing emission across the entire electromagnetic spectrum for many years (e.g., Gröningsson et al. 2008a; Ng et al. 2008; Maggi et al. 2012). The optical emission finally peaked after 8000 days and has since been fading, signaling that the blast wave has left the ER and that the clumps are being destroyed by the shocks (Fransson et al. 2015). This evolution has been accompanied by the appearance of faint spots outside the ER in the HST images after 9500 days. Observations at other wavelengths have also revealed transitions in the evolution of the ER, including fading in the IR (Arendt et al. 2016), a flattening of soft X-rays (Frank et al. 2016) and a re-acceleration of the blast wave in radio (Cendes et al. 2018). All these observations show that the remnant of SN 1987A has entered a new phase. Hydrodynamic simulations of the ring collision are also broadly consistent with this picture (Orlando et al. 2015).
The ejecta inside the ER are expanding freely, but are nevertheless being affected by the shock interaction in the sense that the X-ray emission from the ER serves as an important energy source. This started dominating over the 44Ti decay after ∼5000 days, leading to a brightening of the optical emission from the ejecta (Larsson et al. 2011). Most of the X-rays are expected to be absorbed in the outer parts of the freely expanding ejecta, which leads to an edge-brightened morphology (Fransson et al. 2013; Larsson et al.2013). By contrast, the 44Ti decay still dominates the energy input to the innermost ejecta, as evidenced by the constant flux of the 1.644 μm [Fe i]+[Si ii] line (Larsson et al. 2016). The fact that molecules and dust are observed in the inner ejecta also shows that these regions are not significantly affected by the X-rays (Matsuura et al. 2015; Fransson et al. 2016; Abellán et al. 2017; Cigan et al. 2019; Larsson et al. 2019). The 3D emissivities of a number of atomic and molecular emission lines from the ejecta have been determined using a combination of imaging and spectra, revealing a highly asymmetric distribution (Kjær et al. 2010; Larsson et al. 2013, 2016; Abellán et al. 2017; Larsson et al. 2019). Several different early observations also provided strong evidence for an asymmetric explosion, including polarimetry (Schwarz 1987; Jeffery 1991), the "mystery spots" (Meikle et al. 1987; Nisenson et al. 1987; Nisenson & Papaliolios 1999), and the "Bochum event" (Hanuschik & Thimm 1990).
In this paper, we present the recent evolution of SN 1987A as observed by HST, focusing on the time period between 10,300 and 11,500 days (years 2015–2018). This extends the decaying part of the light curve of the ER compared to the data in Fransson et al. (2015) and reveals new details about the structure of the circumstellar medium outside the ER. After describing the observations in Section 2, we give an overview of the optical emission components in Section 3, show images in Section 4, and present light curves for the ER and ejecta in Section 5. We then analyze the expansion of the ER and the properties of the new spots outside the ER in Sections 6 and 7, respectively. We finally discuss the results in Section 8 and summarize our conclusions in Section 9. Throughout this paper, we assume a distance to the LMC of 49.6 kpc (Pietrzyński et al. 2019). All uncertainties are quoted at 1σ.
2. Observations and Data Reduction
The details of the HST observations of SN 1987A analyzed in this paper are provided in Tables 1 and 2. Table 1 contains all observations in the F502N filter between 1994 and 2018, while Table 2 lists WFC3 observations since 2015, including F438W (B band), F625W (R band), F645N, and F657N. In addition, we use all previous observations in the R band (WFPC2/F675W, ACS/F625W, WFC3/F625W) and B band (WFPC2/F439W, ACS/F435W, WFC3/F438W), as well as a WFC3/F657N image from 2011 and a WFC3/F645N image from 2014. These observations have been discussed in Larsson et al. (2011), Fransson et al. (2015) and France et al. (2015).
Table 1. HST Observations in the F502N Filter
| Date | Epocha | Instrument | Exposure Time |
|---|---|---|---|
| (YYYY mm dd) | (days) | (s) | |
| 1994 Feb 3 | 2537 | WFPC2 | 5600 |
| 1996 Feb 6 | 3270 | WFPC2 | 7800 |
| 1997 Jul 12 | 3792 | WFPC2 | 8200 |
| 2000 Jun 16 | 4862 | WFPC2 | 3600 |
| 2000 Nov 14 | 5013 | WFPC2 | 5600 |
| 2001 Dec 7 | 5401 | WFPC2 | 4800 |
| 2003 Jan 5 | 5795 | ACS | 7000 |
| 2003 Nov 28 | 6122 | ACS | 4000 |
| 2004 Dec 15 | 6505 | ACS | 3600 |
| 2005 Nov 18 | 6843 | ACS | 4240 |
| 2006 Dec 8 | 7228 | ACS | 2600 |
| 2009 Dec 12 | 8328 | WFC3 | 3100 |
| 2014 Jun 20 | 9979 | WFC3 | 5880 |
| 2016 Jun 8 | 10,698 | WFC3 | 2400 |
| 2017 Aug 3 | 11,119 | WFC3 | 3300 |
| 2018 Jul 10 | 11,460 | WFC3 | 5760 |
Note.
aDays since explosion on 1987 February 23.Download table as: ASCIITypeset image
Table 2. HST/WFC3 Observations since 2015
| Date | Epocha | Filter | Exposure Time |
|---|---|---|---|
| (YYYY mm dd) | (days) | (s) | |
| 2015 May 24 | 10,317 | F438W | 1200 |
| F625W | 1200 | ||
| 2016 Jun 8 | 10,698 | F438W | 600 |
| F625W | 600 | ||
| F645N | 2400 | ||
| F657N | 2400 | ||
| 2017 Aug 3 | 11,119 | F438W | 1400 |
| F625W | 1200 | ||
| F657N | 2800 | ||
| 2018 Jul 8 | 11,458 | F438W | 1200 |
| F625W | 1200 | ||
| 2018 Jul 10 | 11,460 | F657N | 2880 |
Note. The observations in the F502N filter are listed in Table 1.
aDays since explosion on 1987 February 23.Download table as: ASCIITypeset image
All observations since the year 2000 are based on dithered exposures, where offsets involving half-integer pixels are used to improve the sampling. This leads to an improved spatial resolution when the images from different exposures are combined. We combined the images using DrizzlePac,13
which also removes cosmic rays and applies distortion corrections (Gonzaga et al. 2012). All the images were drizzled to a pixel scale of 0 025 and aligned using the positions of stars located around SN 1987A.
The comparison of fluxes from SN 1987A at different epochs is affected by the fact that the observations have been performed with three different instruments (WFPC2, ACS, and WFC3), for which the relevant filters differ somewhat in terms of wavelength coverage and throughput. To quantify this effect, we convolve the spectra of the ER and the ejecta with the response functions of the different instrument/filter combinations and compare the resulting fluxes. We use the spectra from Fransson et al. (2013) and Larsson et al. (2013), and calculate the fluxes with STSDAS SYNPHOT.14 From the results, we determine the correction factors in Table 3, which are normalized with respect to the WFPC2 filters. All light curves presented below have been corrected by these factors. The largest corrections apply to the ACS B band, which is significantly wider than the corresponding B-band filters used with WFPC2 and WFC3. There is a small uncertainty in the correction factors due to the moderate time evolution of the spectrum of SN 1987A. We investigated this using spectra from a selection of epochs relevant for the different instruments (obtained from Gröningsson et al. 2008a; Fransson et al. 2013, and K. Migotto et al. 2019, in preparation). This showed that that the spectral evolution affects the correction factors by ≲1%, with the exception of the ACS B band, where the maximal difference between epochs was 4%.
Table 3. Filter Flux Ratios
| Instrument | B banda | R bandb | F502N | ||
|---|---|---|---|---|---|
| ER | Ejecta | ER | Ejecta | ER | |
| ACS | 1.38 | 1.26 | 1.06 | 1.05 | 0.87 |
| WFC3 | 1.00 | 1.07 | 1.13 | 1.13 | 0.82 |
Notes. Flux ratios relative to the corresponding filters used with WFPC2. All light curves have been corrected by these factors and hence normalized to the bandpass of the WFPC2 filters.
aWFPC2/F439W, ACS/F435W, WFC3/F438W. bWFPC2/F675W, ACS/F625W, WFC3/F625W.Download table as: ASCIITypeset image
A small number of the observations are significantly affected by the degradation of the charge transfer efficiency (CTE), which means that trapping of charges during CCD readout results in lower fluxes being measured. In the case of our measurements, this primarily affects the three WFPC2 observations between 7400 and 8100 days. This is the time after the ACS had failed, but before WFC3 was commissioned. Correction formulas for CTE losses exist for isolated point sources, but these are not appropriate for SN 1987A, which consists of a combination of diffuse emission and closely spaced point sources. Instead, we simply apply empirical corrections to the light curves, as described in Section 5. We note that the precise fluxes in these previous observations do not affect our conclusions.
3. Optical Emission from SN 1987A
The optical flux from SN 1987A is primarily due to emission lines (see, e.g., Pun et al. 2002; Michael et al. 2003; Fransson et al. 2013; Larsson et al. 2013). In Table 4, we list the strongest lines from the ER and ejecta that contribute to the broad and narrow filters analyzed in this paper. We note that the R band and F657N are strongly dominated by Hα, and that the emission from the ER in the F502N filter is dominated by [O iii] λ5007. The F645N filter includes blueshifted Hα emission as well as a weak continuum due to H I and He i two-photon and free-bound emission from the ER.
Table 4. Strongest Emission Lines from the ER and Ejecta Affecting the Different Filters
| Filter | Main Lines from the Ejectaa | Main Lines from the ER |
|---|---|---|
| F438W | Ca i λ4228, Fe i lines, Mg i] λ4571 | [S ii] λ4069, Hδ, Hγ, [Fe ii] lines |
| F502N | Fe i λ5007 [−2400, +2300] km s−1 | *[O iii] λ5007, He i λ5016 |
| F625W | Na i λλ5890,5896, [O i] λλ6300,6364, | [N ii] λ5755, He i λ5876, [O i] λλ6300,6364, |
| *Hα | *Hα, [N ii] λλ6548,6583 | |
| F645N | *Hα [−7900, −2700] km s−1 | Continuum |
| F657N | *Hα [−3500, +3600] km s−1 | *Hα, [N ii] λλ6548,6583 |
Note. Lines that dominate the emission in a filter are indicated by *.
aFor each of the narrow filters, we provide the velocity range of the strongest line included in the filter at the systematic velocity of SN 1987A (287 km s−1, Gröningsson et al. 2008a). The limits correspond to 10% of the peak transmission.Download table as: ASCIITypeset image
In order to illustrate all the different emission sites in the remnant, we show the most recent image in the F657N filter in Figure 1. This shows the triple-ring nebula, where the ER is significantly brighter than the ORs due to the interaction with the ejecta. A schematic 3D view of the ring system is provided in Figure 2. The northern OR (NOR) is on the far side of the ER and the southern OR (SOR) on the near side with respect to the observer. There may also be material connecting the ER with the ORs as illustrated by the dashed lines in Figure 2. The details of the geometry of the ring system will be discussed in Section 8.2. The two bright stars located to the northwest and southeast of the SN are usually referred to as Star 2 and Star 3, respectively (Walborn et al. 1987, labeled in Figure 1).

Figure 1. WFC3/F657N image from 11,500 days (2018) showing the triple-ring system around SN 1987A. The image scale is logarithmic in order to highlight the ORs and the faint emission outside the ER. The field of view (FOV) is 55 × 59.
Download figure:
Standard image High-resolution image
Figure 2. A 3D view of the ring system surrounding SN 1987A. The ER is shown in gray, the NOR in red, and the SOR in blue. The dashed lines represent hypothetical material connecting the ER and ORs. The gray sphere and line show the position of the observer and the line of sight, respectively.
Download figure:
Standard image High-resolution imageThe bright asymmetric structure seen inside the ER in Figure 1 is the freely expanding inner ejecta. The outer parts of the ejecta are interacting with a reverse shock (RS), which gives rise to diffuse emission that extends from the inner edge of the ER to higher latitudes above and below its plane. The RS is probably the main origin of the arc of emission seen just inside the western side of the ER, although scattered light from the ER is also expected to contribute. The ER itself is composed of individual hot spots, as seen in Figures 3 and 4 below. There are also a number of faint spots located outside the ER to the southeast. In this paper, we will show that the spots and diffuse emission outside the ER likely originate in material that extends from the ER toward the ORs.
Figure 3. Selection of images showing the evolution of SN 1987A in the R band. A mask which reduces the brightness of the ER by a factor of 14 has been applied to the images (shown by the dotted lines in the top left panel). The color map scales linearly with the surface brightness both inside and outside the mask. The spot at five o'clock that can be seen in the ER already in the first observation is a star. The emission in the lower left corners is due to Star 3 (see Figure 1). North is up and east is left. The FOV is . An animation of the R band evolution is available as an animated figure in the online Journal. The animation proceeds from 2770 to 11,458 days after the explosion, covering all the observations between 1994 and 2018.

(An animation of this figure is available.)
Download figure:
Video Standard image High-resolution imageThe inner ejecta emit lines with typical FWHM ∼2500 km s−1. Spectra of the ER contain three emission components: a very broad component extending to ∼10,000 km s−1 from the RS, lines of intermediate width (FWHM ∼ 200–450 km s−1) from the shocked gas in the hot spots, and narrow lines (FWHM ∼ 10–30kms−1) from the unshocked, photoionized gas (Gröningsson et al. 2008a; Fransson et al. 2013). The latter have been fading from very early times and have almost disappeared at current epochs (K. Migotto et al. 2019, in preparation). The analysis presented below will focus on the evolution of the ejecta, the ER and the new emission outside the ER. The evolution of the ORs has been studied in Tziamtzis et al. (2011).
4. Images
Figures 3 and 4 show a selection of images in the R and B bands, respectively, illustrating the evolution of the remnant between 2800 and 11,500 days (1994 and 2018). A mask that reduces the brightness of the ER by a factor of 14 has been applied to the images, which makes it possible to simultaneously display the morphology of the ER and ejecta. The boundaries of the mask (plotted in the first panel of Figure 3) were smoothed with a Gaussian function. The images show a strong evolution in brightness and morphology of both the ER and the ejecta. The most recent evolution is illustrated in Figure 5, where we show difference images in the R band for all pairs of consecutive observations since 8700 days (2011). The first of these difference images (where the second observation is from 9500 days in 2013) shows the first evidence of faint spots outside the ER. This is followed by the appearance of additional spots and diffuse emission outside the ER. At the same time, the main ER is fading, with the exception of the outer part of the western side. Difference images in the B band show the same trends but with lower signal-to-noise ratio (S/N).
Download figure:
Video Standard image High-resolution image
Figure 5. WFC3/F625W differences images. All images except the first one are separated by one year. The spots marked by white crosses to the northwest of the ER are ghost reflections. There are also diffraction spikes and other residuals from Stars 2 and 3 in the northwest and southeast corners, respectively (see Figure 1). We provide flux measurements for the six labeled spots outside the ER in Section 7. The numbering of the spots is done counterclockwise from north. The unit for the color bar is counts s−1 per 0025 pixel. The FOV is 25 × 19.
Download figure:
Standard image High-resolution imageFigure 6 illustrates the evolution in the narrow F657N and F502N filters since 10,700 days in 2016 (previous narrowband images are shown in Fransson et al. 2015 and France et al. 2015). These filters include all the emission from the ER, but the highest ejecta velocities and a significant part of the RS emission are excluded (see Section 3 and Table 4). The evolution in F657N is similar to that observed in the R and B bands, with the main difference being that the diffuse emission outside the ER is even more prominent in F657N. This is seen most clearly in the left and middle panels of Figure 7, which show difference images in this filter between the epochs 10,700–8700 days (2016–2011) and 11,500–10,700 days (2018−2016), respectively. There are no observations in F657N between 2011 and 2016. The difference images reveal a bright rim of diffuse emission outside the ER. The rim extends toward the ORs (see Figure 1) rather than having the same shape as the ER, which suggests that the emission may originate from material connecting the rings (discussed further in Section 8.2.3 below).

Figure 6. WFC3 narrowband images. The top row shows F657N, for which all emission sites are dominated by Hα. The bottom row shows F502N, where the ER emission is dominated by [O iii] and the ejecta emission by Fe i λ5007. The emission in the southeast corners is due to Star 3 (see Figure 1). The images have been scaled by an asinh function in order to highlight the weak emission outside the ER. The FOV is 27 × 24.
Download figure:
Standard image High-resolution image
Figure 7. Differences of narrowband images in Hα. The left and middle panels show differences in F657N between 10,700–8700 days (2016–2011) and 11,500–10,700 days (2018−2016), respectively. This filter covers Hα in the velocity range [−3500, +3600] km s−1. The right panel shows the difference in F645N (blueshifted Hα in the range [−7900, −2700] km s−1) between 10,700 and 10,000 days (2016–2014). The residuals in the southeast corners are due to Star 3 (see Figure 1). The unit for the color bar is counts s−1 per 0025 pixel. The FOV is 27 × 24.
Download figure:
Standard image High-resolution imageThe right panel of Figure 7 shows a difference image in F645N for the time period 10,700–10,000 days (2016–2014). This filter probes continuum emission from the ring and blueshifted Hα in the range [−7900, −2700] km s−1. The image from 2014 has been presented in Fransson et al. (2015) and France et al. (2015), where strong diffuse emission from the northern part of the ER and streaks of emission extending along the sides of the ER were noted. This was interpreted by France et al. (2015) as emission from the RS and high-latitude material. The difference image in Figure 7 shows that this emission has increased, while the continuum emission from the hot spots has decreased. The diffuse emission is most likely related to part of the diffuse emission seen in F657N, as discussed in Section 8.2.3.
The evolution of the [O iii] emission clearly differs from that observed in Hα, as illustrated by the F502N images in Figure 6 and the difference images in Figure 8. The epochs for the difference images reflect the availability of observations, covering the time periods 10,000–8300 days (2014−2009), 10,700–10,000 days (2016–2014), and 11,500–10,700 days (2018−2016). The rim of diffuse emission outside the ER is not seen in these images. It is also noteworthy that only two new spots are seen outside the ER (one to the south and one to the southwest), compared to the dozen spots observed in F657N and in the R band. The difference images also show a curious double structure of the ER itself, which becomes more apparent with time. This can also be seen directly in the western side of the ER in the images in Figure 6.
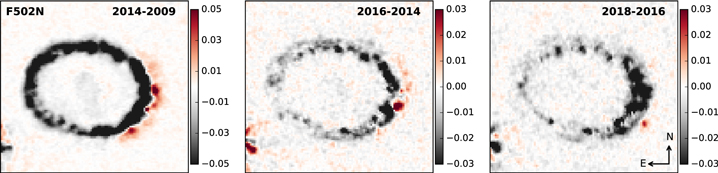
Figure 8. Differences of F502N [O iii] images. The epochs from left to right are 10,000–8300 days (2014−2009), 10,700–10,000 days (2016–2014), and 11,500–10,700 days (2018−2016). The residuals in the southeast corners are due to Star 3 (see Figure 1). The unit for the color bar is counts s−1 per 0.025'' pixel. The FOV is 27 × 2.4''.
Download figure:
Standard image High-resolution image5. Light Curves
In this section, we present light curves for the ER and ejecta in the R and B bands, as well as in the F502N filter for the ER. The latter is not useful for the ejecta because it is too narrow to capture the broad lines. The remnant has been monitored regularly in these filters since ∼2500 days (1994), albeit with a more sparse sampling in F502N. The fluxes presented below correspond to observed quantities, without corrections for extinction, but normalized to WFPC2 as described in Section 2.
The flux of the ER was measured in the elliptical annulus shown in Figure 9, chosen to include as wide an area as possible, while avoiding the ejecta and the bright stars outside the ER. However, the aperture does include the star projected on the southwest part of the ER seen in Figures 3 and 4, as well a very faint star to the south of the ER, indicated in Figure 9. The resulting light curves for the three filters are shown in the left panel of Figure 10 and listed in Table 5 (Appendix A). The late WFPC2 fluxes, which are significantly affected by CTE losses (see Section 2), were increased by 8 (4)% in R (B) in order to match the light curve evolution. It is notable that the light curve evolves faster in F502N, peaking at ∼7000 days, compared to ∼8000 days for the R and B bands. The right panel of Figure 10 shows the R band light curves obtained when the elliptical aperture is split into four quadrants. This reveals large differences, as also expected from the images in Figure 3. The southwest quadrant is more than twice as bright as the southeast one. The northern quadrants are in between these extremes, with the western part being brighter at late times. Light curves of quadrants in the B band and F502N show the same trends.

Figure 9. WFC3/F625W image from 11,500 days (2018) together with the apertures used to produce the light curves. The dashed white and black lines show the apertures for the ER and the ejecta, respectively. The aperture for the ejecta was expanded over time in order to always cover the same part of the inner ejecta. The image has been scaled by an asinh function in order to highlight the weak emission outside the ER. The FOV is 27 ⨯ 21.
Download figure:
Standard image High-resolution image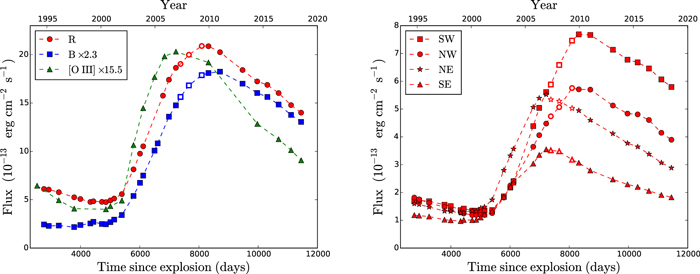
Figure 10. Left: light curve of the ER produced using the aperture in Figure 9. Right: light curve in quadrants for the R band (the B band and F502N show the same trends). The statistical error bars are always similar in size or smaller than the plot symbols. The late WFPC2 fluxes (indicated by open symbols) are uncertain because the images are significantly affected by CTE losses. The fluxes in these observations have been increased by 8% and 4% for R and B, respectively.
Download figure:
Standard image High-resolution imageThe decaying parts of all the light curves of the ER are well fitted by straight lines. Normalizing to the peak flux, , the slopes in the different filters are , and . The different quadrants show that the decay is somewhat steeper on the eastern side: , , , . The reason for this is the brightening of the outermost part of the western side of the ER around 10,000 days (2013–2015) seen in Figure 5.


The flux of the ejecta was measured in a circular aperture that was expanded with time in order to always include the same part of the freely expanding ejecta. The radius corresponds to a constant velocity of 2800 km s−1 in the plane of the sky, while the linear dimensions increase by a factor of 4.1 between the first and last observations. Figure 9 shows this aperture in the most recent observation. The maximum size was chosen in order to avoid direct overlap with the bright emission from the ER. As a result of this limitation, part of the ejecta is outside the aperture in the south, as seen in Figure 9.
The resulting light curves are shown in the left panel of Figure 11 (and listed in Table 6 in Appendix A), while the right panel shows the light curves when the expanding aperture is split into a western and eastern half. We do not apply the empirical corrections for CTE losses in WFPC2 used for the ER above, as we find that this results in discontinuities in the ejecta light curves. This difference may be explained by the fact that the background in the ejecta region is relatively high (due to the ER), which is known to reduce CTE losses. Figure 11 instead indicates that smaller corrections that are different for the three epochs would be required for the ejecta.

Figure 11. Left: light curve of the inner ejecta. The flux was measured in an expanding, circular aperture with radius 2800 km s−1 in the plane of the sky (see Figure 9). Right: same, but separately for the eastern and western parts of the ejecta. Note the brightening of the western ejecta at late times. The statistical error bars are always similar in size or smaller than the plot symbols. The light-colored (semitransparent) points have been corrected for scattered light from the ER using the models described in Appendix B. The late WFPC2 fluxes are uncertain because the images are affected by CTE losses, but no corrections have been applied (see text for details). These points are plotted with open symbols.
Download figure:
Standard image High-resolution imageAs previously reported in Larsson et al. (2011), the ejecta light curve decays until ∼5000 days and then increases. With the new observations added here, we note that the flux is continuing to increase, but at a gradually slower rate at later times. The eastern and western halves evolve very similarly until 7000 days, after which the western part brightens faster and remains brighter than the eastern part. The flux in the eastern half has remained approximately constant since 10,700 days.
The main uncertainty affecting the ejecta light curves is the background due to scattered light from the ER. The ER is more than an order of magnitude brighter than the ejecta and the tails of the Point-Spread Function (PSF) of the hot spots will contribute a significant flux in the ejecta region. This effect is negligible before 6000 days, but becomes more important as the ER brightens and the aperture for the ejecta expands. To obtain a first-order estimate of this effect, we construct synthetic models for the ER at seven epochs between ∼6100 and 11,500 days. The details of this are described in Appendix B. From the models we can compute the predicted flux due to scattered light in the aperture of the ejecta. This amounts to ∼17 (12)% of the total measured ejecta flux in the R (B)-band after 8700 days, with the fading ER and expanding aperture combining to produce a roughly constant contribution. The effect of this on the light curve is shown in Figure 11. We note that the corrections do not change the conclusion that the flux in the western part of the ejecta is still increasing.
Finally, a smaller source of uncertainty is Star 3, which is located to the southeast of the ER. Depending on the roll angle of the telescope, diffraction spikes from this star may overlap with the remnant. The only instance where this has a significant impact is at 7000 days (2006 April, see Figure 4), where such a spike affects the ejecta light curve in the B band. We estimated the contribution from this as the average flux of the corresponding parts of the other diffraction spikes of Star 3. Correcting the light curve for this resulted in a ∼10% reduction of the measured flux. The effect of the diffraction spike is negligible for the ER and for the ejecta in the R band due to the much higher fluxes relative to the spike.
6. Expansion of the ER
We analyzed the expansion of the ER by fitting ellipses to the positions of the hot spots (similarly to Fransson et al. 2015 and Alp et al. 2018). We used the 26 hot spots identified in the R-band image from 7200 days (2006 December, see Figure 1 of Alp et al. 2018). The positions of the hot spots were determined by fitting 2D Gaussians to this image. The hot spots in the other observations were then located by fitting 1D Gaussian functions to the radial profiles defined by the position angles for the hot spots identified in the 2006 image. This ensures that the same hot spots are identified in all observations.
We performed all fits using the Levenberg–Marquardt algorithm and took the square root of the diagonal elements of the covariance matrix as the standard deviations of the fitted parameters. The assumption that the hot spots are described by a perfect ellipse introduces a systematic uncertainty. To explore the effects of this, we also fitted an elliptic annulus with sinusoidal intensity along the azimuthal direction and a Gaussian radial profile. The aim of this is to capture all the emission from the ER rather than treating it as a collection of point sources. The results are shown in Figure 12. We find that the two methods give similar results, but that the systematic uncertainties dominate the error budget.

Figure 12. Evolution of the semimajor axis of the ER. The lines are fitted to the hot spot measurements after 7700 days, whereas the lines fitted to the continuous elliptic annuli are omitted for visual clarity.
Download figure:
Standard image High-resolution imageWe use the temporal evolution of the semimajor axis from the fits to measure the expansion velocity, which should correspond to the typical velocity of the transmitted shocks in the hot spots. We focus on observations later than 7700 days because the evolution is less systematic at earlier times. From the fits of ellipses to the hot spots, we find an expansion velocity of 696 ± 36 km s−1 in the R band and 748 ± 30 km s−1 in the B band. This can be compared to 639 ± 25 km s−1 in the R band and 626 ± 22 km s−1 in the B band from the fits of the extended, continuous elliptic annuli. The errors are only statistical, which shows that the systematic uncertainties are dominating. For this reason, we take 680 ± 50 km s−1 as our estimate of the expansion velocity, which corresponds to the average and the sample standard deviation of the four individual values. For comparison, Fransson et al. (2015) found velocities for individual hot spots in the range 180–950 km s−1 with a mean of 540 km s−1. We note that those velocities were not corrected for the inclination of the ER, whereas our measurement based on the semimajor axis represents the true velocity.
7. Properties of the New Spots
Since ∼9500 days, a number of new, faint spots have appeared outside the ER (Figures 5–8). We note that the spots that can be seen appearing and disappearing to the northwest of the ER in the R band in Figure 5 are due to ghost reflections of Star 2 (labeled in Figure 1). The reflections can be identified because similar features appear around all the bright stars in a given image and because the spots move between consecutive observations as the roll angle changes. Bright reflections in the vicinity of SN 1987A are only observed in the R band. There are also three faint background stars located near the ER (labeled in Figure 9), which can be seen in all previous broadband observations. Excluding the reflections and stars, we identify a dozen new spots associated with SN 1987A, most of which are located in the southeast. These all fulfill the criteria that they (i) are not detected before 9500 days, (ii) are detected in at least two different filters, and (iii) cannot be identified as reflections based on a comparison of features around bright stars in the image.
We performed flux measurements for the six new spots labeled in Figure 5. The remaining spots were either too faint and/or located too close to the ER to enable reliable measurements. Aperture photometry was performed with the IRAF/DAOPHOT package (Stetson 1987), using an aperture radius of 0075. The centers of the apertures were kept fixed at the positions of the spots determined by fitting 2D Gaussian functions to the difference images where each spot first appears. We verified that fits at other epochs did not show any evidence for significant movement of the spots with time. Aperture corrections were determined from measurements of bright isolated stars in the images.
The background was taken as the median in an annulus around each spot with inner and outer radii of 0100 and 0230, respectively. This method was chosen based on extensive testing, which showed that this gave the best agreement between the R band and F657N, as well as a flux evolution in agreement with that seen directly in the difference images. We stress that there is a large systematic uncertainty due to the complex background, which varies significantly over small spatial scales. These measurements therefore only provide a rough estimate of the flux levels and time evolution. We also performed PSF photometry on the six spots, which gave consistent results for the time evolution, but failed in a few cases for the faintest spots.
The flux measurements in the R band and F657N are shown in Figure 13. The light curves of spots 1, 2, and 5 have been truncated before the last observation because the rim of diffuse emission brightens inside the apertures of the fading spots, resulting in large uncertainties. Spots 1 and 6, which are closest to the ER, are clearly the brightest. The other spots are several times fainter and located further away. The fluxes in F657N are only ∼1.5–2 times lower than in the R band, despite the filter widths differing by a factor of 12. This is a very strong indication that the emission is due to lines (predominantly Hα and [N ii] if the spectrum is similar to that of the ER) rather than continuum. Normalizing the light curves by the peak flux and fitting straight lines as in Section 5 gives decay slopes of k1 = 3.20 ± 0.44, k2 = 1.57 ± 0.05, and k3 = 4.50 ± 0.07 for the first three spots. The quoted uncertainties are statistical only and do not account for the systematic uncertainty in the background measurements. Spot 4 is not well described by a linear model, spot 5 only has two data points in the decaying part, and spot 6 only has one flux measurement.

Figure 13. Light curves for six of the new spots that have appeared outside the ER. The numbers are the same as in Figure 5. Filled and open symbols show fluxes in the R band and in F657N, respectively. All the observations were made with WFC3, but the R-band fluxes have been normalized to WFPC2 using the correction factor in Table 3 in order to allow for comparison with the light curves of the ER. The F657N fluxes have been multiplied by a factor of 1.6.
Download figure:
Standard image High-resolution image8. Discussion
Below we discuss the properties of the different emission components in SN 1987A. We discuss the ER in Section 8.1, the emission outside the ER in Section 8.2, and the ejecta in Section 8.3. The future evolution of all these components is discussed in Section 8.4.
8.1. Properties and Evolution of the ER
Almost all the optical emission from the ER comes from shock-heated gas in clumps with high densities (up to before the shock interaction, Fransson et al. 2015). The clumps, which are observed as hot spots in the images, are embedded in gas with lower density (∼103 cm−3, e.g., Mattila et al. 2010). The first appearance of a hot spot can be traced back to ∼3000 days (Sonneborn et al. 1998; Lawrence et al. 2000). This hot spot was initially very faint, but by ∼4000 days (1998) it is clearly seen in the northeast part of the ER in Figure 3. By ∼6000 days (2003), hot spots had appeared all around the ER. The ER continued to brighten in the R and B bands until 8000 days and then started to fade, as reported in Fransson et al. (2015). Here we have extended the broadband light curves by 4 years and also presented the light curve for the F502N [O iii] filter. This shows that the ER continues to fade linearly with time and that the [O iii] emission evolves faster than the R and B bands, peaking ∼1000 days earlier and also taking ∼1000 days less to reach half the peak flux (Figure 10).

To understand the more rapid evolution of the [O iii] emission, we first consider the recombination timescale, , where αR(Te) is the recombination rate as a function of the electron temperature, Te, and ne is the electron number density. This timescale is short, although it generally increases for lower ionization stages. The temperature of the gas from which the [O iii] emission originates is ∼105 K (if in coronal equilibrium, Nahar 1999). The recombination rate for O2+ increases from 2.5 × 10⁻¹² cm3 s−1 at 104 K to 1.33 × 10⁻¹¹ cm3 s−1 at ∼2 × 10⁵ K. The density in the compressed shocked gas is 106−107 (Gröningsson et al. 2008b), giving a recombination timescale for O2+ of days. For comparison, the observed timescale for the [O iii] emission to decay to 50% of the peak flux is ∼3600 days (Figure 10). It is therefore highly likely that the observed decay represents a real decrease in the shocked mass per unit time, rather than slow recombination. Although the recombination rate of H+ is slower by more than one order of magnitude, the recombination is still fast and the difference in decay time for [O iii] and the Balmer lines (which make major contributions to the R and B bands) is unlikely to be caused by different recombination rates.


A more likely explanation is that the [O iii] emission reflects the instantaneous mass flux of shocked, cooling gas, while the emission from HI and other lower ionization stages reflects the accumulated mass of singly ionized gas behind the more rapidly cooling gas. The amount of ionized gas behind the cooling region is determined by a balance between recombination and the ionizing extreme UV and soft X-ray emission from the shock (e.g., Allen et al. 2008). The slow evolution of the X-ray flux (Frank et al. 2016) compared to the much faster decrease of the narrow lines from the unshocked gas in the ER (K. Migotto et al. 2019, in preparation) demonstrates that the ionizing flux is decreasing more slowly than the amount of unshocked gas.
The [O iii] emission from the ER also exhibits a kind of double structure, which is seen in the images after ∼10,000 days in 2014 (Figures 6 and 8). The inner part matches the hot spots of the ER observed in other filters, while the outer part can be described by an ellipse with the same eccentricity and orientation, but a semimajor axis that is ∼016 larger at 11,500 days. The outer part is fainter and mainly composed of diffuse emission. Inspection of the Hα images reveal a corresponding, but very faint, structure southwest of the ER only (hidden by the bright emission from the hot spots in Figure 6). This difference in morphology between the filters may be related to the fact that the [O iii] emission reflects the immediate energy input from the shocks. If the emission from the outermost part of the ER is due to newly shocked gas, the Hα region has not yet had time to build up.
A plausible explanation for the outer structure is that it is due to emission from material swept up by the blast wave moving through gas with lower density between the clumps. The velocity of the blast wave is 1850 ± 100 km s−1 (measured from X-rays, Frank et al. 2016). Assuming this velocity, the timescale to produce the observed separation between the two structures is 7400 days, which is consistent with the start of the interaction as signaled by the appearance of the first hot spots around 4000 days. Another possible explanation for the double structure is that the ER was formed by two different ejection events. Assuming that the outer part is in the same plane and has the same expansion velocity as the inner one (10 km s−1, Crotts & Heathcote 2000), the inferred time difference between the ejections is ∼4000 yr. We find this scenario less likely given that the ER and ORs have velocities that are consistent with a common ejection event. A third option is that both parts of the ER were ejected around the same time, but with different velocities. There is no evidence for multiple velocity components in the spectra of the ER, but we note that a faster and fainter component may be hard to detect.
The fact that the emission from the hot spots has stopped increasing indicates that the blast wave has left the ER and is no longer sweeping up new high-density material. At the same time, the dense clumps are most likely being destroyed by the shocks, as discussed in Fransson et al. (2015). A change in the evolution of the ER has also been observed at other wavelengths. The mid-IR emission, which is due to shock-heated dust, peaked around 8500 days and shows a similar evolution as the optical light curves (Arendt et al. 2016). The shocks in the hot spots also produce soft X-ray emission, which can be described by a ∼0.3 keV collisional ionization equilibrium plasma (Frank et al. 2016). The 0.5−2 keV light curve has leveled off at a constant value at 9500 days and the images of the softest X-ray emission show a similar morphology as the optical, supporting an association with the optical hot spots (Frank et al. 2016). By contrast, both the hard X-ray and radio emission continue to increase and are brighter in the east (Frank et al. 2016; Cendes et al. 2018). This emission is thought to originate from the lower-density material (∼103 cm−3) located between the clumps and at higher latitudes. Such a low-density component is also required in models for the optical emission from the unshocked gas in the ER (e.g., Gröningsson et al. 2008b; Mattila et al. 2010). Radio observations show that the shock velocity started to increase around 9300 days (Cendes et al. 2018), supporting the scenario that the blast wave has left the ER. Interestingly, the recent evolution of the ER may also be associated with the emergence of gamma-ray emission (Malyshev et al. 2019).
By fitting ellipses to the ER in the time series of HST R- and B-band images we find that it is expanding at 680 ± 50 km s−1. This number is not affected by the inclination of the ER toward the observer, and should thus correspond to the typical velocity of the transmitted shocks in the clumps. This is compatible with the range of shock velocities observed in high-resolution spectra, although a direct comparison is complicated by the inclination and the fact that the emission is a superposition of oblique shocks of different velocities (K. Migotto et al. 2019, in preparation). The spectra also show that the highest shock velocities increase with time as faster shocks have time to cool (Gröningsson et al. 2008a; K. Migotto et al. 2019, in preparation).
The fits to the ER give a semimajor axis of ∼082 in the last epoch. This is smaller than the 10 radius estimated in radio (Cendes et al. 2018), as expected if the latter emission originates from material interacting with faster shocks. Interestingly, the semimajor axis of the outer part of the ER in [O iii] is similar to the size in radio, supporting the scenario that the [O iii] emission originates from the blast wave propagating between the clumps. However, the [O iii] likely originates close to the plane of the ER, while the radio is well described by a torus model with a current opening angle of ∼30° (Cendes et al. 2018). For X-rays, Frank et al. (2016) report a semimajor axis of ∼083 in the full band and ∼075 in the 0.3–0.8 keV band. The latter is smaller than the size of the optical ER, which is not expected if the soft X-ray emission arises from the hot spots. This may be due to systematic uncertainties associated with the significantly lower resolution in X-rays.
8.2. Emission Outside the ER
In this section, we discuss the properties and origin of the emission outside the ER. We propose that this emission is due to fast ejecta interacting with high-latitude material that extends from the ER toward the ORs. In this scenario, the emission from the new spots is due to slow shocks propagating in dense clumps embedded in the high-latitude material. The shocked lower-density gas between the clumps is not expected to produce optical emission. However, the interaction will also give rise to a RS, which can explain the diffuse emission outside the ER. Specifically, the H i in the ejecta will be excited when reaching the RS and subsequently produce Hα emission at the velocity of the freely expanding ejecta. In Section 8.2.1, we start by briefly discussing the spectra of the RS in SN 1987A. The RS extends well outside the ER and provides information about the highest velocities of interacting ejecta. This is followed by a discussion of the properties of the new spots and diffuse emission in Sections 8.2.2 and 8.2.3, respectively.
8.2.1. The Reverse Shock
Emission from ejecta interacting with the RS at the inner edge of the ER has been observed since the time of the appearance of the first hot spots (Michael et al. 1998). The properties and evolution of the RS have since been studied in detail by many authors (e.g., Michael et al. 2003; Smith et al. 2005; Heng et al. 2006; France et al. 2010, 2011, 2015; Fransson et al. 2013). The most important aspect for the discussion here is the highest observed velocities, which show that the RS must currently extend well outside the plane of the ER. A recent spectrum of the Hα emission from the RS is shown in Figure 14. The spectrum was obtained with the UVES instrument at the Very Large Telescope (VLT) at 11,200 days (see Appendix C for details about the observations). The slit covers approximately one-half of the remnant and the two spectra in Figure 14 have been extracted from the northern and southern halves of the slit.

Figure 14. VLT/UVES Hα line profiles from 11,200 days (2017). Spectra from the northern and southern halves of the slit are shown in magenta and cyan, respectively. The narrow lines are from slow shocks into the ER, while the extremely broad profiles extending to ∼9000 km s−1 are from the RS. The features at ∼±4000 km s−1 originate from the RS just inside the ER.
Download figure:
Standard image High-resolution imageThe "horns" at ∼4000 km s−1 are from the RS in the plane of the ER, where the ejecta velocity is ∼5500 km s−1 considering the inclination. However, we also see emission at much higher velocities, which must originate from higher latitudes. The RS emission from the northern part extends to at least 8500 km s−1 on the blue side, where the narrow [O i] λ6364 line from the shocked ER interferes. Extrapolating the profile to the background level, we find that the emission extends to ∼9000 km s−1. The red wing on the southern side is disturbed by the [S ii] λλ6716,6731 doublet. However, there is a faint wing on the red side of these lines above the background, which extends to ∼9500 km s−1. The red and blue extensions of the northern and southern parts are consistent with these values.
Considering that there is some uncertainty in the maximal velocities due to the exact level of the continuum, we conclude that there is evidence of interacting ejecta with velocities at least as high as ∼9000 km s−1. Unfortunately, the current observations do not allow us to determine the spatial location of this emission with greater precision than the north/south division presented in Figure 14. We also note that a major part of the new emission outside the ER is outside the slit used for these observations (in particular the southeastern part, see Appendix C).
8.2.2. The New Spots
There are currently about a dozen faint spots located outside the ER of SN 1987A, most of which are in the southeast region. These spots have appeared during the time period between 9500 and 11,500 days (2013 and 2018). In Section 7 we presented photometry for the six spots with the highest S/N. Based on the similar fluxes found in the broad R band and the narrow F657N filter, we conclude that the emission is due to relatively narrow lines rather than continuum or very broad lines. Only two of the new spots are observed in [O iii].
The R-band peak fluxes of the new spots are in the range (1–6) × 10−15 erg cm−2 s−1, which is more than an order of magnitude lower than the peak fluxes of the hot spots in the ER. The latter are in the range (4–17) × 10−14 erg cm−2 s−1, with a median of 7 × 10⁻¹⁴ erg cm−2 s−1 (determined from the fits in Section 6). The flux decay of most of the new spots is approximately linear with time, just like the ER itself. The decay timescale to reach one-half the peak flux can be estimated for three of the spots (from the fits in Section 7), giving values of ∼1100, 1600, and 3200 days. For the spots in the ER, the range of timescales is ∼2600–8000 days, with a median of ∼4300 days (see light curves in Fransson et al.2015).
The emission from the new spots may be due to photoionization by X-rays or shock interaction. We find the former scenario less likely since the time of appearance and the positions of the spots do not correlate with any dramatic increase of the X-ray flux or with the morphology of X-ray emission from the ER (Frank et al. 2016). The rapid appearance and fading of the spots is also hard to explain if they are due to photoionization. In the case of shock interaction, it is possible that the blast wave, which has left the main ER, is now interacting with material further out in the same plane. However, as discussed in Section 8.1, the expected location of the blast wave is consistent with the outer edge of the ER seen in [O iii]. Figures 5–8 show that the majority of the new spots are located further out than this. If the spots in the southeast are in the plane of the ER, the blast wave must have propagated significantly faster in this direction, which may be possible given that the ER is fainter in this region. Another possibility is that the spots are due to interaction between fast ejecta and high-latitude material connecting the ER with the ORs. We favor this interpretation because the spatial distribution of all the emission outside the ER can be explained in this way (see Section 8.2.3). We also find that this scenario can account for the emission properties of the spots, as outlined below.
Explaining the new spots with shock interaction requires that the density of the clumps is high enough and that the shocks propagating into the clumps are slow enough to match the observed fast cooling. To estimate the shock speed into the clumps, we need to estimate the density of the ejecta as a function of velocity. As a rough estimate, we assume a spherically symmetric model with a density calculated from the 1D explosion models that have been used to explain the light curve, in particular the ones from Shigeyama & Nomoto (1990) and Woosley et al. (1988) (also discussed in Fransson et al. 2013). The density profile of the outermost ejecta in the Shigeyama & Nomoto (1990) 14E1 model can be approximated with where t is the time since explosion and Vejecta is the velocity of freely expanding ejecta. The 10H model of Woosley et al. (1988) can be fit with a similar power law, but with the density normalization a factor of 3.0 higher (Michael et al. 2003). The uncertainty in the density is considerable, both from differences in the explosion models and 3D effects. As in Fransson et al. (2013), we therefore introduce a factor f expected to be in the range 1 ≲ f ≲ 3. We thus assume


With a number density of the clumps, nH,clump, and an He:H abundance of 0.2 by number, the mass density of the clumps are . Estimating the shock velocity in the clumps, Vclump, from , where Vejecta is the velocity of freely expanding ejecta at the radial distance of the clumps, we get


The temperature behind the shock into the clumps is K. In the coronal approximation, the cooling function from Dere et al. (2009) can be approximated by in the range K. The cooling timescale, , where is the electron density behind the shock, can then be expressed as


This shows the extreme dependence of the cooling timescale on the ejecta velocity, which is a result of the steep density gradient in the outer part of the ejecta. The fastest ejecta interacting with the RS at 11,200 days have velocities of ∼9000 km s−1 (Section 8.2.1), which means that the shock velocity into the clumps will be ≲200f1/2 km s−1 if the number density in the clumps is ≳9 × 10³ . The corresponding cooling time is tcool ≲ 478f1.75 days, which brackets the range of observed timescales considering that 1 ≲ f ≲ 3. The ejecta density close to the RS is only ∼8 × f .


It is likely that the highest ejecta velocities at the RS are ≳9000kms−1 because of projection effects and the fact that we can only trace fairly bright RS emission above the background continuum. Because of the steep dependence of the cooling time on the ejecta velocity in Equation (3), clumps with densities considerably lower than the above estimate may therefore be able to cool on the observed timescales. Conversely, interaction at lower ejecta velocities can explain the observations if the clumps have higher densities. For comparison, we note that clump densities as high as ≳106 have been inferred for the winds of some red supergiants and other late-type stars (e.g., Gray et al.2016).

The spectra emitted by the clumps depend on the shock velocities. Shocks with velocities ≳200 km s−1 are expected to give rise to strong [O iii] emission according to the radiative shock models in Allen et al. (2008). At lower velocities, the Balmer lines and [O ii] λλ3726,3729 will dominate. The fact that only two of the dozen new spots have [O iii] emission that is strong enough to be seen in the images is thus indicative of slow shock velocities in most of the clumps. Summarizing, we find it likely that the excitation and fading of the new spots can be explained by shock heating by fast ejecta, although we note that there are considerable uncertainties in both the ejecta structure at high velocities and the density of the clumps.
8.2.3. The Diffuse Emission
Here we investigate the possibility that the rim of diffuse emission seen in the difference images of Hα (Figures 5 and 7) originates in material connecting the ER and ORs. This is motivated by this structure being extended toward the ORs, as well as a possible limb brightening on the eastern side. We also note that France et al. (2015) reported some similar structures in narrowband images obtained at 10,000 days in 2014 and discussed the possibility of an origin in material connecting the rings.
To investigate this scenario, we set up a simple model for the ring system. We assume that all the rings are circular and that they have inclinations of 43° (ER), 45° (NOR) and 38° (SOR), as reported by Tziamtzis et al. (2011). The NOR is located on the far side of the ER with respect to the observer and the SOR is on the near side. We take the radius of the ER from our measurements in Section 6 and set the radii of the NOR and SOR to be larger by a factor of 2.2 and 2.3, respectively. The latter were estimated from the latest F657N image in Figure 1. The distances between the SN and the centers of the NOR and SOR were set to 1.3 and 1.0 × 1018 cm, respectively, consistent with the range of distances to the ORs reported by Tziamtzis et al. (2011). We also apply a small rotation of the system around the north–south axis in order to match the 7° tilt of the major axis of the ER (obtained from the fits in Section 6, see also Kjær et al. 2010) and the similar observed tilts of the ORs. Finally, we shift the centers of the NOR and SOR to the west by 5.5 and 4.0 × 1016 cm, respectively, which results in a good agreement between the projected model and the images. The fact that there is a small deviation from the symmetry axis has previously been noted in the literature (e.g., Burrows et al. 1995; Tziamtzis et al. 2011). A 3D view of the model is provided in the left panel of Figure 15.

Figure 15. Left: 3D model for the ring nebula surrounding SN 1987A. The ER is shown in gray, the NOR in red and the SOR in blue. The model assumes that there is material connecting the ER and ORs, as illustrated by the red and blue dashed lines. The three additional rings on each side show where spherically symmetric freely expanding ejecta with velocities of 7000, 8000, and 9000 km s−1 would intersect this material at 11,500 days in 2018. These interacting regions make up the intermediate rings (IRs) in the images. The gray sphere and line show the observer and the line of sight, respectively. Right: projection of the ring system on the sky. The material connecting the rings has been omitted for clarity. The FOV is 50 × 55.
Download figure:
Standard image High-resolution imageWe assume that there is material connecting the ER with the ORs in the simplest way possible, i.e., straight lines as shown in the left panel of Figure 15. The intersection between this material and a spherically symmetric ejecta would result in two intermediate rings (IRs), one on each side. The projection of this system as seen by an observer is shown in the right panel of Figure 15. Since the northern part of the southern IR (SIR) and the southern part of the northern IR (NIR) overlap with the ER, the net visible effect is one ring elongated in a similar way as the observed rim of Hα emission. The outer boundaries of the IRs in our model correspond to the intersection between freely expanding ejecta traveling at 9000 km s−1 and the material between the rings at 11,500 days in 2018. This provides an approximate match to the size of the observed structure and is also consistent with the highest velocities in the spectra (Section 8.2.1). In these calculations, we have assumed that any deceleration of the ejecta by the H ii region is negligible. The properties of the H ii region at high latitudes are uncertain, but the density likely decreases away from the ER (Chevalier & Dwarkadas 1995; Mattila et al. 2010).
Figure 16 shows the projection of the IRs superposed on difference images in F657N (11,500–10,700 days, 2018−2016) and the R band (11,500–8700 days, 2018−2011). The two filters and timescales provide complementary information about the emission. The maximal extent of the diffuse emission is similar in both images, but the R-band image shows brightening in a wider region due to the longer timescale considered. The comparison with the model shows that almost all the emission outside the ER is bracketed by the lines corresponding to 7000 and 9000 km s−1. Given the simplicity of the model, the overall agreement is satisfactory. We stress that the purpose of this model is only to show that an origin of the diffuse emission in material connecting the rings is plausible, not to provide an exact fit to the observations. More generally, IRs above and below the plane of the ER would result from the intersection between the ejecta and any other bipolar, axisymmetric structure, such as an hourglass (Chevalier & Dwarkadas 1995; Crotts et al. 1995). We also stress that the IRs are not well-defined rings in the same way as the ER and ORs and that they only clearly appear as rings in the difference images. The IRs are seen to expand with time, but the S/N of the diffuse emission in difference images between consecutive years is too low to determine the expansion velocity (see Figure 5).

Figure 16. Projection of the IRs from the model in Figure 15, shown superposed on difference images in Hα (left, 11,500–10,700 days, 2018−2016) and the R band (right, 11,500–8700 days, 2018−2011). The blue rings are on the near side of the ER and the red ones on the far side. The southern parts of the red rings would thus be obscured by the ER, as shown in Figure 15. For each color, the three gradually darker rings correspond to ejecta velocities of 7000, 8000, and 9000 km s−1, respectively. The residuals in the southeast corners are due to Star 3 (see Figure 1). The unit for the color bar is counts s−1 per 0025 pixel. The FOV is 26 × 27.
Download figure:
Standard image High-resolution imageAssuming that the diffuse emission originates from ejecta reaching the RS, we expect strong Hα emission and no [O iii], which agrees with the observations. In order to further test the model, we would need spectral information to obtain Doppler shifts for the different parts of the diffuse emission. Under the assumption that the emitting material has the same velocity as the freely expanding ejecta, both IRs will be blueshifted in the north and redshifted in the south. Our model with ejecta velocity 9000 km s−1 (see Figure 15), gives a maximum blueshift in the north of the NIR of ∼−3400 km s−1 and a maximum redshift in the south of ∼8400 km s−1. The corresponding numbers for the SIR are ∼−7700 km s−1 in the north and ∼3700 km s−1 in the south. This means that some of the emission from the IRs should be shifted outside the F657N filter, which covers [−3500, +3600] km s−1 around Hα at the systematic velocity of SN 1987A. However, the main parts of the IRs that are shifted outside the filter also overlap with the ER, which means that there will not be a noticeable effect in the images.
Basic velocity information can instead be obtained from previous observations in other narrow filters, as discussed in France et al. (2015). The F645N filter probes blueshifted Hα in the range [−7900, −2700] km s−1 (Table 4). The F645N difference image between 10,700 and 10,000 days (2016–2014) shows a rim of emission that follows the trends expected for the SIR (Figure 7, right panel). In particular, there is no emission in the southern part of the ring, which is expected to be redshifted outside the filter. The fact that the NIR is not seen in F645N is also consistent with the expectations from the model since almost all the emission from NIR is expected at velocities redshifted outside this filter. On a detailed level, the shape of the SIR in F645N is somewhat different from that seen in F657N, which may be explained by the different epochs and the different velocities probed. The SIR also disappears outside the filter further to the south than expected from our model, suggesting interaction at higher velocities and/or that the material connecting the rings may have a more parabolic shape with respect to the polar axis. Such a shape would imply interaction closer to the line of sight and thus higher blueshifts. Emission from the RS close to the line of sight has also been inferred from previous two-dimensional spectra of the RS obtained with HST/STIS (e.g., France et al. 2010; Fransson et al. 2013).
To probe redshifted Hα emission, we can use the F665N filter, which covers the interval [300, 7600] km s−1. There has only been one observation in this filter (at 10,000 days in 2014), so we cannot investigate difference images as above. However, France et al. (2015) noted streaks of emission in this image, similar to the expectations for the NIR. These features are especially clear when subtracting the F658N filter, which removes much of the emission from the ER itself. The likely emission from the NIR seen in F665N also includes weak emission north of the ER. Due to the filter limits, this cannot be the blueshifted Hα predicted by the model. As discussed for the SIR above, this may suggest a more parabolic geometry for the high-latitude material. In summary, we conclude that the approximate velocity information obtained from the narrow filters is consistent with the trends expected from the model, but that a more complex model will be needed to fully account for the observations.
With spatially resolved spectral information from future observations, it will be possible to obtain information about the detailed geometry and density of the high-latitude material. This information will be important for discriminating between different models for the formation of the triple-ring nebula. For example, the binary merger model by Morris & Podsiadlowski (2009) does not predict material connecting the rings, whereas the scenario proposed by Smith et al. (2013) predicts high-latitude material in a parabolic shape. We also stress that the current observations only probe high-latitude material extending ∼25% of the distance toward the ORs. Future monitoring will be required to determine if there is material all the way out to the ORs.
The fact that there may be material between the ER and the ORs has previously been suggested by light echoes, with Crotts et al. (1995) inferring an hourglass structure and Sugerman et al. (2005) a more cylindrical shape. In addition, in an analysis of early HST images, Burrows et al. (1995) noted that the ER and ORs may be connected by low-surface-brightness walls that fade with distance from the ER. The possibility of significant diffuse emission inside the rings in HST images was also noted by Tziamtzis et al. (2011). Such diffuse emission is expected due to photoionization of the material between the rings by the initial SN flash (see Lundqvist & Fransson 1996 for a model) and later on by the X-ray emission from the ER. The latter most likely has a subdominant effect at current epochs, given the lack of temporal and spatial correlation between the diffuse emission and the X-ray emission from the ER, as well as the fact that the shock-interaction model discussed above can explain the main properties of the emission. The long-term evolution of the diffuse emission and the effect of X-rays will be studied in a separate paper.
8.3. Evolution of the Ejecta
The flux of the inner ejecta in SN 1987A has evolved significantly with time, as seen in Sections 4 and 5. From our previous study of the ejecta light curve (Larsson et al. 2011), we found that the ejecta faded as expected from radioactive decays until ∼5000 days. After this point, the flux started to increase, which can be explained by energy input from the X-ray emission from the ER. Here we have extended the light curve until 11,500 days and also investigated the eastern and western parts separately. In order to follow the freely expanding ejecta, we adjusted the size of the aperture to always correspond to a velocity of 2800 km s−1 in the plane of the sky. We note that this means that the southern part of the ejecta, which overlaps with the ER in the recent images, is outside the aperture (see Figure 9). This region is significantly affected by X-rays (see Larsson et al. 2013), which means that the fraction of flux from the full ejecta that falls outside the aperture is expected to increase with time.
We find that the two halves of the ejecta evolve similarly during the decaying phase and initial rise, brightening by a factor of 2.6 in the R band between the minimum at 5400 days and 7200 days. The increase continues at a slower rate thereafter, especially in the eastern half, where the flux reached a constant level at 10,700 days. The western half makes up 57% of the total R-band flux in the last observation at 11,500 days. The B band evolves in the same way, but with a somewhat smaller flux increase.
These trends are in general agreement with the expectations from powering of the ejecta by X-rays. The soft (0.5–2 keV) X-ray light curve has leveled off in recent years, reaching a constant level at 9500 days (Frank et al. 2016). In addition, the X-ray emission from the western side of the ER started to dominate between 7000 and 8000 days, making up just over 60% of the total X-ray flux at 10,500 days (Frank et al. 2016). While this is similar to the evolution of the ejecta, we note that the soft X-ray light curve does not directly correlate with the ejecta light curve. This is not surprising given the complexity of the energy deposition, which depends on the X-ray flux at different energies (including very soft X-rays below the observed limit), as well as geometric effects, with the asymmetric ejecta being illuminated by a nonuniform ring in the equatorial plane. In addition, the aperture used for the flux measurements does not include the ejecta closest to the ring, where X-ray emission below ∼1 keV is expected to be absorbed (Fransson et al. 2013).
An edge-brightened morphology of the ejecta is expected since most of the X-ray emission will be absorbed in the outer ejecta, as discussed in detail in Fransson et al. (2013) and Larsson et al. (2013). This is supported by observations because the morphology becomes edge-brightened at the same time as the flux starts increasing (see Figures 3 and 4). In the most recent images, the morphology is dominated by a bright clump in the western ejecta, as expected from the fact that the X-ray emission from the ER is stronger on the western side (Frank et al. 2016). The brightening of this clump has also significantly affected the Hα line profile of the ejecta, as shown in Larsson et al. (2016). The strong impact on the Hα line is also reflected in the larger flux increase in the R band compared to the B band. The lines in the B band (including Fe i lines from the inner ejecta, see Table 4) are generally expected to be less affected by the X-rays, although a detailed modeling would be required to quantify the differences.
8.4. Future Evolution of SN 1987A
From the recent HST observations studied in this paper, we have found that the emission from the ER is fading linearly with time, that more emission is appearing outside the ER, and that the flux increase of the ejecta has leveled off. We have also seen that significant changes take place on a 1-year timescale. Future observations are expected to show a continued strong evolution of the remnant. An extrapolation of the R-band light curve of the ER shows that the flux will reach zero by ∼2035. This is a very rough prediction of when the optical ER will be completely gone, considering that the rate of the flux decay may change with time and that there are large differences in flux between different parts of the ER. The southeast part, which is the faintest, will most likely have disappeared well before 2035 (Figure 10, right panel).
At the same time as the ER is fading, we expect the optical emission from high-latitude material outside the ER to become increasingly dominant. Studies of this emission will shed new light on the formation of the rings and the mass-loss history of the progenitor star. In particular, the faint spots outside the ER will provide information about clumping in the wind(s) of the progenitor. Additional spots may appear with time and their densities can be constrained from spectral observations. From spectra of the regions outside the ER, it will also be possible to determine if the diffuse Hα emission comes from freely expanding ejecta interacting with an RS, and, assuming this is the correct interpretation, determine the 3D structure of the high-latitude material. We also expect the RS, traced by the IRs in the difference images, to expand with time. Future HST imaging observations may allow us to constrain the expansion speed, which, in turn, places constraints on the density of the material between the clumps.
The interaction outside the ER may also produce emission at other wavelengths, including radio and X-rays, depending on the densities involved. The prospects for detecting multiwavelength emission from the optically emitting regions outside the ER depend on the relative fluxes of the ER and the high-latitude material at those wavelengths, as well as the spatial resolution. The brightest optical emission outside the ER is still more than an order of magnitude fainter than the ER itself, and we are only able to identify it owing to the excellent spatial resolution of HST.
On a timescale of decades to centuries, we expect to observe interaction between the ejecta and the complex circumstellar environment outside the triple-ring nebula. This environment comprises several distinct structures, including the so-called Napoleon's hat (see Sugerman et al. 2005 for details). We expect the ejecta to start interacting with the innermost of these structures on a timescale of ∼20 yr, while it will take ∼300 yr before ejecta traveling at 10,000 km s−1 reach the outermost parts of Napoleon's hat (assuming the dimensions from Sugerman et al. 2005).
The evolution of the ejecta is strongly coupled to the evolution of the X-ray emission from the ER. The flux from the ejecta has already started to level off, responding to the evolution of the X-ray light curve. If the X-ray emission from the ring starts fading, we expect this to be reflected in the ejecta. However, as the ejecta expand, we also expect the X-rays to penetrate to lower velocities. This is illustrated by the models in Fransson et al. (2013), which show that X-rays with energies above ∼2 keV penetrate into the metal-rich core at 11,000 days, while only X-rays above 5 keV (where the flux is very low) reaches the core at 7000 days. Although the exact evolution depends on the simplified 1D structure of the ejecta used in these simulations, the general trend should be robust. We therefore expect the X-rays to start affecting the core in the future, resulting in changes of the metal lines (e.g., [Fe ii] + [Si ii] at 1.644 μm) as well as the molecular emission (e.g., H2, CO and SiO).
Finally, we expect a dramatic evolution as ejecta with increasingly high densities reach the ER. The southern part of the ejecta already overlaps with the ER in the images, but most of this material is well above the plane of the ring, moving closer to the plane of the sky (Larsson et al. 2016). There is instead more ejecta in the plane of the ring in the north. The velocity of the ejecta that are just reaching the RS in the plane of the ER is currently ∼5500 km s−1. It is highly likely that we will start seeing strong signs of interaction within the next five years when this velocity has decreased to 4500 km s−1, which approximately corresponds to the outer edges of the inner ejecta seen in the HST images.
9. Conclusions
In this paper, we have presented an analysis of the recent evolution of SN 1987A as probed by HST imaging observations. Our main results are summarized below.
- 1.The optical emission from the ER continues to fade linearly with time in all filters, although the light curve in the F502N [O iii] filter peaks earlier and decays faster than the R and B bands by ∼1000 days. This can be explained by the fact that the [O iii] emission reflects the instantaneous energy input from the shocks, while the low-ionization lines in the other filters reflect the accumulated mass behind the shocks.
- 2.The ER is expanding at 680 ± 50 km s−1. This number is independent of the inclination and corresponds to the typical velocity of transmitted shocks in the dense clumps/hot spots. The current radius of the ER determined from the hot spots is 082.
- 3.The image of the ER in [O iii] exhibits a kind of double structure, with an inner part matching the observations in other filters and a fainter diffuse component with a semimajor axis of ∼10. The outer structure is consistent with being due to material swept up by the blast wave propagating in low-density gas between the clumps. Alternatively, the double structure may have formed by ejection episodes at different times and/or different velocities.
- 4.A dozen new spots have appeared outside the ER since 9500 days. Most of these are located in the southeast. Compared to the hot spots in the ER, the new spots are significantly fainter (by one to two orders of magnitude at peak flux) and fade faster with time.
- 5.A rim of diffuse Hα emission has appeared outside the ER. This component is very prominent in the last observation from 11,500 days, but first started to emerge around the same time as the new spots. The rim is extended toward the ORs rather than having the same shape as the ER.
- 6.The new spots and diffuse emission outside the ER can be explained by fast ejecta (∼9000 km s−1) interacting with high-latitude material that extends from the ER toward the ORs. In this scenario the spots are due to slow shocks (∼200 km s−1) driven into dense clumps, while the diffuse emission is due to fast ejecta interacting with a RS. Observations providing spatially resolved spectral information are needed to further test this scenario and determine the precise geometry of the high-latitude material.
- 7.The ejecta continue to brighten, but at a gradually slower rate. The eastern and western halves evolved similarly until 7000 days, after which the western part has brightened faster and remained brighter. These trends are in agreement with the scenario that X-ray emission from the ring is powering the optical emission from the ejecta.
The authors would like to acknowledge the contributions of the deceased Arlin Crotts to understanding the circumstellar environment of SN 1987A. This work was supported by the Knut and Alice Wallenberg Foundation and the Swedish Research Council. R.A.C. acknowledges support from NSF grant 1814910. The research of J.C.W. is supported by NSF AST-1813825. Support for HST GO program numbers 13810, 14333, 14753 and 15256 was provided by NASA through grants from the Space Telescope Science Institute, which is operated by the Association of Universities for Research in Astronomy, Inc., under NASA contract NAS5-26555. The ground-based observations were collected at the European Organization for Astronomical Research in the Southern Hemisphere, Chile (ESO Program 100.D-0-705(A)).
Facilities: HST (WFC3 - , ACS - , WFPC2) - , VLT (UVES). -
Software: DAOPHOT (Stetson 1987), DrizzlePac (Gonzaga et al. 2012), matplotlib (Hunter 2007), Mayavi (Ramachandran & Varoquaux 2011).
Appendix A: Light Curve Tables
Here we provide the flux measurements for the ER and the ejecta in Tables 5 and 6, respectively. The apertures are shown in Figure 9 and the fluxes are plotted in the left panels of Figures 10 and 11.
Table 5. Flux Evolution of the ER
| Date | Epocha | R-band Flux | B-band Flux | F502N Flux |
|---|---|---|---|---|
| (YYYY mm dd) | (days) | (10−13 erg cm−2 s−1) | (10−13 erg cm−2 s−1) | (10−14 erg cm−2 s−1) |
| 1994 Feb 3 | 2537 | ... | ... | 4.16 ± 0.06 |
| 1994 Sep 24 | 2770 | 6.111 ± 0.007 | 1.059 ± 0.006 | ... |
| 1995 Mar 5 | 2932 | 6.047 ± 0.007 | 0.995 ± 0.006 | ... |
| 1996 Feb 6 | 3270 | 5.775 ± 0.007 | 1.010 ± 0.005 | 3.19 ± 0.04 |
| 1997 Jul 10 | 3790 | 5.250 ± 0.007 | 0.943 ± 0.006 | ... |
| 1997 Jul 12 | 3792 | ... | ... | 2.63 ± 0.04 |
| 1998 Feb 6 | 4001 | 5.073 ± 0.008 | 1.034 ± 0.007 | ... |
| 1999 Jan 7 | 4336 | 4.766 ± 0.004 | 1.106 ± 0.005 | ... |
| 1999 Apr 21 | 4440 | 4.837 ± 0.008 | 1.178 ± 0.006 | ... |
| 2000 Feb 2 | 4727 | 4.779 ± 0.008 | 1.081 ± 0.008 | ... |
| 2000 Jun 16 | 4862 | 4.750 ± 0.008 | 1.071 ± 0.006 | 2.59 ± 0.06 |
| 2000 Nov 13 | 5012 | 4.926 ± 0.003 | 1.165 ± 0.005 | ... |
| 2000 Nov 14 | 5013 | ... | ... | 2.80 ± 0.05 |
| 2001 Mar 23 | 5142 | 5.119 ± 0.007 | 1.277 ± 0.006 | ... |
| 2001 Dec 7 | 5401 | 5.578 ± 0.006 | 1.484 ± 0.005 | 3.16 ± 0.05 |
| 2003 Jan 5 | 5795 | 8.137 ± 0.004 | 2.345 ± 0.002 | 6.88 ± 0.04 |
| 2003 Aug 12 | 6014 | 9.760 ± 0.005 | 2.935 ± 0.003 | ... |
| 2003 Nov 28 | 6122 | 10.523 ± 0.004 | 3.259 ± 0.002 | 9.34 ± 0.07 |
| 2004 Dec 15 | 6505 | ... | 4.381 ± 0.002 | 11.41 ± 0.08 |
| 2005 Apr 2 | 6613 | ... | 4.709 ± 0.003 | ... |
| 2005 Sep 26 | 6790 | 15.762 ± 0.001 | ... | ... |
| 2005 Nov 18 | 6843 | ... | ... | 12.79 ± 0.08 |
| 2006 Apr 15 | 6991 | 17.406 ± 0.004 | 5.906 ± 0.003 | ... |
| 2006 Dec 8 | 7228 | ... | ... | 13.11 ± 0.10 |
| 2006 Dec 6 | 7226 | 18.645 ± 0.004 | 6.418 ± 0.003 | ... |
| 2007 May 12b | 7383 | 19.040 ± 0.006 | 6.795 ± 0.008 | ... |
| 2008 Feb 19b | 7666 | 19.997 ± 0.007 | 7.311 ± 0.009 | ... |
| 2009 Apr 29b | 8101 | 20.898 ± 0.008 | 7.774 ± 0.010 | ... |
| 2009 Dec 12 | 8328 | 20.876 ± 0.003 | 7.870 ± 0.005 | 12.38 ± 0.10 |
| 2011 Jan 5 | 8717 | 20.257 ± 0.006 | 7.931 ± 0.004 | ... |
| 2013 Feb 6 | 9480 | 18.416 ± 0.005 | 7.392 ± 0.004 | ... |
| 2014 Jun 15 | 9974 | 17.234 ± 0.005 | 6.973 ± 0.004 | ... |
| 2014 Jun 20 | 9979 | ... | ... | 8.29 ± 0.06 |
| 2015 May 24 | 10,317 | 16.876 ± 0.005 | 6.796 ± 0.004 | ... |
| 2016 Jun 8 | 10,698 | 16.032 ± 0.006 | 6.453 ± 0.006 | 7.26 ± 0.09 |
| 2017 Aug 3 | 11,119 | 14.783 ± 0.004 | 5.986 ± 0.004 | 6.53 ± 0.07 |
| 2018 Jul 8 | 11,458 | 14.002 ± 0.004 | 5.673 ± 0.004 | ... |
| 2018 Jul 10 | 11,460 | ... | ... | 5.86 ± 0.05 |
Notes. All fluxes have been normalized to the bandpass of the WFPC2 filters as described in Section 2. The uncertainties on fluxes are statistical only. We refer the reader to Sections 2 and 5 for information about the systematic uncertainties.
aDays since explosion on 1987 February 23. bFluxes are uncertain due to significant CTE loss in WFPC2, see Sections 2 and 5 for details.Download table as: ASCIITypeset image
Table 6. Flux Evolution of the Ejecta
| Date | Epocha | R-band Flux | B-band Flux |
|---|---|---|---|
| (YYYY mm dd) | (days) | (10−14 erg cm−2 s−1) | (10−14 erg cm−2 s−1) |
| 1994 Sep 24 | 2770 | 3.34 ± 0.02 | 2.65 ± 0.03 |
| 1995 Mar 5 | 2932 | 3.10 ± 0.02 | 2.51 ± 0.03 |
| 1996 Feb 6 | 3270 | 2.62 ± 0.01 | 2.05 ± 0.02 |
| 1997 Jul 10 | 3790 | 2.05 ± 0.01 | 1.66 ± 0.02 |
| 1998 Feb 6 | 4001 | 1.94 ± 0.02 | 1.60 ± 0.03 |
| 1999 Jan 7 | 4336 | 1.763 ± 0.008 | 1.39 ± 0.02 |
| 1999 Apr 21 | 4440 | 1.70 ± 0.01 | 1.34 ± 0.02 |
| 2000 Feb 2 | 4727 | 1.69 ± 0.01 | 1.24 ± 0.03 |
| 2000 Jun 16 | 4862 | 1.62 ± 0.01 | 1.23 ± 0.02 |
| 2000 Nov 13 | 5012 | 1.610 ± 0.006 | 1.21 ± 0.02 |
| 2001 Mar 23 | 5142 | 1.67 ± 0.01 | 1.24 ± 0.02 |
| 2001 Dec 7 | 5401 | 1.58 ± 0.01 | 1.16 ± 0.01 |
| 2003 Jan 5 | 5795 | 2.077 ± 0.006 | 1.469 ± 0.005 |
| 2003 Aug 12 | 6014 | 2.259 ± 0.008 | 1.483 ± 0.006 |
| 2003 Nov 28 | 6122 | 2.286 ± 0.006 | 1.533 ± 0.004 |
| 2004 Dec 15 | 6505 | ... | 1.864 ± 0.005 |
| 2005 Apr 2 | 6613 | ... | 1.927 ± 0.006 |
| 2005 Sep 26 | 6790 | 3.311 ± 0.002 | ... |
| 2006 Apr 15 | 6991 | 3.684 ± 0.006 | 2.164 ± 0.006 |
| 2006 Dec 6 | 7226 | 4.083 ± 0.007 | 2.431 ± 0.005 |
| 2007 May 12b | 7383 | 4.177 ± 0.009 | 2.39 ± 0.01 |
| 2008 Feb 19b | 7666 | 4.54 ± 0.01 | 2.41 ± 0.02 |
| 2009 Apr 29b | 8101 | 5.23 ± 0.01 | 2.81 ± 0.02 |
| 2009 Dec 12 | 8328 | 5.370 ± 0.005 | 2.74 ± 0.01 |
| 2011 Jan 5 | 8717 | 5.77 ± 0.01 | 2.909 ± 0.008 |
| 2013 Feb 6 | 9480 | 6.201 ± 0.009 | 3.019 ± 0.008 |
| 2014 Jun 15 | 9974 | 6.443 ± 0.009 | 3.155 ± 0.009 |
| 2015 May 24 | 10,317 | 6.720 ± 0.009 | 3.239 ± 0.009 |
| 2016 Jun 8 | 10,698 | 7.02 ± 0.01 | 3.40 ± 0.01 |
| 2017 Aug 3 | 11,119 | 7.07 ± 0.01 | 3.348 ± 0.008 |
| 2018 Jul 8 | 11,458 | 7.18 ± 0.01 | 3.449 ± 0.009 |
Notes. All fluxes have been normalized to the bandpass of the WFPC2 filters as described in Section 2. The uncertainties on fluxes are statistical only. We refer the reader to Sections 2, 5 and Appendix B for information about the systematic uncertainties.
aDays since explosion on 1987 February 23. bFluxes are uncertain due to significant CTE loss in WFPC2, see Sections 2 and 5 for details.Download table as: ASCIITypeset image
Appendix B: Models for the ER
The ER in SN 1987A is more than an order of magnitude brighter than the ejecta. This means that scattered/spread light from the ER (i.e., the tails of the PSFs) constitute a significant background in the ejecta region. To estimate how much this affects the flux measurements presented in Section 5, we construct synthetic models for the ER using the HST PSF modeling tool Tiny Tim.15 In the modeling, we approximate the ER as a collection of point sources. We choose seven epochs between 6000 and 11,500 days (listed in Table 7) and construct models in both the R and B bands. The scattered light from the ER before 6000 days is negligible.
Table 7. Estimates of Scattered Light from the ER
| Date | Epocha | B bandb | R bandb |
|---|---|---|---|
| (YYYY mm dd) | (days) | (%) | (%) |
| 2003 Nov 28 | 6122 | 3 | 13 |
| 2006 Dec 6 | 7226 | 7 | 17 |
| 2009 Dec 12 | 8328 | 9 | 18 |
| 2011 Jan 5 | 8717 | 11 | 17 |
| 2014 Jun 15 | 10,317 | 12 | 17 |
| 2016 Jun 8 | 10,698 | 13 | 17 |
| 2018 Jul 8 | 11,458 | 13 | 17 |
Notes.
aDays since explosion on 1987 February 23. bFraction of flux measured in the ejecta aperture that is due to scattered light from the ER according to the model.Download table as: ASCIITypeset image
As a starting point for the models, we simulated point sources using the positions and fluxes determined for the hot spots in Section 6. We also convolved the model with a Gaussian with σ = 0024 since we found that the point sources simulated with Tiny Tim were somewhat narrower than stars in the field. This is likely due to the perfect sampling of the simulated PSFs, which are always positioned at the centers of pixels. Inspection of the differences between the observations and these initial models revealed clear residuals, in particular around the star superposed on the southwestern part of the ER (and excluded from the measurements in Section 6) and in the western part of the ER at late time (where some new spots appear, as seen in Figure 5). We therefore added additional point sources to the models corresponding to these residuals. Finally, we normalized the models to the same total flux as the observations in a 02 wide elliptical annulus covering the ER. This correction is a the level of a few percent.
As an example, Figure 17 shows the resulting model for the R band at 11,500 days (2018) together with the observation. The radial flux profiles of the model and observation are plotted in Figure 18, showing that the agreement is very good around the peak of the ER emission. The discrepancy inside the peak is due to the ejecta and RS, while the higher observed flux outside the ER is due to a significant diffuse component, which is not included in the model. On a more detailed level, there are discrepancies between the model and the observations even around the peak. Considering all 14 models, the distribution of pixel values obtained when subtracting the model from the data has a typical standard deviation corresponding to ∼20% of the mean observed value for the ER. However, these differences do not significantly affect the estimates of the scattered light in the ejecta region. As a test of this, we removed every second point source from the model in Figure 17, but still normalized it to the same total flux. This results in a very bad model with alternating positive residuals and strongly oversubtracted point sources. However, the radial profile is almost identical to the original model (see Figure 18) and the predicted flux in the ejecta region differs by only 2%. The estimates of the amount of scattered light are thus not sensitive to the detailed model of the ER, as long as point sources with the correct total flux are placed in an ellipse. In Table 7 we list the fraction of the flux in the ejecta region that is estimated to be due to scattered light from the ER in these models. We note that the contribution from scattered light depends both on the brightness of the ER and the size of the aperture, which expands with time (see Section 5).

Figure 17. R-band image from 11,500 days (2018) together with the corresponding model for the ER (left and right panels, respectively). The image scale is linear. The FOV is 25 × 18.
Download figure:
Standard image High-resolution image
Figure 18. Flux of SN 1987A calculated in elliptical annuli for the R-band observation at 11,500 days (2018) and the corresponding ER models. The semimajor axis of the elliptical aperture was increased in steps of 0025 (1 pixel). The black line shows the observations, the gray line shows the model for the ER (right panel of Figure 17), and the dashed red line shows the same model, but with every other point source removed (see text for details).
Download figure:
Standard image High-resolution imageAppendix C: VLT/UVES Observations
In this appendix, we briefly describe the VLT/UVES observations of the RS in SN 1987A, which are discussed in Section 8.2.1. The data reduction is similar to that in Fransson et al. (2013) and full details will be provided in K. Migotto at al. (2019, in preparation). The observations were obtained around 11,200 days (2017 October–November) with a total exposure time of 12,000 s. A 08 wide slit with a position angle of 30° was used (see Figure 19), which covers approximately one-half of the remnant. Because the spatial resolution along the slit is limited by the seeing (∼05−06), we cannot obtain accurate spatial information along the slit. However, the resolution is sufficient for extracting spectra in the northern and southern halves (shown in Figure 14). In order to determine the extension of the faint wings of the RS line profile, we subtracted a continuum that we define from a linear interpolation between the line-free regions between ±(17,500 and 20,000) km s−1.

Figure 19. Slit position for the VLT/UVES observation at 11,200 days (2017) shown superposed on the WFC3/F625W image from 11,500 days (2018). The image has been scaled by an asinh function in order to highlight the weak emission outside the ER. The FOV is 27 × 21.
Download figure:
Standard image High-resolution image
Footnotes
- 13
- 14
- 15