


Abstract
We present observations of the stellar and molecular gas mass of SDSS J163909+282447.1, a luminous quasar at z = 3.84 with an extreme mass for a supermassive black hole (SMBH; MBH = 2.5 × 10¹⁰ M⊙). The local SMBH mass–galaxy mass relation predicts a massive host galaxy with Mstellar ≳ 1012 M⊙ for this quasar. Based on sensitive near-infrared imaging with adaptive optics (AO) using Subaru, the stellar light from the host is undetected, thus resulting in an upper limit on the mass, Mstellar < 6.3 × 10¹⁰ M⊙, a factor of ≳16 less than expected. The CO(4 − 3) observations at 0 2 resolution using the Atacama Large Millimeter/submillimeter Array indicate a molecular gas mass from CO of
  M⊙ and a dynamical mass within a radius of 0.45 ± 0.2 kpc of
  M⊙. With the SMBH accounting for ∼60% of the dynamical mass and considering the amount of molecular gas, we find an upper limit on the stellar mass to be Mstellar ≲ 1.5 × 10¹⁰ M⊙, a value consistent with the limit from Subaru AO imaging. Based on these results, this SMBH has one of the largest host stellar mass deficits known given its SMBH mass; hence, it is unclear how to grow a SMBH/host galaxy to such a state since there is not enough molecular gas available to form a substantial amount of stellar mass to make up for the difference. Any physical model is likely to require an earlier phase of super-Eddington accretion onto the SMBH.
Export citation and abstract BibTeX RIS
1. Introduction
With luminous quasars being found out to z ∼ 7 (e.g., Mortlock et al. 2011; Venemans et al. 2013; Matsuoka et al. 2019), supermassive black holes (SMBHs) generating such emission have masses that exceed expectation at such early epochs (MBH > 109 M⊙; e.g., Jiang et al. 2007; Venemans et al. 2015). While mass estimates of SMBHs rely on a locally calibrated technique (e.g., Bentz et al. 2009), it is probable that SMBHs at this mass regime do, in fact, exist and pose a challenge for simulations to produce (e.g., Di Matteo et al. 2005; Hopkins et al. 2005; Springel et al. 2005; Sijacki et al. 2015; Steinborn et al. 2015).
To lend insight into the formation mechanism, there is much effort to determine the properties of the galaxies that host such SMBHs at the highest redshifts. SMBH–host galaxy mass relations established in the local universe (e.g., Magorrian et al. 1998; Ferrarese & Merritt 2000; Gebhardt et al. 2000; Marconi & Hunt 2003; Graham et al. 2011; Kormendy & Ho 2013) are used as a guide on the expected stellar mass. These relations appear to indicate a coupling between SMBHs and their host galaxies that is yet to be understood (e.g., Hopkins et al. 2008; Fabian 2012). Based on the local SMBH–galaxy mass relation, the host galaxies are expected to be massive with Mstellar > 1011 M⊙. This is a subject of intense study to determine whether the local mass relations are applicable over cosmic time (e.g., Treu et al. 2004; Salviander et al. 2007; Jahnke et al. 2009; Decarli et al. 2010; Schramm & Silverman 2013; Park et al. 2015).
In addition to the evolution of the mean  relation, it is important to assess the level of intrinsic scatter and how this changes with redshift. In particular, there are cases, at high redshift, where the SMBH has a mass well above the local relation, thus is hosted by a galaxy of much lower mass than expected (e.g., Mechtley et al. 2016, based on Hubble Space Telescope imaging). It is currently unclear how such a SMBH could grow to such high mass in a shallower potential well. New clues may be found by investigating not only the detection or limits on stellar mass but the molecular gas and dust content that is indicative of subsequent star formation hence the stellar mass buildup, which is now feasible with the Atacama Large Millimeter/submillimeter Array (ALMA).
Studies at the massive end between SMBHs and their host galaxies are challenged with two important questions. (1) How could an overly massive SMBH, as compared to its host, have formed? (2) How can such a system migrate onto the local relation by z ∼ 0? These questions are of direct relevance for understanding the formation of the first SMBHs known to exist at z = 6–7 (Mortlock et al. 2011; Bañados et al. 2018). While quasar host galaxies have been studied at these high redshifts mainly through submillimeter observations of [C ii] emission to place constraints on their total dynamical mass (e.g., Wang et al. 2016; Izumi et al. 2019), only one quasar has a mass estimate consistent with a black hole mass above 1010 M⊙ (Wu et al. 2015).
Here, we present a study of SDSS J163909+282447.1 (hereafter SDSS J1639+2824), a luminous quasar at z = 3.84 that has an extremely massive SMBH with MBH = 2.5 × 10¹⁰ M⊙. It is one of 70 quasars selected from the SDSS DR7 catalog (Shen et al. 2011) with mass estimates based on the C iv broad emission line and having suitable nearby bright stars for adaptive optics (AO)-assisted imaging and spectroscopic observations from the ground. We use both Subaru and ALMA to place joint constraints of the properties of its host galaxy and location with respect to the local SMBH–galaxy mass relation. The target properties and our measurements are summarized in Table 1. The Infrared Camera and Spectrograph (IRCS) on Subaru, assisted by AO, affords a 01–03 imaging at the K band to place a stringent limit on the total stellar mass content. ALMA observations of CO(4 − 3) at 02 resolution allow a measure of the dynamical and gas mass at the kiloparsec scale, thus placing important constraints on the amount of stars present in the central region of the host galaxy. Throughout this paper, we adopt a concordance cosmology with H0 = 70 km s−1 Mpc−1, ΩM = 0.3, and Ωλ = 0.7.
2. Data
2.1. Subaru/IRCS: AO-assisted Near-infrared Imaging
We selected J1639+2824 for observations using the IRCS camera (Kobayashi et al. 2000) together with the AO188 system (Hayano et al. 2010) on Subaru telescope based on several factors that enable AO-assisted imaging, mainly (1) the availability of a bright guide star (GS; R < 15) for tip-tilt correction within 18'' and (2) a sufficiently bright star for point-spread function (PSF) reconstruction located at similar distance from the GS. The latter criterion is important to minimize uncertainties in the PSF reconstruction due to PSF degradation with increasing distance from the GS. This quasar has a favorable configuration between the QSO, GS, and PSF star as shown in the left panel of Figure 1. The IRCS camera uses a 1024 × 1024 pixel InSb Aladdin III detector, which affords a 52'' × 52'' field of view (FoV) with a 52 mas pixel scale. We adopted a five-point dither pattern with a step size of 5'' in order to remove bad pixels.
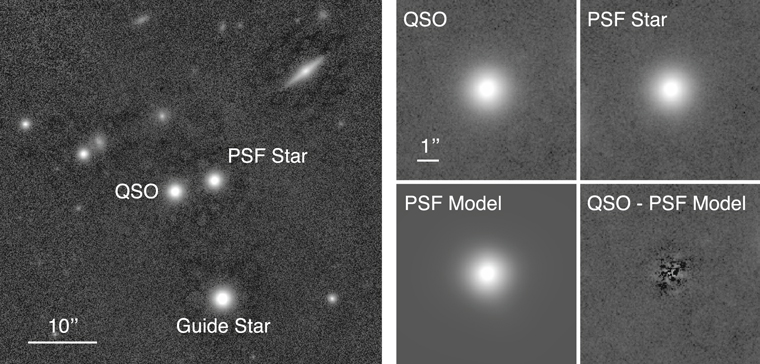
Figure 1. Left: the adaptive optics-assisted K-band image of SDSS J1639+2824 at 03 with an FoV of 54'' × 54''. The position of the quasar (QSO), the PSF star (PSF), and the guide star (GS) are marked. Top right row: small cutout images of the quasar and the PSF used for AGN subtraction. Each cutout is 3'' × 3''. Bottom right row: the residual after PSF subtraction.
Download figure:
Standard image High-resolution imageWe observed J1639+2824 in the K band during 2012 May, 2013 April, and 2014 February with a total exposure time of ≈10 ks for the final stacked image leading to a limiting magnitude of 24.0 mag (AB, 10σ for a point source). The observing conditions vary considerably during the three runs, resulting in AO-assisted seeing between 015 and 04. Data reduction was performed using the IRAF package IRCS-IMGRED for flat-field correction, sky subtraction, alignment, and stacking. The stacked image has a resolution of 03 at the position of the quasar.
Table 1. Properties of SDSS J1639+2824
| Quasar | SDSS J1639+2824 |
| R.A. | 16:39:09.10 |
| Decl. | +28:24:47.15 |
| zoptical | 3.82 |
| zCO | 3.840 |
| Lbol | 1048.3 ± 0.1 erg s−1 |
| FWHM(CO) | 495 ± 30 km s−1 |

|
5.59 ± 1 × 10¹⁰ K km s−1 pc2 |
| MBH |
 M⊙ M⊙ |

|
 M⊙ M⊙ |

|
<1.5 × 10¹⁰ M⊙ |
Download table as: ASCIITypeset image
To detect any faint extended host galaxy under the bright nuclear point source, it is crucial to accurately estimate the shape of the PSF at the position of the QSO. Having a PSF star close to the quasar and at the same distance from the GS are critical to this task, since we minimize PSF shape variability given that the FoV contains only very few stars for detailed PSF shape modeling. We fit the PSF star with a set of Gaussian (for the core) plus Moffat (for the extended wing component) profiles to create a high signal-to-noise ratio (S/N) PSF model that is then scaled and subtracted from the quasar using GALFIT (Peng et al. 2010) as shown in Figure 1. For our analysis we consider the effect of a color-dependent PSF shape typically affecting diffraction limited observations to be not significant (see, e.g., Decarli et al. 2012; Mechtley et al. 2012, 2016) since our observations are dominated by seeing and a position dependence rather than reaching the diffraction limit due the weather. Nevertheless, we are aware of this potential uncertainty that would have given us a more conservative host detection given the difference in color between the PSF star (H − K = 0.1 mag) and quasar (H − K = 0.6 mag) since bluer objects tend to be narrower (Bahcall et al. 1997), which, on the other hand, would have made a potential detection easier.
2.2. Subaru/IRCS Spectroscopy
A robust estimate of the SMBH mass is crucial to investigate the coevolution of the SMBH with its host. The SDSS DR7 quasar catalog provides an SMBH mass based on the broad C iv line of MBH = 2.9 × 10¹⁰ M⊙ (Shen et al. 2011; see Figure 2). The SDSS spectrum of J1639+2824 shows broad absorption line features possibly affecting the UV-line based BH mass and since C iv is known to be problematic as an SMBH mass estimator for luminous active galactic nucleus (AGN; Shen & Liu 2012; Trakhtenbrot & Netzer 2012). Therefore, we obtained a spectrum covering the Hβ emission line using the Subaru/IRCS at the K band in 2012 May and 2016 February to independently verify the mass estimate. The Hβ line is well detected in both epochs, which are corrected for galactic extinction (although the effect is <0.01 mag) and combined into the spectrum shown in Figure 2. We fit the Hβ line profile with a model consisting of a power law for the local continuum, a single Gaussian for the broad Hβ line, and a double Gaussian for [O iii] λλ4959, 5007. While the [O iii] detection is tentative, this does not affect the fit of the Hβ line. We perform our spectral measurement based on this best-fit model, shown in Figure 2.

Figure 2. Left: the SDSS/BOSS optical spectrum of SDSS J1639+2824. Right: the rest-frame broad Hβ line in units of 10−17 erg s−1 cm−2 Å−1. The best fit, shown by the red solid line, comprises a power-law continuum (black dashed line), a single-Gauss model for the broad Balmer line (blue), and the tentative [O iii] detection (green).
Download figure:
Standard image High-resolution image2.3. ALMA CO(4 − 3) Observations
We observe the CO(4 − 3) line of J1639+2824 using ALMA by observing at 95.25 GHz (program ID: ALMA #2015.1.01602.S) on 2015 October 31 for 52.9 minutes (21.7 minutes on-source) using 36 antennas at baselines ranging from 84 to 16,196 m. The flux and bandpass calibrations were done by observing J1751+0939; J1647+2705 was used as the phase calibrator. The raw visibilities were calibrated with the ALMA data reduction pipeline on CASA 4.5.0, and imaging was carried out with the CASA CLEAN task. We then spectrally binned the data to achieve a spectral resolution of 180 km s−1 and applied Gaussian tapering in the uv-plane beyond 900 kλ, corresponding to a baseline length ≳2800 m, to aid the line detection. The resulting native (i.e., untapered) synthesized beam is 0106 × 0065, and the tapered beam is 0187 × 0130. In Figure 3, we show the CO(4 − 3) map and the spectrum of the line. The CO redshift is zCO = 3.840, slightly offset from the optical redshift of z = 3.82, based on the broad Hβ emission line. The CO(4 − 3) line is detected at 9.0σ in the tapered map, with the detection being 5.9σ in the native resolution map, indicating that emission is spatially resolved at these scales. The dust continuum is not detected. We estimate the CO(4 − 3) line luminosity to be L' = 5.59 ± 0.6 × 10¹⁰ K km s−1 pc2. We do not see any sign of rotation in the position–velocity-diagram, but given the few velocity bins of the CO spectrum, we cannot make any definite statement if rotation is present or not.
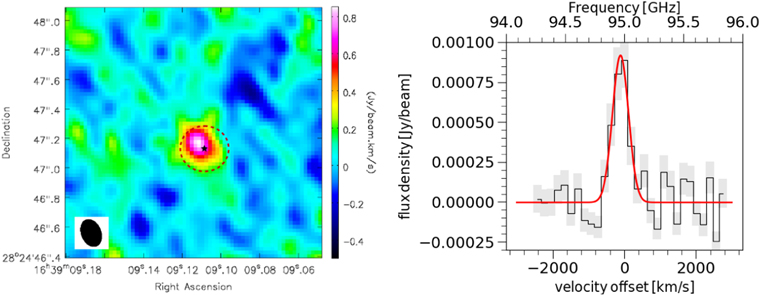
Figure 3. Left: ALMA observations of CO(4 − 3) emission at 02 resolution (synthesized beam shown in the bottom left). The position of the AGN from the optical/near-infrared image is marked with a cross and the typical seeing is shown as a dashed circle. Right: spectrum of CO(4 − 3); the best-fit Gaussian model is shown in red.
Download figure:
Standard image High-resolution imageWe observe that the CO(4 − 3) extent is marginally spatially resolved at the native resolution because the aforementioned application of Gaussian tapering results in a slightly higher S/N (≃7 versus 9). As such, we measure the intrinsic source size in the uv-plane, which can utilize the information from longer baselines, unlike an image-based measurement that is inherently limited by the native resolution corresponding to the median baseline length. We carry out the uv-based size measurement using GILDAS (version jul18a). The CASA-calibrated visibilities at the channels containing the CO(4 − 3) line (Figure 3, right panel) were spectrally and temporally averaged and then exported to GILDAS. We fitted source models to the visibilities using the task uv_fit and subtracted the models from the data. We find that a uniform residual noise is achieved when an elliptical Gaussian model is adopted. In the fit, all parameters of elliptical Gaussian models, including the centroid, flux, major/minor axes, and position angle, are free (i.e., not fixed). The dirty image of the CO(4 − 3) emission, the best-fit model, and the residual are shown in Figure 4. The best-fit source model is described by an elliptical Gaussian with a major FWHM of 120 ± 31 mas, minor FWHM of 54 ± 18 mas, and PA of 7 ± 12 deg. This source extent is adopted for the dynamical modeling in Section 3.2.
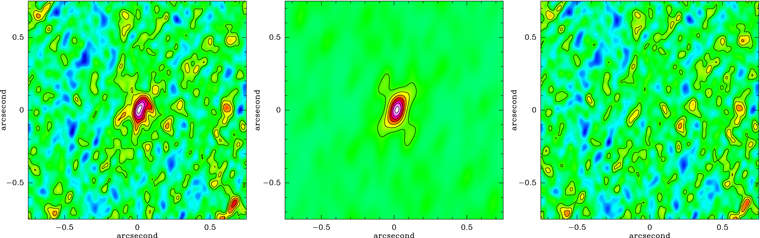
Figure 4. Best direct uv-plane fit model from GILDAS adopting an elliptical Gaussian model. The images show the dirty image (left panel), model convolved with the dirty beam (middle panel), and the residual image (right panel).
Download figure:
Standard image High-resolution image3. Results
3.1. Stellar Mass of the Host Galaxy
The Subaru/IRCS K-band image shows that the surface brightness profile of the rest-frame optical emission is well characterized by an unresolved point source as shown in Figure 1 based on a model of the PSF and the subtraction of it from the total K-band emission. That is, we do not detect any extended emission originating from the stellar component of the host galaxy. The surface brightness profiles of the PSF and QSO are apparently identical, further assuring that our analysis is robust against spatial variations of the PSF.
With the nondetection of the host galaxy emission, we place an upper limit on the stellar mass based on the addition of a simulated host galaxy to our K-band image that includes the quasar. A set of synthetic images of the host galaxy is generated, assuming an effective radius of ∼2 kpc that corresponds to 03 at the target redshift and matches our resolution in the final stacked image. Such sizes are typical for massive (Mstellar > 1010 M⊙) galaxies at z = 3 (Trujillo et al. 2004; Akiyama et al. 2008; Ichikawa et al. 2012; van der Wel et al. 2014). For the model galaxies, we assume either a disk (Sérsic index n = 1) or an elliptical profile (Sérsic index n = 4) having a range of rest-frame U − V colors ( ) to determine the impact of the M/L variation on the detection of the host galaxy. We run our detection routine in the same manner as the original data while recovering the host galaxy at the 3σ level to represent a minimal detection threshold. Two examples of the recovered host galaxies are shown in the top panel of Figure 5 for the two cases n = 1 (simulated Host A) and n = 4 (simulated Host B). For n = 1, we determine an upper limit on the stellar mass to be between
  depending on the color of the host. For n = 4, this limit is typically higher
  . In the bottom panel of Figure 5 we compare our K-band detection limit for the more extreme case of n = 4 with the broadband spectral energy distribution (SED) of the quasar. Due to the brightness of the quasar the galaxy would have to be at least a factor 10–20 more luminous to have any significant impact on the SED, which is well described by the TQSO1 AGN template from Polletta et al. (2007).

Figure 5. Top panel: two simulated host galaxies indicating our detection limit in the K band assuming n = 1 (Host A) and n = 4 (Host B) and an effective radius of 03. Bottom panel: broadband SED of J1639+2824 shown as red squares. In black we show the best-fit AGN model from Polletta et al. (2007). The blue square indicates our upper limit on the galaxy flux in the K band from SUBARU imaging assuming n = 1, and in gray two rescaled galaxy templates (Sc type and early type with an age of 2 Gyr) are shown.
Download figure:
Standard image High-resolution imageIn Figure 6 (left panel), we indicate how far SDSS J1639+2824 is displaced from the local relation (McConnell & Ma 2013) between the mass of SMBHs and their total stellar mass. Considering the local relation (dashed line), we expect a stellar mass over an order of magnitude greater than our mass limit for SDSS J1639+2824. Taking into account biases in the selection of luminous quasars (e.g., Lauer et al. 2007; Schulze & Wisotzki 2011; Portinari et al. 2012), we still would expect a higher stellar mass ( M⊙), based on the black curve in Figure 6, compared to our upper limit. At the very least, SDSS J1639+2824 is offset by 0.3 dex in stellar mass for a compact red host galaxy. The offset may even be larger when considering the bulge mass since our estimates are based on a disk-dominated host galaxy rather than a bulge-dominated system.

Figure 6. Left: position of J1639+2824 in the BH mass–stellar mass plane. We show two upper limits as derived from our Subaru K-band imaging, assuming a host galaxy effective radius of 2 kpc and a Sérsic index of n = 1, and a range in rest-frame U − V colors. For comparison, a literature compilation of z = 6 QSOs (Wang et al. 2016; Izumi et al. 2019) is shown together with the local relation from McConnell & Ma (2013) and a prediction for the relation at z = 3 that corrects for typical selection biases at the high-mass end. Right: same as the left panel, but with the upper limit for SDSS J1639+2824 as derived from the dynamical mass (adopting an inclination angle of 20 deg) inside 0.9 kpc and accounting for BH and molecular gas mass for the most conservative scenario. In addition, we also show the 1:1 relation between both properties as a dashed line.
Download figure:
Standard image High-resolution image
3.2. Dynamical Modeling with CO(4 − 3)
To further assess the lack of stellar material surrounding SDSS J1639+2824, we use ALMA to measure the dynamical mass within a half-light radius using the CO(4 − 3) line. CO emission is detected with ALMA at 9σ and is spatially resolved (Figure 3). We estimate the dynamical mass following two approaches, including that given in Tan et al. (2014) for the spherically symmetric case (Equation (1)),

where σ is the FWHM of the CO line divided by 2.35, G is the gravitational constant, and r1/2 is the half-light radius. For the dynamical mass measurement we note that two assumptions are made: (I) the CO emission is gravitationally bound; (II) for the inclination angle measurement we assume that the intrinsic shape of the galaxy is perfectly symmetric. Second, we consider the case of a rotating thin disk model by the following equation:
where ΔvFWHM is the FWHM of the CO emission line, r1/2 is the half-light radius, and i is the disk inclination angle. We perform a fit to the CO spatial distribution of the emission with an elliptical Gaussian model to determine r1/2 and i. The disk inclination (i = 64° ± 13°) is derived from the ratio of the deconvolved sizes of the minor and major axes, 005 ± 002 and 012 ± 003, respectively. We find that the CO gas traces a very compact region of 0.9 ± 0.2 kpc in diameter, which is smaller than the typical sizes of [C ii] regions observed in z = 6 quasars (≃3 kpc; e.g., Wang et al. 2016). From the CO profile, we estimate the FWHM of the line to be 495 km s−1. We find a dynamical mass of  for case I. For case II, we estimate a dynamical mass of
  , which is well below the BH mass, although the value strongly depends on the inclination angle. We further adopt a value of 20 deg, which is within the range for a similarly massive quasar (Wang et al. 2016) that results in a dynamical mass of
  . This dynamical mass is comparable to those that have been observed for QSO host galaxies at z ∼ 6 using [C ii] (Figure 6, right panel; see Wang et al. 2016 for a recent compilation). Strikingly, the ratio MBH/Mdyn is 0.6 for SDSS J1639+2824 assuming the spherical symmetric case or for a rotating disk, which is a factor of 50 higher than the 21 systems at z = 6 (MBH/Mdyn ∼ 0.1) of Wang et al. (2016) as shown in Figure 6. The rotating disk case has significantly larger error bars given the uncertainties in velocity, radius, and inclination angle, but considering an inclination angle as low as i = 10° the mass would be
  , still more than 1σ offset from the black curve shown in Figure 6.
On the contribution from the gas mass to the dynamical mass, we estimate the total gas mass from the CO luminosity. Here, we assume a ratio r(4 − 3)/r(1 − 0) of 10 (Carilli & Walter 2013) to estimate the CO(1 − 0) luminosity. With an assumption of XCO = 0.8 (Carilli & Walter 2013), the molecular gas mass is  . Using the Milky Way value of XCO = 4, the gas mass is
  , which would further reduce the potential stellar mass estimate in the case of a rotating disk.
We then place a constraint on the stellar mass contribution to the dynamical mass since the SMBH and molecular gas account for a significant fraction (∼60%) of the total mass. It is not surprising that the velocity field of the CO gas is affected by the SMBH since the sphere of influence of the SMBH is larger than the beam size of ALMA based on an estimate assuming a velocity dispersion σ = 200 km s−1. Accounting for these components, we find the limit on the stellar mass to be Mstellar < 1.5 × 10¹⁰ M⊙ by applying conservative assumptions on the dynamical mass and gas mass. In Figure 6 (right panel), we indicate the stellar mass limit for SDSS J1639+2824 based on dynamical arguments given above. We further confirm with ALMA the extreme offset of SDSS J1639+2824 due to its upper limit on the stellar mass content in relation to that expected based on the local mass relation. This rules out a massive and compact stellar host that we might have missed with the Subaru observations, although our resolution is a factor three lower than the size limit estimate from ALMA. Based on our simulations any significant stellar component on larger scales would have also been detected in the K-band image as long as the stars are not tidally stripped or have low surface brightness levels well below our detection limit. In addition, we cannot entirely rule out a strongly extincted host galaxy, although we do not see any evidence for significant extended dust affecting the quasar spectrum. On the other hand, we cannot fully rule out a major merging system, although it should also be visible in the gas component that does not show any such asymmetries or close companions. This may support a scenario where the growth of the SMBH precedes that of its host galaxy.
3.3. A Check on the SMBH Mass Measurement Using Hβ
With such a disparity between the SMBH mass and that of its host, this may bring into question the accuracy of the SMBH mass estimate based on C iv that can be susceptible to non-Keplerian effects such as outflows. To address this issue, we use our Subaru/IRCS NIR spectrum to measure the velocity width of the Hβ emission line. We find a broad FWHM of 7800 ± 900 km s−1 and a continuum luminosity  erg s−1 (Figure 1, right panel). We use these measurements to estimate a SMBH mass
  M⊙ based on the recipe given in Vestergaard & Peterson (2006), which is remarkably consistent with the C iv SMBH mass estimate given the typical large systematic errors of 0.3 dex for Hβ and 0.4 dex for C iv. We derive a bolometric luminosity of Lbol = 1048.3 ± 0.1 erg s−1 using a bolometric correction factor to L5100 of 9.2 (Shen et al. 2008) and thereby an Eddington ratio Lbol/LEdd = 0.69, showing that the quasar is still accreting at a significant level.
4. Caveats and Uncertainties
Although, J1639+2824 appears to be an extreme outlier in terms of BH–host galaxy coevolution there are still several caveats that can have a significant impact on the interpretation of the presented data.
First, we note that our stellar mass limits can be significantly higher if the stellar component of the galaxy is more compact as indicated by our ALMA data (e.g., Ribeiro et al. 2016) with a size falling below the resolution (e.g., 1 kpc) of our image. Although, an extremely high stellar mass would be mostly inconsistent with our dynamical mass. To test this we stack the best seeing IRCS K-band data (∼016) and make a new set of simulations with a smaller host galaxy size constraint by the ALMA observation. Even for such small sizes, we can still rule out extreme cases where Mstellar > 1012 M⊙, a value expected given the local SMBH–galaxy mass relation, since we would easily detect extended emission after subtraction of the PSF as long as the host galaxy profile does not follow, e.g., a truncated disk. Another uncertainty is the possibility that a substantial amount of stars exist at very low surface brightness levels and very far outside of our ALMA beam on scales of several kiloparsecs. This would be an interesting scenario if most of the stars are stripped away from the BH to a very low surface brightness. Such a scenario can only be tested in the James Webb Space Telescope era or with the next generation of large telescopes.
Second, we emphasize that there are significant uncertainties in the size estimation from the uv-model fit. Although the nominal fit errors appear to be small using the elliptical Gaussian model, further tests have shown that the inclination angle could have a considerably larger uncertainty given that more circular Gaussian models give reasonably well residuals, which would leave the inclination angle being rather unconstrained. We therefore consider the possibility of having an inclination angle as low as 10 deg. Below 10 deg the dynamical mass would increase significantly and below 5 deg would be in conflict with the stellar mass estimates from the simulations and the SED of the quasar.
Third, if the inclination angle, on the other hand, is indeed significantly higher than our adopted value of 20 deg, the dynamical mass could be as low as  for the nominal inclination angle estimated from our best-fit elliptical Gaussian model. Such a low dynamical mass would raise the question if the BH mass estimate is correct, although it would have little impact on the ratio between BH and galaxy stellar mass. Since we do not have any reverberation mapping data for such a luminous and massive BH we cannot exclude the possibility that the single-epoch mass estimations are significantly wrong even for the Hβ line given that there are currently no counterparts in our target luminosity range in the local size–luminosity relation (Bentz et al. 2009).
Fourth, if the BH estimate is correct, we would expect the sphere of influence to be well above 1 kpc (except for some exceptionally large σ) and therefore much larger than our ALMA beam. We cannot exclude the possibility that such a large sphere of influence would especially affect our dynamical mass estimate since we are not resolving any sign rotation. This may be one of the most significant caveats that we cannot rule out with the current data set.
5. Final Remarks
SDSS J1639+2824 is a very massive SMBH at z = 3.840 that appears to have had a unique formation history given the extreme mass ratios,  and
and  , even when the typical systematic uncertainties of 0.3–0.4 dex, in particular for the BH mass, are taken into account. We note again that our dynamical mass limits crucially depend on the assumed inclination angle that would have to be extremely small (<10 deg) to significantly increase the stellar mass of the host. A likely explanation for such an overmassive SMBH is a rapid inflow of gas that was consumed by the SMBH at a high efficiency, possibly in an earlier phase of super-Eddington accretion (e.g., Pezzulli et al. 2017) proceeded by a massive seed SMBH (Bromm & Loeb 2003; Begelman et al. 2006), thus resulting in substantial mass growth (e.g., Volonteri & Rees 2005), while subsequent feedback then blew out most of the remaining gas that would normally be converted into stars. The low gas fraction, observed by ALMA, is atypical for a star-forming galaxy at high redshift, thus possibly supportive of this scenario. Finally, with the SMBH still accreting gas and the limited gas reservoir to form stars, we can safely claim that the SMBH will maintain its position well displaced from the local BH–host galaxy mass relation. Therefore, it is unclear as to how such a galaxy will form its stars to align with the local mass scaling relations; only the further inflow of gas or supply of stars may do the job.
This paper makes use of the following ALMA data: ADS/JAO.ALMA#2015.1.01602.S. ALMA is a partnership of ESO (representing its member states), NSF (USA) and NINS (Japan), together with NRC (Canada) and NSC and ASIAA (Taiwan) and KASI (Republic of Korea), in cooperation with the Republic of Chile. The Joint ALMA Observatory is operated by ESO, AUI/NRAO, and NAOJ.