


Abstract
We characterize the variability in nearly continuous optical observations of nine active galactic nuclei (AGNs) detected with the Fermi Gamma Ray Space Telescope Large Area Telescope (Fermi-LAT), obtained during the K2 mission with the Kepler spacecraft with 1-minute or 30-minute cadences. The binary black hole candidate OJ 287, six other γ-ray blazars, the lobe-dominated radio quasar 3C 207, and the X-ray-bright quasar RBS 1273 were observed. The most dramatic variability was seen in PKS 1352−104, which varied by a factor of six in 4 days. OJ 287 varied by a factor of 2.8, six other blazars varied by factors of 1.14–2.23, and RBS 1273 varied by a factor of only 1.03. Power spectral densities (PSDs) were calculated for each object. Six of the nine AGNs were detected by the Fermi-LAT during the K2 observations. The slopes of the PSDs for these six contemporaneously detected AGNs were not significantly different from the slopes of the three contemporaneously undetected AGNs. The PSD slopes of the three BL Lac objects and the four flat-spectrum radio quasars were not significantly different, consistent with the relativistic jet acting as the dominant source of the emission in both subclasses of blazars. Overall, the slopes of most PSDs are consistent with turbulence in the relativistic jet, but the steepest PSDs require the addition of another mechanism that produces additional flux variations on timescales of several days during major flaring episodes.
Export citation and abstract BibTeX RIS
1. Introduction
The immense powers, nonthermal spectra, and rapid variability that characterize blazars, the class combining BL Lacertae objects (BL Lacs) and flat-spectrum radio quasars (FSRQs), can be understood within the framework of matter flowing through accretion disks (ADs) onto supermassive black holes (SMBHs), with a modest fraction of that matter, but a significant fraction of that energy, ejected in relativistic jets. The bulk of the tremendous energy released in nearly all active galactic nuclei (AGNs) originates from within tens of gravitational radii of the SMBH in an AD; part of the energy often is channeled outward via oppositely directed relativistic jets that emit synchrotron radiation, producing radio-loud AGNs. This jet emission is greatly amplified by Doppler boosting when one of those jets is pointed within a few degrees to our line of sight, as in blazars (e.g., Urry & Padovani 1995). The optical flux coming from the jet may originate predominantly in a single dominant component, for example, a shocked region during a major flare (e.g., Hughes et al. 1985; Marscher & Gear 1985), or the bulk of the variable optical emission may come from a multitude of turbulent cells behind a shock in the jet (e.g., Marscher 2014; Calafut & Wiita 2015).
Optical variability in blazars could originate in the relativistic jets or in the AD. When BL Lacs and FSRQs are in a high state, and often detectable in the γ-ray band by Fermi Gamma Ray Space Telescope Large Area Telescope (Fermi-LAT; Atwood et al. 2009), e.g., 3C 454.3 in 2010 (Wehrle et al. 2012), synchrotron emission from the relativistic jet overwhelms emission from the AD, and we can study the properties of the relativistic jet itself. When FSRQs are in their lowest state, the AD can become visible as multitemperature thermal emission seen as a big blue bump using multiband filter photometry or spectra (e.g., Sun & Malkan 1989). The optical emission from most BL Lacs is believed to be dominated by synchrotron emission, even when they are in low states. During low and high states, which can differ by 2–4 mag, the dominant light source determines the variability characteristics of the FSRQs, which are normally studied by examining the power spectral densities (PSDs) of their light curves. Blazars emitting high-energy gamma-rays are the most extreme members of the blazar class; their bright emission across the electromagnetic spectrum and their rapid variability make them high-payoff objects for study of physical processes in AGNs. The original Kepler field of view contained no known gamma-ray blazars, but the K2 mission (whose field of view moves along the ecliptic; Van Cleve et al. 2016) provided the first opportunities to study the optical light curves of these extreme AGNs at essentially uniform temporal intervals over extended periods of ∼75 days.
While large flares have long been associated with the ejection of new components into jets or the formation of shocks within them (Hughes et al. 1985; Marscher & Gear 1985), turbulence behind those shocks probably plays a major role in the multiwavelength variations seen on shorter timescales (e.g., Marscher 2014). Recently, a self-consistent theory of relativistic turbulence has been developed (Zrake & MacFadyen 2013), and it has been employed to model emission from blazar jets (Calafut & Wiita 2015). The combination of emission from the changes in the bulk jet motions and the turbulence within them can now be modeled and allows us to characterize the strength of the turbulence by examining light curves and PSDs (Pollack et al. 2016.)
OJ 287 is a particularly exciting target because it is one of the most optically variable blazars known and almost certainly houses a binary SMBH, with major flares recurring every ∼12 yr (Sillanpää et al. 1988). The times of these large flares can be nicely predicted, through a model involving the impacts of the secondary SMBH on the AD surrounding the primary SMBH, when general relativistic effects are taken into account (Valtonen et al. 2008). This model gives quite precise values for the masses of the SMBHs, the spin of the primary SMBH, and the eccentricity of the orbit (Valtonen et al. 2016, and references therein). The historic range of OJ 287 is ∼4 mag, from V = 13.0 to V = 17.0 (Miller et al. 1976; Webb et al. 1988; Bhatta et al. 2016; Gupta et al. 2017; Rakshit et al. 2017). On timescales of weeks to months, the source is known to vary by over a magnitude, and on timescales of days to weeks, it varies by up to 1 mag (Pursimo et al. 2000). Rapid optical variability on timescales of tens of minutes to hours, known as microvariability or intranight optical variability, has been reported by a number of observers, culminating in the conclusive detection of microvariability in OJ 287 by Carini et al. (1992). At these timescales, which are the most rapid measurable from ground-based observatories, the source can vary as fast as 0.1 mag in an hour (Carini et al. 1992). In addition to its high degree of variability on multiple timescales, OJ 287 is the blazar with the most numerous suggestions of periodicities in its optical variations. The longest and best-defined quasi-periodic component is the above-mentioned approximate 12 yr period ascribed to the presence of a binary SMBH (Sillanpää et al. 1988; Valtonen et al. 2008, 2016). Multiple claims of short periods (P < 1 day) have been made but not confirmed (e.g., Frohlich 1973; Visvanathan & Elliot 1973; Kiplinger 1974; De Diego & Kidger 1990). Longer periods (tens of days) have also been claimed by Wu et al. (2006) and more recently by Pihajoki et al. (2013). Possible quasi-periodicities of ∼400 and ∼800 days have also been argued for in recent work (Bhatta et al. 2016). The K2 observations of OJ 287 shortly preceded a major outburst that occurred, as predicted, in late 2015, peaking on 2015 December 5; it included a major thermal component (Valtonen et al. 2016). Several other strong flares were seen in late 2015 and early in 2016 (Gupta et al. 2017; Rakshit et al. 2017; Kushwaha et al. 2018). OJ 287 is also bright enough to be a target for the Event Horizon Telescope (Gómez 2016).
OJ 287 and the other γ-ray blazars have been detected intermittently over the 9 yr of Fermi-LAT operation (e.g., Acero et al. 2015; 3FGL). Hodgson et al. (2017) combined 86 GHz global mm-VLBI measurements with other radio intensity measurements and the Fermi-LAT fluxes to estimate the locations and magnetic field strengths of the γ-ray-emitting regions in OJ 287. Some blazars have shown simultaneous optical and γ-ray flares, or simply showed increased activity at both wavebands without a one-to-one correspondence of flares. Ensemble studies have been presented by Cohen et al. (2014) and Hovatta et al. (2014). Very active γ-ray blazars with extensive multiwavelength campaigns include 3C 279 (Hayashida et al. 2012, 2015), 3C 454.3 (Wehrle et al. 2012; Jorstad et al. 2013), PKS 1510–018 (Abdo et al. 2010; Orienti et al. 2013), and BL Lac (Wehrle et al. 2016).
We describe the selection of nine γ-ray blazars in K2 Campaigns 1, 5, and 6 in Section 2. Observations of more γ-ray blazars, including 3C 273, made during subsequent K2 campaigns, will be reported in a subsequent paper. In Section 3 we describe the K2 observations, data reduction, and analysis of the light curves. In Section 4, we discuss the K2 optical results including PSDs. Our Fermi-LAT data analysis and the results from it are given in Section 5. We discuss our results in Section 6 and give our conclusions and summary in Section 7.
2. The Blazar Sample Selection
We chose our nine γ-ray blazar targets (Table 1) by searching the Fermi-LAT Second AGN Catalog (2LAC; Ackermann et al. 2011) for the optically brightest blazars in K2 Campaign 1, 5, and 6 fields (programs GO1020, GO5053, and GO6015, respectively, with principal investigator A. Wehrle, and short-cadence program GO5038 on OJ 287, with principal investigator R. Edelson). Updated γ-ray names from the Fermi-LAT Third Source Catalog (3FGL; Acero et al. 2015) are used in Table 1 where available. We note that our observations of two additional blazars during the science test Campaign 0 (program GO0074) were too affected by instrumental artifacts to be useful for PSD analysis. The nine γ-ray blazars in the three fields have estimated K2 optical magnitudes Kp brighter than 18.3 in the 420–900 nm band in the K2 EPIC catalog (Huber et al. 2016; Huber & Bryson 2018 and references therein), which was generally drawn from the USNO-B and SDSS catalogs. OJ 287 is the brightest with Kp = 14.7. Three are classed as BL Lacs, four as FSRQs, one (RBS 1273) is an X-ray-survey-selected AGN, and one (3C 207) is classed as a lobe-dominated radio quasar (LDRQ). 3C 207 might be expected to be somewhat less variable, as it presumably benefits from less Doppler boosting. Redshifts ranged from 0.198 to 2.15.
Table 1. Targets
| Name | EPIC ID | Fermi-LAT | Kpa | z | Class | K2 | Campaign | Notes |
|---|---|---|---|---|---|---|---|---|
| Name | Program | Field | ||||||
| PKS B1130+008 | 201503438 | 3FGL J1132.7+0034 | 17.995 | 1.22 | BL Lac | GO1020 | 1 | ⋯ |
| WB J0905+1358 | 211559047 | 3FGL J0905.5+1358 | 16.404 | (2.065)b | FSRQ | GO5053 | 5 | 1 |
| 3C 207 | 211504760 | 3FGL J0840.8+1315 | 18.264 | 0.6808 | LDRQ | GO5053 | 5 | ⋯ |
| RGB J0847+115 | 211394951 | 3FGL J0847.1+1134 | 17.389 | 0.198 | BL Lac | GO5053 | 5 | 2 |
| OJ 287 | 211991001 | 3FGL J0854.8+2006 | 14.7 | 0.3056 | BL Lac | GO5053, GO5038c | 5 | ⋯ |
| PKS 1329−049 | 229227170d | 3FGL J1332.0−0508 | 18.200 | 2.15 | FSRQ | GO6015 | 6 | ⋯ |
| RBS 1273 | 212800574 | 3FGL J1329.1−0536 | 15.201 | 0.576 | X-ray AGN | GO6015 | 6 | ⋯ |
| PKS 1335−127 | 212489625 | 3FGL J1337.6−1257 | 17.851 | 0.539 | FSRQ | GO6015 | 6 | ⋯ |
| PKS 1352−104 | 212595811 | 3FGL J1355.0−1044 | 17.399 | 0.332 | FSRQ | GO6015 | 6 | ⋯ |
Notes. 1. EPIC 211559047 (WB J0905+1358): The target is on the edge of the extraction aperture used by EVEREST; as a result, the EVEREST data were noisy. We used the less noisy K2SFF data in our PSDs for this target. 2. EPIC 211394951 (RGB J0847+115): No EVEREST data were available. We used K2SFF data for this target.
aKepler magnitude as tabulated in the EPIC catalog, which was compiled largely from ground-based catalogs USNO-B and SDSS. bRedshift in the SDSS catalog was estimated using multiband photometry from SDSS and has not been confirmed spectroscopically. cGO5038 included the short-cadence data on OJ 287. dThe K2 Project also assigned EPIC ID 229228144 to this target under program GO6062.Download table as: ASCIITypeset image
3. K2 Observations, Data Reduction, and Analysis
A journal of the K2 and Fermi-LAT observations is given in Table 2.
Table 2. Dates of K2 and Fermi-LAT Observations
| K2 Campaign | Dates | MJD | Duration |
|---|---|---|---|
| 1 | 2014 May 30–2014 Aug 21 | 56,807–56,890 | 83 days |
| 5 | 2015 Apr 27–2015 Jul 10 | 57,139–57,214 | 75 days |
| 6 | 2015 Jul 13–2015 Sep 30 | 57,216–57,295 | 79 days |
Download table as: ASCIITypeset image
Each long-cadence light curve yielded ∼3400 29.4-minute ("30-minute") samples, all of which were taken while the spacecraft was either drifting with photon pressure or undergoing thruster maneuvers to return to nominal pointing. The exquisitely balanced design of the K2 mission operation resulted in a small residual drift of a couple of arcseconds per 6 hr interval, compared to the pixel size of ∼4''. Because the amplitudes of the data are affected by the photon-pressure-induced drift and the approximate 6 or 12 hr spacecraft thruster near-periodicity (Van Cleve et al. 2016), we used data corrected by various algorithms developed by K2 community projects (see below). The amplitude data are also affected to a much smaller extent by thermal effects, particularly for 2 to 3 days at the start of each campaign pointing, often with the appearance of a "hook" in amplitudes that is not removed by the various community postprocessing algorithms; we flagged out the hook data in a later step. The short-cadence light curve of OJ 287 yielded 106,669 1-minute samples.
Our previous experience with using the standard Kepler pipeline products (Wehrle et al. 2013; Revalski et al. 2014) has underscored the need to develop analysis techniques that are well matched to our AGN light curves. Standard pipeline data on AGNs often have true astrophysical brightness variations, such as the steepest parts of hours-long flares, removed along with the instrumental effects. We evaluated the quality of light curves produced by the standard processing (SAP, PDCSAP), the K2SFF processing (Vanderburg & Johnson 2014, and later updates online at MAST), and the EVEREST processing (Luger et al. 2016, 2018). We chose the light curves that had the fewest remaining clear instrumental errors, such as isolated single low points, thermal recovery drifts during the first few days in a campaign, and residual 6 hr "sawtooth" amplitude variations, for each object, as some algorithms performed better on some targets than on others, depending on factors such as brightness, location of the target in the field of view, quality of the instrument response on the CCD module, and other instrumental effects. The algorithms sometimes identify and flag suspicious data such as sharply rising peaks in real flares (that is, flares whose profiles look just like those of flares observed from the ground, in our many years of experience). In those cases, we restore the flagged data points individually to the light curves before running the PSD analysis. Similarly, we flag out individual isolated low points (usually related to data taken just before or after a thruster firing) by hand. All uncorrected and corrected light curves were examined before the PSD analysis was run. In all cases, we compared the light curves of several nearby stars and other AGN targets on the same CCD module to check for flux variations in common that were not removed by the processing and that could be mistaken for astrophysical variations if the light curve of our target alone had been examined. Only one target fell on a module affected by medium or high nonlinear amplifier ("Moiré") effects (Kolodziejczak et al. 2010; see also Table 13 of the Kepler Instrument Handbook, Van Cleve & Caldwell 2016). Careful examination of the amplitude variations of the target that fell on a high "Moiré"-affected channel, EPIC 201503438, showed no visible evidence of "Moiré" distortions. We found no evidence of "rolling band" effects.
To establish the overall activity level in the absence of absolute calibration of the K2 light curves, we used 1 m class robotic telescopes available to one of us (Carini) to obtain photometry of OJ 287, to which we added data from the Steward Observatory program led by Smith et al. (2009) and the SMARTS program led by C. Bailyn (see Bonning et al. 2012). The shapes of the K2 and ground-based data, converted to the equivalent K2 counts s−1, are shown in Figure 1 and show good agreement (K2 count rates are relative, not referenced to a standard photometric system).
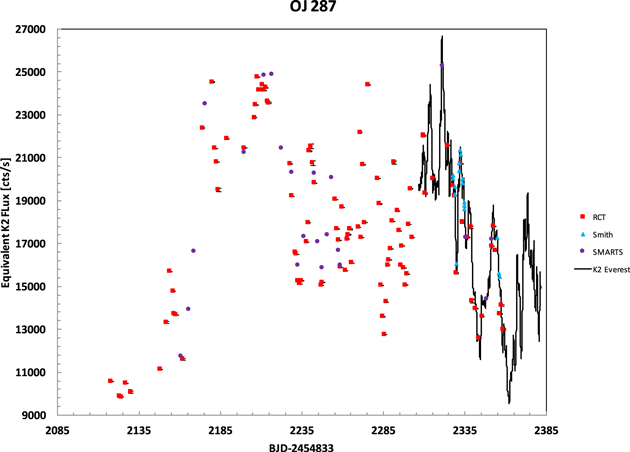
Figure 1. Combined ground-based and K2 (EVEREST version 1 processing) light curve of OJ 287 from 2014 September 17 to 2015 July 14. Ground-based R-band photometry is from the programs of M. Carini (RCT), P. Smith (Steward Observatory), and SMARTS.
Download figure:
Standard image High-resolution imageOur long-cadence observations of OJ 287 achieved a noise level (standard deviation) after EVEREST processing of 18 and 47 counts s−1 (∼0.1%–0.2% on mean brightnesses of 14,195 and 20,445 counts s−1, respectively) during two 0.2-day intervals when the source briefly varied by less than 1%. The short-cadence observations of OJ 287 achieved a noise level after processing of 29 and 47 counts s−1 (∼0.2% and 0.2%) during the same intervals. A 0.7-day interval of short-cadence and long-cadence data is shown in Figure 2; the ∼1.5%–2% offset in amplitudes is caused by different processing of short-cadence and long-cadence data after spacecraft download. All but one of the other targets were much fainter and yielded noise levels of 2.2–5.0 counts s−1, while the brightnesses were 310–11,700 counts s−1, measured during 0.5-day intervals of the light curves that exhibited less than 1% variations.
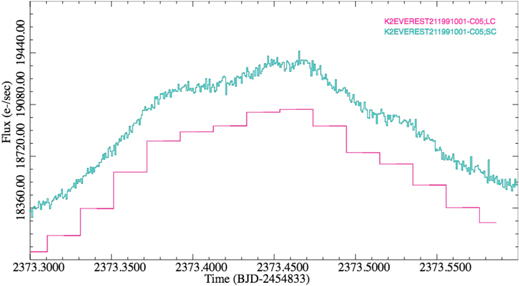
Figure 2. Comparison of long-cadence (30-minute; pink) and short-cadence (1-minute; blue) light curves of OJ 287, spanning 0.7 days. The short-cadence data show subtle and rapid variations in amplitude that are not seen in the long-cadence data that are formed by averaging the short-cadence data. The ∼1.5%–2% offset in amplitudes is caused by different processing of short-cadence and long-cadence data after spacecraft download.
Download figure:
Standard image High-resolution image4. K2 Optical Results
4.1. Light Curves
The K2 light curves for all our targets are shown in the top panels of Figures 3–13. We utilized the light curves resulting from the EVEREST processing of Luger et al. (2016, 2018) and the K2SFF processing of Vanderburg & Johnson (2014), and later updates online at MAST. Characteristics of these light curves are given in Table 3.
Table 3. Slopes of Optical Power Spectral Densities
| Name | EPIC | Average | SDa | Max/Minb | Slope | Fitted | PSRESP | Confidence | Notes |
|---|---|---|---|---|---|---|---|---|---|
| ID | Count | Count | Range | Slope | |||||
| Rate | Rate | (log(ν)) | |||||||
| (counts s−1) | (counts s−1) | (%) | |||||||
| PKS B1130+008 | 201503438 | 884 | 3.3 | 1.22 | −2.02 ± 0.16 | −4.7 to −6.9 | −2.05 ± 0.13 | 53 | ⋯ |
| WB J0905+1358 | 211559047 | 1908 | 3.0 | 1.59 | −3.81 ± 0.29 | −5.6 to −6.9 | −2.52 ± 0.23 | 12 | 1 |
| 3C 207 | 211504760 | 589 | 5.0 | 1.32 | −1.96 ± 0.13 | −4.8 to −6.9 | −2.21 ± 0.11 | 67 | ⋯ |
| RGB J0847+115 | 211394951 | 1800 | 4.8 | 1.44 | −2.60 ± 0.22 | −5.1 to −6.9 | −2.56 ± 0.14 | 38 | 2 |
| OJ 287 | 211991001 | 17001 | 18, 47 | 2.80 | −1.93 ± 0.18 | −4.8 to −6.9 | −2.18 ± 0.06 | 16 | 3 |
| OJ 287 | 211991001 | 17001 | 18, 47 | 2.80 | −2.68 ± 0.13 | −5.0 to −5.7 | ⋯ | ⋯ | 3 |
| OJ 287 | 211991001 | 17001 | 29, 47 | 2.80 | −2.83 ± 0.08 | −2.7 to −5.7 | ⋯ | ⋯ | 4 |
| OJ 287 | 211991001 | 17001 | 29, 47 | 2.80 | −0.35 ± 0.07 | −5.8 to −6.9 | ⋯ | ⋯ | 4 |
| PKS 1329−049 | 229227170 | 310 | 2.3 | 1.14 | −1.97 ± 0.23 | −5.3 to −6.9 | −2.68 ± 0.06 | 79 | 5 |
| RBS 1273 | 212800574 | 11738 | 4.5 | 1.03 | −3.67 ± 0.39 | −5.7 to −6.9 | −3.78 ± 0.15 | 19 | 6 |
| PKS 1335−127 | 212489625 | 1204 | 2.2 | 2.23 | −1.67 ± 0.17 | −4.5 to −6.9 | −1.76 ± 0.08 | 14 | ⋯ |
| PKS 1352−104 | 212595811 | 2418 | 3.9 | 6.24 | −3.37 ± 0.17 | −4.6 to −5.5 | ⋯ | ⋯ | 7 |
| PKS 1352−104 | 212595811 | 2418 | 3.9 | 6.24 | −0.77 ± 0.06 | −5.5 to −6.4 | −0.86 ± 0.11 | 43 | 8 |
| PKS 1352−104 | 212595811 | 2418 | 3.9 | 6.24 | −1.71 ± 0.08 | −4.1 to −6.9 | −1.79 ± 0.09 | 16 | 9 |
Notes. 1. EPIC 211559047 (WB J0905+1358): The target is on the edge of the extraction aperture used by EVEREST; as a result, the EVEREST data were noisy. We used the less noisy K2SFF data in our PSDs for this target. 2. EPIC 211394951 (RGB J0847+115): No EVEREST data were available. We used K2SFF data for this target. 3. EPIC 211991001 (OJ 287): This data set was long-cadence. 4. EPIC 211991001 (OJ 287): This data set was short-cadence. The short-cadence data set was too large for PSRESP to handle. 5. EPIC 229227170 (PKS 1329−049): The target has the noisiest light curve in our sample, which may contribute to the discrepancy between the slopes. 6. EPIC 212800574 (RBS 1273): We included data starting at day 2389. 7. EPIC 212595811 (PKS 1352−104): Data set included the big flare. PSRESP was not fitted independently for this log ν interval. 8. EPIC 212595811 (PKS 1352−104): Data set included the big flare. The fitted PSRESP break was at log ν = −5.58 ± 0.04. 9. EPIC 212595811 (PKS 1352−104): Data set excluded the big flare.
aStandard deviation during 0.2- to 0.5-day intervals when source variation was less than ∼1%. For OJ 287, two standard deviations were measured independently during the only two such intervals in which the source varied less than ∼1%. b(Maximum count rate)/(Minimum count rate).Download table as: ASCIITypeset image
The blazar OJ 287 varied by a factor of 2.8 during our K2 observations, which coincidentally took place just a few weeks before the 2015 December predicted 12 yr peak in activity. One γ-ray blazar, PKS 1352−104, flared by a factor of six for 4 days but showed much more modest variations for the rest of the K2 observations. Six other AGNs varied by modest factors of 1.14–2.23, and one (the X-ray-survey-selected AGN RBS 1273) varied by only a factor of 1.03. Several of the light curves look "spiky," that is, they contain several flares of a few days' duration on top of much smoother baselines, while OJ 287 shows a continuous series of flares on multiple timescales, displaying "fractal variable" behavior. The spiky, flaring light curves could be produced if compact regions within the jet dominated the observed emission through extremely high Doppler boosting, such as in "jet-in-a-jet" or "mini-jet" models (e.g., Giannios et al. 2009), or if associated with the ejection of a new component in a parsec-scale jet (e.g., 3C 454.3; Wehrle et al. 2012; Jorstad et al. 2013), while the always-variable, fractal-type changes could be characteristic of an emission region containing strong turbulence (e.g., Pollack et al. 2016).
We quantified the variations by forming PSDs for each target. The PSD arising from the Fourier transform of the light curve is usually characterized by P(ν) ∝ να, with α < 0, below some break frequency, νb, in Hz. Above νb, the PSD is usually dominated by measurement errors with a white-noise character (α = 0). Such variations signal energy being released over a wide range of timescales. PSDs for our blazars were constructed by calculating the discrete Fourier transforms of the K2 light curves.
When computing the PSDs, the data were end-matched and windowed with a Hamming window function to minimize the effects of red leak (i.e., variability power that is transferred from low frequency to high frequency). These unbinned PSDs are shown in the middle panels of Figures 3–13. The logarithm of the power was then binned by 0.08 in log ν, and a linear fit was determined for the portion of the PSD displaying power-law behavior. These binned PSDs and fits are in the bottom panels of those figures. The error bars represent the rms scatter in the data points in each bin. At longer timescales (log ν < −5.6 or −5.7), there are usually only one or two points per bin. Bins with only one data point show only that point with no error bars. Two points far apart in one bin will have large error sizes on the plot. For fitting the red-noise power-law slope, we identified the break frequency (upper limit of log ν for computing the PSD) at which the binned logarithm of the power clearly deviated from a white-noise character (α = 0) by inspection. We chose the lower limit of log ν for fitting the red-noise slope based on where the binned logarithms showed a change in character from roughly linear to erratic and sparse.
In order to obtain independent validation of our PSD slopes, we also applied the PSRESP method (Uttley et al. 2002) to the K2 EVEREST- and K2SFF-processed light curves. Simulated light curves with a range of PSD slopes below a break frequency and slopes of 0 above the break frequency were created, and the sampling pattern of the observed light curve was applied to them prior to measuring their PSD. For each slope/break frequency combination, 100 light curves are simulated; for each one the sampling pattern of the observed light curve is applied and the PSD is measured. The 100 simulated PSDs are then averaged to determine the shape of the underlying PSD; the spread of the average simulated PSDs about the mean provides an estimate of the error. The slopes with the highest confidence factors determined from the PSRESP analysis are presented in Column (8). Our PSD slopes and those returned by the PSRESP method agree to within a 2σ error in all cases. The PSD slopes showed no correlation with redshift. The lack of correlation may be due to the wide range of observed emitted frequencies in the optical observing band corresponding to the redshift range of 0.198–2.15 or to intrinsic differences in the AGN.
All of the PSDs of the long-cadence light curves showed red noise on timescales longer than 3.5–139 hr corresponding to break frequencies with log ν = −4.1 to −5.7, with white noise on shorter timescales. We looked for a correlation between the optical brightness and the measured frequency at which white noise begins to dominate the PSD. No such correlation was found, implying that the white-noise turnover may be affected by the noise properties of individual CCD modules on the K2 focal plane, or affected by some as-yet-unknown astrophysical cause of high-frequency white noise in the blazars. However, for the bright target OJ 287, white noise in the long-cadence data may be affected by averaging over intrinsic variations, as can be seen in a comparison of long-cadence to short-cadence data in Figure 2. When the short-cadence data were averaged by the onboard spacecraft processing to make the long-cadence data, OJ 287's intrinsic "red-noise" variability on timescales between 0.5 and 17.5 hr (log ν = −3.3 and −4.8), shown in Figure 4, was replaced by white noise (Figure 3).
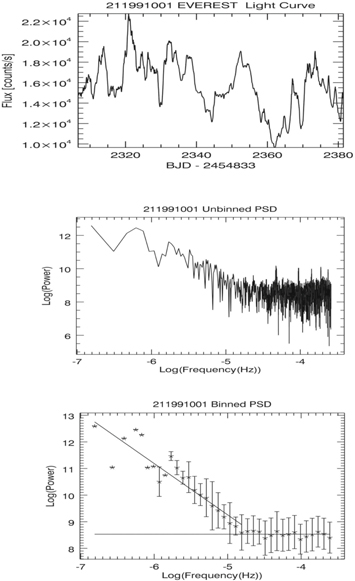
Figure 3. EPIC 211991001 (also known as OJ 287 and 3FGL J0854.8+2006) long-cadence light curve as processed by EVEREST, unbinned PSD, and binned PSD. The fitted slope of −1.93 ± 0.18 for the red-noise part between log ν = −4.8 and −6.9 is shown. Instrumental white noise occurs at frequencies higher than log ν = −4.8.
Download figure:
Standard image High-resolution imageIn addition, for OJ 287 observed in short-cadence mode, we originally found a plateau in the PSD between log ν = −4.2 and −3.8, corresponding to timescales between 4.4 and 1.8 hr, with an additional red-noise slope α of −2.29 ± 0.09 between log ν = −3.8 and −3.3 (1.8 hr–33 minutes), and white noise at shorter timescales. In order to eliminate the possibility that this plateau was due to sampling effects in the short-cadence light curve, we employed the DFOURT and CLEAN methodology (Roberts et al. 1987; Hoegbom 1974). The CLEANed PSD showed no evidence of this plateau and displays a power-law slope from log ν = −2.7 to −5.7 with a slope of −2.83 ± 0.08, appearing to flatten to a slope of −0.35 ± 0.07 from log ν = −5.8 to −6.9. OJ 287's short-cadence PSD slope of −2.83 is steeper than the long-cadence PSDs of the FSRQs we earlier observed with Kepler (Wehrle et al. 2013; Revalski et al. 2014), but similar to those seen in Kepler data for a few Seyfert galaxies (Mushotzky et al. 2011). We summarize the variability amplitudes, PSD slopes, and break frequencies in Table 3.
5. Fermi-LAT Observations
We processed the Pass 8 data (Atwood et al. 2013) from the Fermi Science Support Center for three fields with radius 20°. Each Fermi-LAT field was centered on one of the K2 target blazars in K2 Campaigns 1, 5, and 6 and was large enough to include all the targets observed with K2. The time ranges (83, 75, and 79 days each) spanned the corresponding K2 observing dates. The energy range covered 0.1–500 GeV. We used version v10r0p5 of the Fermi-LAT Science Tools. We selected only "SOURCE class" events (parameters "evclass = 128, evtype = 3"). The maximum zenith angle was set to 90°. For models of the diffuse emission, we used gll_iem_v06.fits and iso_P8R2_SOURCE_V6_v06.txt. We used the spectral parameters of the 3FGL (Acero et al. 2015) by applying the python script "make3FGLxml.py" to "gll_psc_v16.fit" as starting values for the likelihood calculations for the K2 targets in our field, as well as other bright sources within a 30° radius, with two exceptions. For OJ 287, we used a power-law model for simpler comparison to the other blazars instead of its log-parabola model in the 3FGL. For the "changing-look" millisecond pulsar 2FGL J1023.6+0040, we used the 2FGL "log-parabola" model (Nolan et al. 2012; 2FGL catalog) because the usually faint pulsar does not appear in the 3FGL catalog. Upper limits at the 95% confidence level for targets not detected with the initial processing were calculated using the fermiPy "UpperLimits" script (Wood et al. 2017, https://github.com/fermiPy/fermipy/tree/master/fermipy) in the energy range 0.1–300 GeV. None of the targets showed evidence of variability during the K2 observations in the online database for the Fermi All-sky Variability Analysis (Abdollahi et al. 2017, https://fermi.gsfc.nasa.gov/ssc/data/access/lat/fava_catalog/).
For our K2 targets, we computed power-law spectral indices, fluxes, and test statistic (TS) values. Of the nine K2 targets, we detected four above TS = 25 (≳5σ), we obtained weaker (≳4σ) detections of two more with TS between 17 and 25, and we found upper limits for the remaining three targets (Table 4).
Table 4. Fermi-LAT Results
| Name | EPIC | Fermi | γ-ray | γ-ray | Test | 3FGL γ-ray | 3FGL γ-ray | 3FGL |
|---|---|---|---|---|---|---|---|---|
| ID | Source | Fluxa | Flux Errora | Stat- | Fluxb | Flux Errorb | Detection | |
| Name | (photons s−1 cm−2) | (photons s−1 cm−2) | istica | (photons s−1 cm−2) | (photons s−1 cm−2) | Signif- | ||
| icance σ | ||||||||
| PKS B1130+008 | 201503438 | 3FGL J1132.7+0034 | 2.34 E-8 | 7.40 E-9 | 40.8 | 2.13 E-09 | 1.37 E-10 | 27.5 |
| WB J0905+1358 | 211559047 | 3FGL J0905.5+1358 | 4.89 E-9 | 3.53 E-9 | 43.8 | 1.05 E-09 | 1.05 E-10 | 16.6 |
| 3C 207 | 211504760 | 3FGL J0840.8+1315 | <3.12 E-8 | ⋯ | ⋯ | 5.18 E-10 | 8.29 E-11 | 9.2 |
| RGB J0847+115 | 211394951 | 3FGL J0847.1+1134 | 9.38 E-9 | 7.06 E -9 | 21.4 | 5.06 E-10 | 8.50 E-11 | 10.5 |
| OJ 287 | 211991001 | 3FGL J0854.8+2006 | 5.29 E-8 | 9.21 E-9 | 146.9 | 5.90 E-09 | 2.07 E-10 | 56.5 |
| PKS 1329−049 | 229227170 | 3FGL J1332.0−0508 | <2.92 E-8 | ⋯ | ⋯ | 4.67 E-09 | 1.95 E-10 | 49.7 |
| RBS 1273 | 212800574 | 3FGL J1329.1−0536 | <9.88 E-9 | ⋯ | ⋯ | 5.06 E-10 | 1.01 E-10 | 5.6 |
| PKS 1335−127 | 212489625 | 3FGL J1337.6−1257 | 4.25 E-8 | 7.49 E-9 | 33.3 | 1.56 E-09 | 1.35 E-10 | 19.1 |
| PKS 1352−104 | 212595811 | 3FGL J1355.0−1044 | 2.88 E-8 | 6.45 E-9 | 17.5 | 8.27 E-10 | 1.02 E-10 | 11.6 |
Notes.
aFluxes and test statistics in energy range 0.1–500 GeV, upper limits in energy range 0.1–300 GeV, measured during K2 campaigns in 2015. bData obtained from Fermi-LAT Third Source Catalog (3FGL; Acero et al. 2015), in the energy range 1–100 GeV, observed between 2008 August 4 and 2012 July 31, retrieved using https://heasarc.gsfc.nasa.gov/db-perl/W3Browse/w3query.pl.Download table as: ASCIITypeset image
We note that our Fermi-LAT detection rate for randomly chosen Fermi blazars observed during random 75- to 83-day periods suggests a rough rule of thumb that the Fermi-LAT has about a 50/50 chance of detecting any similar γ-ray blazar during any 2- or 3-month interval, while the previous flare history of an individual γ-ray blazar can be evaluated with the Second Catalog of Flaring Gamma-ray Sources from the Fermi All-sky Variability Analysis (Abdollahi et al. 2017, and its current online database at https://fermi.gsfc.nasa.gov/ssc/data/access/lat/fava_catalog/). Since the actual duty cycle for most γ-ray blazars is not known because γ-ray blazars are often detected in high states but only upper limits are obtained in lower states, this rule of thumb could be useful in planning future coordinated optical–γ-ray observations.
6. Discussion
6.1. Setting the Context: Kepler and K2 Studies of AGNs
No γ-ray blazars were visible in the original Kepler field of view. There have been a small number of Kepler studies of several other classes of AGNs, which we now briefly summarize.
In previous work (Wehrle et al. 2013; Revalski et al. 2014), we used the original Kepler mission's key capability to monitor a patch of sky nearly continuously over 3 yr to produce superior light curves and probe the optical emission regions of three FSRQs and one radio-loud Seyfert 1.5 (originally classified as an FSRQ). Wehrle et al. (2013) and Revalski et al. (2014) found that the FSRQs' PSDs had power-law slopes of −1.9 to −1.2 ("red noise") at lower frequencies that were dominated by white noise at high frequencies. The overall smooth, slow changes in the light curves (after removal of differential aberration effects) were consistent with emission from a single dominant synchrotron-emitting source.
Edelson et al. (2013) obtained Kepler observations of one (non-γ-ray) BL Lac object, W2R1926+42, and found that it varied on all timescales (including flares of 25% on timescales of a day), most likely indicating that the optical emission was coming from multiple regions within the jet. They argued that neither a single power-law slope nor simple bending power laws fit its PSD (bending power laws are defined in Table 1 of Edelson et al.). Mohan et al. (2016) studied the long-term light curve of this object, including the quiescent period at the end of observations, and argued that there was a reasonable fit to a bending power law for the PSD that could be indicative of a central supermassive black hole mass in the range of (1.5–5.9) × 107 M⊙. An analysis that treated the microvariability of W2R1926+42 in terms of a combination of "shots" of similar shapes argues that these can be best interpreted in terms of the production and dissipation of the particles accelerated in the jet (Sasada et al. 2017).
Mushotzky et al. (2011) studied four Seyfert galaxies that were in the Kepler field and found surprisingly steep PSD slopes of ∼−3. Carini & Ryle (2012) reanalyzed the data for one of these Seyfert 1s, II Zw 229−15, along with ground-based observations that allowed the stitching together of three Kepler quarters, to see a low-frequency break in the PSD. Edelson et al. (2014) found evidence of a 5-day timescale (but not a periodicity) in II Zw 229−15. A reverberation mapping study of this Seyfert 1 produced a black hole mass estimate of  × 107 M⊙ (Barth et al. 2011).
Recently, Smith et al. (2018) have analyzed a sample of light curves for 21 Type 1 AGNs that were discovered in the original Kepler field. These targets were mainly selected using the infrared photometric algorithm of Edelson & Malkan (2012) and were confirmed as AGNs by spectroscopy; all had good-quality observational data for at least three Kepler quarters, and five of them had 12 or more quarters of data. They implemented a unique data reduction procedure that used individualized pixel maps to extract raw counts for each source, and they reduced these using only two cotrending basis vectors (CBVs), showing that this procedure removed the bulk of instrumental effects, but did not overfit, and thereby inadvertently remove, the bulk of intrinsic variability (as is done with the standard Kepler pipeline, which uses more CBVs). The key results from Smith et al. (2018) include that the PSD slopes spanned a rather broad range, from −1.9 to −3.4, though a majority were between −2.1 and −2.5, and that six objects show PSD flattening at lower bending frequencies that seem to correlate with black hole mass. We note that the fitted slopes for the two objects in common between our earlier Kepler program and the Smith et al. program agreed with each other within the errors, indicating that the removal of systematic instrumental effects in Kepler's original observing mode data was robust in both methods.
Aranzana et al. (2018) have analyzed K2 long-cadence light-curve data on a sample of 252 AGNs (radio galaxies, blazars, Seyfert 1s and Seyfert 2s) selected from the Million Quasar Catalogue with R magnitude brighter than 19, observed in Campaigns 0–3. Their analysis used the K2SFF-processed data, which were released before the EVEREST-processed data. They find very low rest-frame variability of 1%–10%, averaging 1.3%. The fitted PSD slopes averaged −2.1 ± 0.6, and PSRESP slopes averaged −2.2 ± 0.5. Their fitted PSRESP errors are larger than those in our study, both because of their generous half-width of 10% probability definition of error compared to our 1σ definition and because the EVEREST-processed data we used had better amplitude correction of drift effects. The 51 radio-associated quasars in their sample, extracted from their online Table B1 (types "QR" and "qR"), have an average PSRESP slope of −2.3 ± 0.50, average redshift of 1.13, and average apparent magnitude b' of 18.4. The 90 quasars not radio associated (types "Q" and "q") have an average PSRESP slope of −2.07 ± 0.56, average redshift of 1.26, and average apparent magnitude b' of 19.1. The PSD slopes of the two classes overlap, but it will be interesting to see if our similar SDSS sample obtained in later K2 campaigns processed with the EVEREST algorithms with smaller typical PSRESP errors of 0.10–0.15 reveals that the two classes have significantly different slopes, as might occur if the optical emission from radio-associated objects is jet dominated while that of the non-radio-associated objects is disk dominated. The Aranzana et al. sample and our sample reported here both contain the BL Lac object PKSB 1130+008 (EPIC 201503438), for which we find similar slopes (see Section 6.3). The similarity indicates that the removal of systematic instrumental errors for K2 data was robust in both of these methods.
6.2. Structure of the OJ 287 PSD
The character of the OJ 287 PSD is different from that of the other blazars in our study. As noted above, for all but two of our light-curve PSDs, a single power law provides a good fit to the low frequencies over about 1.5 decades, starting around log ν ∼ −6.85 (1.4 × 10⁻⁷ Hz, 83 days), while the highest frequencies, log ν ∼ −4.8 (ν ≳ 1.6 × 10⁻⁵ Hz, 18 hr), are dominated by instrumental white noise. For OJ 287, it is clear from the PSDs in Figures 3 and 4 that there is a change in the character of the PSD, namely, a flattening at log ν ∼ −5.7, which corresponds to timescales of ∼5.8 days. The OJ 287 long-cadence data yield a slope of −1.93 ± 0.18, and the PSRESP provided a consistent result of −2.18 ± 0.06 with a confidence factor of 16% when fitted over the full red-noise range from log ν = −4.8 to −6.9. For OJ 287, we also have a short-cadence light curve that provides additional information at higher frequencies and, after removal of artifacts in the PSD at high frequencies (see above) generated by the sampling, yields a slope (−2.15 ± 0.19) in the frequency range log ν = −4.8 to −5.7, consistent with the long-cadence data. In the range log ν = −2.7 to −5.7, the PSD is also clearly a power law, with slope −2.83 ± 0.08. We were not able to apply the PSRESP method to the OJ 287 short-cadence data to determine a confidence level for a break at or near the frequency, due to limited available computational resources to deal with the 30 times larger short-cadence data set.

Figure 4. EPIC 211991001 (also known as OJ 287 and 3FGL J0854.8+2006) short-cadence light curve as processed by EVEREST, unbinned CLEANed PSD, and binned CLEANed PSD. Instrumental white noise occurs at frequencies higher than log ν = −2.7. The slope, −2.83 ± 0.08, fitted between log ν = −2.7 and −5.7, is shown.
Download figure:
Standard image High-resolution imageWe think that it is equally likely that the flattening of the PSD at lower frequencies has an instrumental or astrophysical origin. If instrumental in origin, the flattening could be generated by spacecraft activity or thermal effects on timescales in excess of 5.8 days, or by pipeline and EVEREST processing that divides the light curve into 30 segments of about 2.4 days each, and which uses long-cadence data on nearby stars on the same CCD module to derive some corrections to the amplitude drifts after dividing the data into two segments of about 32 days each. Goyal et al. (2018) examined an extensive amount of multiwavelength data for OJ 287, including the short-cadence K2 data discussed here. Although their CARMA simulations were not directly comparable to our analysis, we describe them here for completeness. No K2SFF or EVEREST corrections were used. They find a PSD slope for a simulated K2 CARMA PSD of ∼−1.9 at lower frequencies, steepening to ∼−3.2 at around log(ν[days−1]) = 0.08 (equivalently, log(ν[Hz]) ∼ −4.85). The low-frequency CARMA-simulated PSD slope is very similar to what we found for the short-cadence data, and the different fits for estimated break frequency can explain the difference in slopes that we and Goyal et al. (2018) find between that break and the onset of high-frequency white noise. If the flattening is caused by astrophysical processes, there are several possibilities, which we summarize as follows.
Accretion disk.—The flattened PSD resembles the bent power-law X-ray PSDs of Seyfert galaxies observed by Uttley et al. (2002); see the compendium by González-Martín & Vaughan (2012). If we assume that an accretion disk makes a substantial contribution to the optical emission from OJ 287 during this time, which is plausible (e.g., Valtonen et al. 2016; Kushwaha et al. 2018), then the break in the OJ 287 PSD slopes defines a characteristic timescale in the orbiting accretion disk that is related to the mass of the central SMBH, following Uttley et al. (2002). The timescale of 5.8 days at the break from shallower to steeper slopes (2.0 × 10⁻⁶ Hz, log ν ∼ −5.7) corresponds to an SMBH mass that would likely range between 1.9 × 10⁷ M⊙ and 1.6 × 10⁸ M⊙, where the lower value is for nonrotating SMBHs and the higher value is for nearly maximally rotating SMBHs. Such modest values are incompatible with the much larger estimates for the mass of the primary (1.83 × 10¹⁰ M⊙), although not incompatible with that of the secondary (1.5 × 10⁸ M⊙), in the binary SMBH scenario that seems to work so well for this exceptional object (Valtonen et al. 2016). However, it seems very unlikely that the emission would be dominated by any accretion disk around the secondary SMBH, which would be expected to be disrupted during the interactions of the secondary with the primary's disk; hence, this does not seem like a plausible model. Although there are a very large number of physical mechanisms that can produce fluctuations in ADs (e.g., Kasliwal et al. 2017), actual predictions of light curves and further analysis of those light curves to produce PSDs from those processes are rather infrequent. However, we can say that steep PSD slopes around −3, as we have found for OJ 287 and for another two of these K2 AGNs, appear to be very difficult to produce with plausible AD models. Early phenomenological AD models for AGN variability involving distributions of flares or hot spots on disks (e.g., Zhang & Bao 1991; Mangalam & Wiita 1993) always yielded PSDs with slopes between ∼−1.2 and ∼−2.1. More sophisticated combinations of stochastic processes are capable of producing breaks in the PSD simulations, such as are seen in Seyfert X-ray light curves; they usually lead to slopes around −2, but a modest fraction range up to −1 (e.g., Kelly et al. 2011). A three-dimensional general relativistic magnetohydrodynamic (3D GRMHD) simulation was used to estimate coronal luminosity fluctuations around the disk as opposed to those arising directly from the AD (Noble & Krolik 2009). They found PSD slopes usually around −2, but if the disk were to be viewed at high inclination angles where disk self-obscuration is important, then slopes even steeper than −3 could be produced; however, such viewing angles are not possible for blazars such as OJ 287. The results of nonlinear stochastic variations in accretion disk viscosity have been examined recently, but they yield very flat PSD slopes, with α ≥ −1 (Cowperthwaite & Reynolds 2014). Very recently, another 3D MHD simulation of a magnetically arrested accretion flow, or MAD (e.g., Tchekhovskoy et al. 2011), was analyzed for emission variations from the jet-launching region, and strong turbulence there could produce PSDs with α ≈ −1.3 (O'Riordan et al. 2017 and private communication). We note that only a limited fraction of the modest number of 3D MHD simulations have been examined for their PSDs, and steeper slopes may be seen in some future state-of-the-art AD simulations.
Jet.—Given that OJ 287 is a blazar whose optical light is dominated by nonthermal processes most of the time, a mechanism that could produce the apparent multislope PSD that arises from its short-cadence light curve may be operating in the jet. Doppler boosting reduces the observed timescales but does not change the shape of the PSD. To our knowledge, no single-process theoretical models provide a natural explanation for the change in slope that flattens at low frequencies. A two-process scenario where optical variability at longer timescales is dominated by fluctuations in the bulk jet velocity while shorter-term variability is dominated by turbulence in the jet behind the reconfinement shock yields light curves and PSDs extending over five decades in time or frequency (Pollack et al. 2016). Nearly all simulations along those lines produced to date yield somewhat different PSD slopes, with 0 < Δα < 1.1, but in the wrong sense, as the lower-frequency bulk slope is always the steeper one, and so in this sense this picture cannot fit the sense of the shallow-to-steep PSD behavior seen in the OJ 287 PSD. The bulk fluctuations yield slopes in this model that range between −2.1 > αbulk > −2.9, whereas −1.7 > αturb > −2.3 (Calafut & Wiita 2015; Pollack et al. 2016). So the variations induced by bulk jet wiggling might be able to reproduce the slightly steeper one OJ 287 displays if the turbulence is unimportant or only operates on timescales shorter than the high-frequency white-noise level. Other papers that model jet turbulence (Bhatta et al. 2013; Marscher 2014) do not provide PSDs of the output light curves, though an input power-spectrum slope between −1.5 and −2.0 is one of the many parameters in the complex Marscher model that yields impressive multiband light curves and polarization variations.
Recently, O'Riordan et al. (2017) have noted that the slopes of PSDs of both the γ-ray and optical light curves, modeled from the emissivity fluctuations produced by the turbulence that arises in one of their MAD disk simulations, are quite close to those of a sample of blazars. However, as they note, there are reasons why their reported model is not actually applicable to blazars, in that the optical emission is based on thermal electron synchrotron emission (not the more realistic nonthermal electron synchrotron) and their inverse-Compton-produced gamma-ray emission could not escape from this compact jet-launching region so close to the SMBH. Nonetheless, these similarities of PSD shapes are intriguing, and O'Riordan et al. (2017) plausibly speculate that if such turbulence were present in the jet emission regions that produce blazar emission, it could yield suitable PSDs over several decades in frequency.
"Jets in a jet."—Probably the best way of producing very rapid variability in blazars involves the "jets-in-a-jet" or "mini-jet" models, versions of which were proposed by Ghisellini & Tavecchio (2008) and Giannios et al. (2009) to explain fast, minute-scale, TeV variability in extreme blazars such as Mrk 501 and PKS 2155−304. In this general picture, matter in small regions within a jet is accelerated to extreme Lorentz factors (≳100) via a magnetocentrifugal process or magnetic reconnection. The magnetic reconnection mechanism has been extensively investigated over the past several years (e.g., Nalewajko et al. 2011), and while it may have difficulties (e.g., Kagan et al. 2016), recent detailed 3D relativistic simulations support its viability for many astrophysical venues where pair plasmas are present (Werner & Uzdensky 2017). An interesting variant of this scenario combines a sort of relativistic turbulence (with jet frame Lorentz factors, Γturb ∼ 6) within a bulk relativistic jet of Γbulk ≥ 25 (Narayan & Piran 2012). This paper argues that this more naturally yields very rapid γ-ray flares than do the other models, in which the mini-jets are ultrarelativistic; however, PSD slopes are not presented. It is certainly reasonable that such models can explain longer variations in terms of larger acceleration regions occurring at greater distances from the SMBH. However, no application of this scenario of which we are aware has been shown to yield broken-slope PSDs of the character shown by OJ 287, nor the very steep PSD slopes seen for a few of the blazars in these K2 observations.
We note that K2 reobserved OJ 287 in 2018 May–June, and such repeated observations may be useful in determining the instrumental or astrophysical origin of the flattening of the PSD. The character of the intrinsic brightness variations may have changed after passage of the secondary supermassive black hole through the large accretion disk of the primary supermassive black hole.
6.3. Results on Other Individual AGNs
We present our results on other individual AGNs as follows. Light curves, unbinned PSDs, and binned PSDs are shown in Figures 5–13. The figures are time-ordered by K2 campaign number (listed in Table 1) to allow easy comparison of common thermal settle-down times (a few days) at the beginning of campaigns, changes in the noise character in mid-campaign due to spacecraft roll, data gaps, and other instrumental effects.
PKSB 1130+008 = EPIC 201503438: This 18th mag BL Lac object at redshift 1.22 was clearly detected (TS = 40.8) by Fermi-LAT during our K2 observations. The K2 light curve's optical maximum-to-minimum ratio was 1.22 with several days-long bumps (Figure 5). Its PSD slope was measured to be −2.02 ± 0.16, and the PSRESP slope was consistent at −2.05 ± 0.13, with a 53% confidence level. This blazar's K2 data were also studied by Aranzana et al. (2018), who found a PSRESP slope identical to ours while employing a different strategy of constructing PSDs (we note that our PSRESP methods may be using some of the same publicly available IDL routines, although we use a fast Fourier transform and Aranzana et al. use a Lomb–Scargle periodogram). Optical and UV data from Swift and ground-based optical multiband photometry from GROND were presented by Rau et al. (2012). It included in the third (and subsequent) Sloan Data Release (Schneider et al. 2005). While the source is a member of several surveys of γ-ray blazars since it was detected by EGRET (Mattox et al. 1997), it has not been the subject of dedicated individual studies.
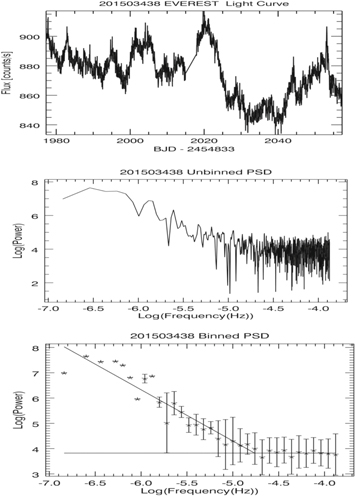
Figure 5. EPIC 201503438 (also known as PKS B1130+008 and 3FGL J1132.7+0034) light curve as processed by EVEREST, unbinned PSD, and binned PSD. The fitted slope of −2.02 ± 0.16 for the red-noise part is shown. Instrumental white noise occurs at frequencies higher than log ν = −4.7.
Download figure:
Standard image High-resolution imageWB J0905+1356 = EPIC 211559047: This 16th mag FSRQ has a tentative, photometric redshift of 2.065; however, an optical spectrum obtained by Shaw et al. (2013) showed no lines. It was strongly detected by Fermi-LAT with TS = 43.6 during our K2 observations. The K2 optical light curve rose slowly over several weeks to a peak 1.59 times brighter than the minimum (Figure 6). Its PSD slope was −3.81 ± 0.29, while the PSRESP slope was not quite as steep, at −2.52 ± 0.23, with confidence 12%. In this case the PSDs were constructed from the K2SFF data.
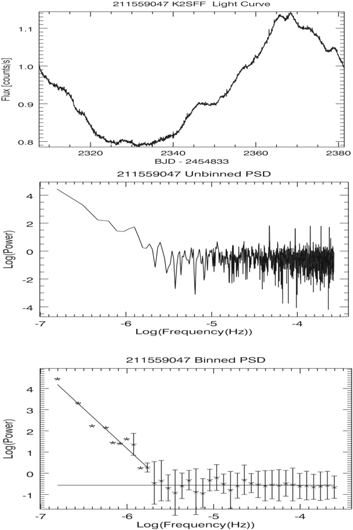
Figure 6. EPIC 211559047 (also known as WB J0905+1358 and 3FGL J0905.5+1358) light curve as processed by K2SFF, unbinned PSD, and binned PSD. The fitted slope of −3.81 ± 0.29 for the red-noise part is shown. Instrumental white noise occurs at frequencies higher than log ν = −5.6.
Download figure:
Standard image High-resolution image3C 207 = EPIC 211504760: 3C 207 is a well-known LDRQ at redshift 0.6808. It was not detected by Fermi-LAT during our K2 observations. Its K2 light curves showed a strong plateau with two flares superimposed (Figure 7). The maximum-to-minimum variation was 1.32. The PSD slope was −1.96 ± 0.13, consistent within the errors with the PSRESP slope of −2.21 ± 0.11, with 67% confidence. Chandra observations showed an X-ray jet coincident with the eastern radio jet and diffuse X-ray emission associated with the western radio lobe (Brunetti et al. 2002). On parsec scales, seven moving VLBI radio features have a median motion of 246 ± 4 μas yr–1, or apparent speeds of 9.52 ± 0.14c (Lister et al. 2016).
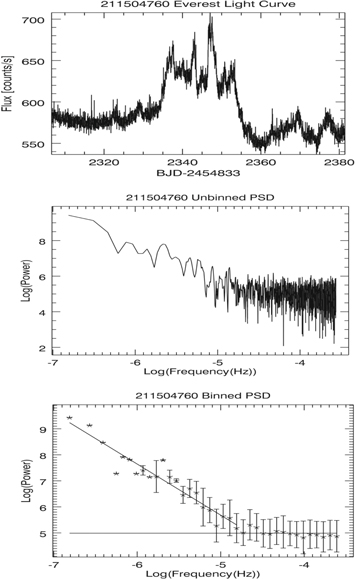
Figure 7. EPIC 211504760 (also known as 3C 207 and 3FGL J0840.8+1315) light curve as processed by EVEREST, unbinned PSD, and binned PSD. The fitted slope of −1.96 ± 0.13 for the red-noise part is shown. Instrumental white noise occurs at frequencies higher than log ν = −4.8.
Download figure:
Standard image High-resolution imageRGB J0847+115 = EPIC 211394951: Also known as RBS 0273, this is a 17th mag BL Lac object with the lowest redshift, z = 0.198, in our sample. It is a member of the sample of blazars with a comparatively high ratio of X-ray to radio flux observed by Bonnoli et al. (2015). It was weakly detected (TS = 21.3) by Fermi-LAT during our K2 observations. The K2 light curve is continuously variable with many 1- to 2-day long peaks and valleys (Figure 8). The maximum-to-minimum ratio was 1.44. The PSD slope is −2.60 ± 0.22, while the PSRESP slope is consistent at −2.56 ± 0.14, with confidence level 37.8%, using K2SFF data.

Figure 8. EPIC 211394951 (also known as RGB J0847+115 and 3FGL J0847.1+1134) light curve as processed by K2SFF, unbinned PSD, and binned PSD. The fitted slope of −2.60 ± 0.22 for the red-noise part is shown. Instrumental white noise occurs at frequencies higher than log ν = −5.1.
Download figure:
Standard image High-resolution imagePKS 1329-049 = EPIC 229227170: This is an 18th mag FSRQ with the highest redshift, z = 2.15, and lowest K2 count rate (∼310 counts s−1) in our sample. It was not detected by Fermi-LAT during our K2 observations. The K2 light curve showed several-days-long bumps during an overall decline in brightness, with a maximum-to-minimum ratio of 1.14 (Figure 9). Its PSD slope was −1.97 ± 0.23, and the PSRESP slope was −2.68 ± 0.06 with a confidence of 79%. VLBA data obtained in the MOJAVE sample of Lister et al. (2016) showed a core-jet structure with two features moving at 6.5 ± 1.4c. The source has been extensively studied at radio wavebands and as part of γ-ray samples and has been monitored by Swift BAT in hard X-rays (e.g., Cusumano et al. 2010; Baumgartner et al. 2013).

Figure 9. EPIC 229227170 (also known as PKS 1329−049 and 3FGL J1332.0−0508) light curve as processed by EVEREST, unbinned PSD, and binned PSD. The fitted slope of −1.97 ± 0.23 for the red-noise part is shown. Instrumental white noise occurs at frequencies higher than log ν = −5.3.
Download figure:
Standard image High-resolution imageRBS 1273 = EPIC 212800574: This is a 15th mag X-ray AGN at redshift 0.576. It was not detected by Fermi-LAT during our K2 observations. The K2 light curve showed slow variations with two bumps about 10–15 days long (Figure 10). Its PSD slope was quite steep, at −3.67 ± 0.39, and the PSRESP procedure gave a similar steep slope of −3.78 ± 0.15, with a low confidence level of 19.2%. Although RBS 1273 is a member of the ROSAT All-sky Bright Source Catalog (Voges et al. 1999), it has not been studied extensively on its own. It was, however, detected as a bright source in the ultraviolet (Goldschmidt et al. 1992) with subsequent GALEX and FUSE observations.
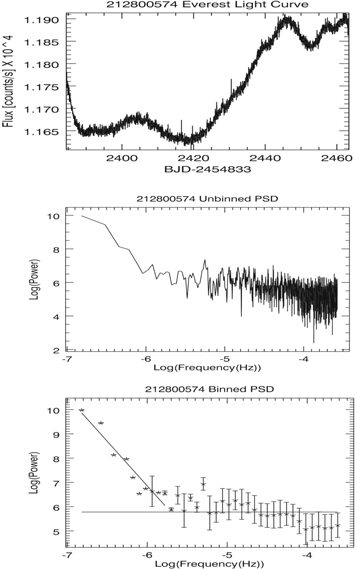
Figure 10. EPIC 212800574 (also known as RBS 1273 and 3FGL J1329.1−0536) light curve as processed by EVEREST, unbinned PSD, and binned PSD. The fitted slope of −3.67 ± 0.39 for the red-noise part is shown. Instrumental white noise occurs at frequencies higher than log ν = −5.7.
Download figure:
Standard image High-resolution imagePKS 1335−127 = EPIC 212489625: This is a well-known 17th–18th mag FSRQ with redshift 0.539. It was detected by Fermi-LAT with TS = 33.3 during our K2 observations. Its K2 light curve showed classic blazar fractal variability on all timescales (Figure 11). The PSD slope was −1.67 ± 0.17, and the PSRESP slope was −1.76 ± 0.08, with a confidence factor of 14%, using K2SFF data. It has been extensively studied at many wavebands. It is a core-dominated radio source with superluminal motion of 14.8 ± 0.68c based on six moving features in its jet (Lister et al. 2016; see also Piner et al. 2007). No correlation of 37 GHz Metsähovi radio and γ-ray light curves was found by Ramakrishnan et al. (2015).
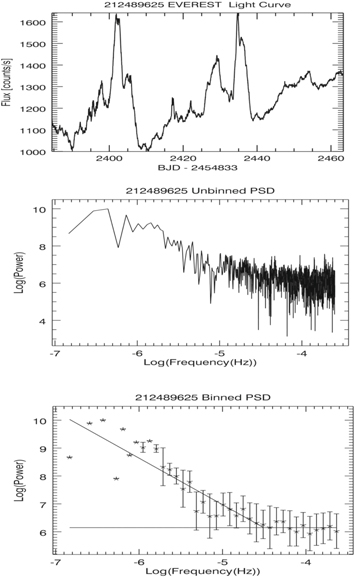
Figure 11. EPIC 212489625 (also known as PKS 1335−127 and 3FGL J1337.6−1257) light curve as processed by K2SFF, unbinned PSD, and binned PSD. The fitted slopes of −1.67 ± 0.17 for the red-noise part is shown. Instrumental white noise occurs at frequencies higher than log ν = −4.5.
Download figure:
Standard image High-resolution imagePKS 1352−104 = EPIC 212595811: This is a 17th mag FSRQ with redshift 0.332. It was weakly detected (TS = 17.5) by Fermi-LAT during our K2 observations. The K2 light curve showed a strong flare toward the end of the observations, with maximum-to-minimum variation of 6.24 (Figure 12). The K2 spacecraft's internal reflection of the bright star Spica fell on the same module, but fortunately the reflected light did not affect the data on our target, as shown by inspection of the full-frame images. The PSD slope was −3.37 ± 0.17 in the log ν range of −4.6 to −5.0 and flattening to −0.77 for log ν from −5.5 to −6.4. When we excluded the time interval with the big flare from the data, the PSD slope was −1.71 ± 0.08 in the log ν range from −4.1 to −6.9 (Figure 13). This is a fairly well studied source at radio bands (e.g., Ricci et al. 2006).
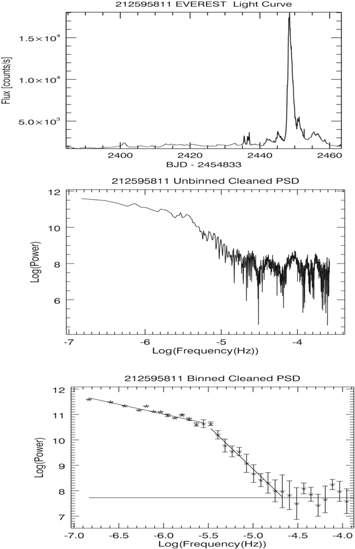
Figure 12. EPIC 212595811 (also known as PKS 1352−104 and 3FGL J1355.0−1044) light curve as processed by EVEREST, unbinned PSD, and binned PSD. The fitted slope of −3.37 ± 0.17 at frequencies lower than an apparent break at log ν = −5.5 and the slope of −0.77 ± 0.06 at frequencies higher than the apparent break frequency are shown. Instrumental white noise occurs at frequencies higher than log ν = −4.6. Data include the large flare.
Download figure:
Standard image High-resolution image
Figure 13. EPIC 212595811 (also known as PKS 1352−104 and 3FGL J1355.0−1044) light curve as processed by EVEREST, unbinned PSD, and binned PSD. The fitted slope of −1.71 ± 0.08 for the red-noise part is shown. Instrumental white noise occurs at frequencies higher than log ν = −4.1. Data exclude the large flare.
Download figure:
Standard image High-resolution image6.4. Ensemble Results
6.4.1. Slopes of Optical Power Spectral Densities
The slopes of the optical PSDs of the long-cadence light curves over the broadest red-noise frequency ranges (generally from log ν ranging from −4.8 to −6.9) vary from −1.67 ± 0.17 to −3.81 ± 0.29. A histogram is shown in Figure 14. Five of the slopes are significantly different from the −2 slope of the damped random walk model explored by Kelly et al. (2009). As described earlier, we and others found slopes steeper than −2 for three FSRQs and a Seyfert 1.5 (Wehrle et al. 2013; Revalski et al. 2014). Mushotzky et al. (2011), Kasliwal et al. (2017), and Smith et al. (2018) found steep slopes for various AGNs observed with Kepler in its original observing mode.

Figure 14. Histogram of PSD slopes of the long-cadence light curves. One PSD slope per object, over the broadest red-noise frequency ranges (generally from log ν ranging from −4.8 to −6.9), is shown. Five objects have steep slopes that are inconsistent with the damped random walk model's PSD slope of −2.
Download figure:
Standard image High-resolution image
6.4.2. γ-Ray Activity Level and Blazar Classes
Six of the nine AGNs were detected with Fermi-LAT at significance levels ≳4σ (TS ≳ 17) during the K2 observations. The slopes of the optical PSDs of the six Fermi-LAT-detected AGNs (all blazars) spanned the same range as those of the three undetected AGNs (the LDRQ 3C 207, the X-ray AGN RBS 1273, and the FSRQ PKS 1329−049). The PSD slopes of the three BL Lac objects and three FSRQs also spanned similar ranges. Both results are consistent with the relativistic jet acting as the dominant source of emission in all types of objects during the K2 observations.
7. Summary and Conclusions
In this paper we have focused on nine AGNs that were previously detected with the Fermi Gamma Ray Space Telescope Large Area Telescope during K2 Campaigns 1, 5, and 6 in 2014–2105: the well-known and extremely bright blazar OJ 287, six other bright γ-ray blazars (B1130+008, J0905+1358, J0847+115, PKS 1329−049, PKS 1334−127, and PKS 1352−104), the LDRQ 3C 207, and the X-ray-bright quasar RBS 1273.
OJ 287 varied by a factor of 2.8 during the observations, and its long-cadence data had a PSD slope α = −1.93 ± 0.18 for log ν between −4.8 and −6.9, which can be easily produced by relativistic turbulent jet models that contain multiple synchrotron-emitting regions of different sizes. However, the short-cadence data from OJ 287 show a substantially steeper PSD slope of −2.83 ± 0.08 for log ν between −2.7 and −5.7, apparently indicating that while turbulence may be important, it is likely mixed with another mechanism that produces peaks over multiday timescales. One γ-ray blazar, PKS 1352−104, flared by a factor of 6 for just a few days; this flare is likely caused by a small number of extremely brightened jet components, on top of emission from less variable parts of the jet. The optical emissions of six other AGNs were observed by K2 to vary by modest factors of 1.14–2.23, while the X-ray quasar RBS 1273 was calm during this period, varying merely by a factor of 1.03.
The AGNs aside from OJ 287 have PSDs with −1.77 ± 0.13 ≥ α ≥ −3.81 ± 0.29, the less steep majority of which are consistent with models of emission from turbulent relativistic jets. However, the X-ray-bright quasar and two FSRQ blazars have the steepest PSD slopes, ≤−3, which can be understood as they clearly contain month-long peaks in their light curves that produce low-frequency power. Current theoretical models have not been shown to produce the steepest PSD slopes; hence, they do not appear to be easily modeled by a single mechanism, and a second mechanism that produces peaks and dips in light curves is needed. The K2 mission has observed many more AGNs, and we are in the process of analyzing results for some of these (blazars and SDSS quasars) in several later campaigns.
The ability to follow AGN brightness fluctuations for very extended periods is being dramatically enhanced by current and planned telescopes. The TESS mission, launched in 2018, will provide a significant number of uniformly sampled optical light curves of the brightest AGNs over nearly the full sky, complementing the Kepler and K2 observations of fainter AGNs in the Cygnus and ecliptic plane regions. From the ground, extremely large numbers of AGNs have been observed multiple times by SDSS, providing statistical measurements for longer-term variability of different AGN classes (e.g., MacLeod et al. 2012). The Palomar Transient Factory and Intermediate Palomar Transient Factory programs have yielded optical variability studies of quasars (e.g., Caplar et al. 2017). The Catalina Real-Time Transient Survey (Drake et al. 2009), PanSTARRS (e.g., Simm et al. 2016), and the Zwicky Transient Facility (Kulkarni 2018) are producing synoptic data. In the future, tremendous numbers of AGNs will be monitored quite frequently over several years by the Large Synoptic Survey Telescope.
We thank Mauri Valtonen, Elizabeth Ferrara, Roopesh Ojha, Mitchell Revalski, Christina Hedges, Seth Digel, Ryosuke Itoh, and Rick Edelson for helpful discussions. We are grateful to Andrew Vanderburg (Harvard University and Center for Astrophysics) for the data processed with his K2SFF software and made available publicly through MAST. We are also grateful to Rodrigo Luger (University of Washington) and colleagues for the data processed with their EVEREST software and made available publicly through MAST.
We acknowledge NASA K2 Guest Investigator Program support via NNX15AV72G and Fermi Guest Investigator Program via NNX15AU87G. This paper includes data collected by the K2 mission. Funding for the K2 mission is provided by the NASA Science Mission Directorate.
The Fermi-LAT Collaboration acknowledges generous ongoing support from a number of agencies and institutes that have supported both the development and the operation of the LAT, as well as scientific data analysis. These include the National Aeronautics and Space Administration and the Department of Energy in the United States; the Commissariat l'Energie Atomique and the Centre National de la Recherche Scientifique/Institut National de Physique Nucléaire et de Physique des Particules in France; the Agenzia Spaziale Italiana and the Istituto Nazionale di Fisica Nucleare in Italy; the Ministry of Education, Culture, Sports, Science and Technology (MEXT), High Energy Accelerator Research Organization (KEK), and Japan Aerospace Exploration Agency (JAXA) in Japan; and the K. A. Wallenberg Foundation, the Swedish Research Council, and the Swedish National Space Board in Sweden. Additional support for science analysis during the operations phase is gratefully acknowledged from the Istituto Nazionale di Astrofisica in Italy and the Centre National d' Études Spatiales in France.
This research has made use of the NASA/IPAC Extragalactic Database (NED), which is operated by the Jet Propulsion Laboratory, California Institute of Technology, under contract with the National Aeronautics and Space Administration. This paper has made use of up-to-date SMARTS optical/near-infrared light curves that are available at http://www.astro.yale.edu/smarts/glast/home.php. Some of the data presented in this paper were obtained from the Mikulski Archive for Space Telescopes (MAST). STScI is operated by the Association of Universities for Research in Astronomy, Inc., under NASA contract NAS5-26555. Support for MAST for non-HST data is provided by the NASA Office of Space Science via grant NNX09AF08G and by other grants and contracts.
Facilities: Kepler - The Kepler Mission, K2 - , Fermi - , SMARTS. -
Software: EVEREST (Luger, R., Agol, R., Kruse, E., Barnes, R., Becker, A., Foreman-Mackey, D., & Deming, D. 2016, AJ, 152,100), K2SFF (Vanderburg, A. & Johnson, J. A. 2014, PASP, 126, 948).