


Abstract
We present optical, UV, and X-ray monitoring of the short orbital period black hole X-ray binary candidate Swift J1753.5–0127, focusing on the final stages of its 12 yr long outburst that started in 2005. From 2016 September onward, the source started to fade, and within 3 months, the optical flux almost reached the quiescent level. Soon after that, using a new proposed rebrightening classification method, we recorded a mini-outburst and a reflare in the optical light curves, peaking in 2017 February (V ∼ 17.0) and May (V ∼ 17.9), respectively. Remarkably, the mini-outburst has a peak flux consistent with the extrapolation of the slow decay before the fading phase preceding it. The following reflare was fainter and shorter. We found from optical colors that the temperature of the outer disk was ∼11,000 K when the source started to fade rapidly. According to the disk instability model, this is close to the critical temperature when a cooling wave is expected to form in the disk, shutting down the outburst. The optical color could be a useful tool to predict decay rates in some X-ray transients. We notice that all X-ray binaries that show mini-outbursts following a main outburst are short orbital period systems (<7 hr). In analogy with another class of short-period binaries showing similar mini-outbursts, the cataclysmic variables of the RZ LMi type, we suggest that mini-outbursts could occur if there is a hot inner disk at the end of the outburst decay.
Export citation and abstract BibTeX RIS
1. Introduction
Black hole X-ray transients (BHXTs) are binary systems consisting of a stellar-mass black hole (BH) primary accreting matter from a noncollapsed donor secondary. The vast majority spend most of their time in quiescence, where the X-ray luminosity is low. Episodically, during outburst, the X-ray flux increases by orders of magnitude, approaching in some cases the Eddington luminosity limit (LEdd). The BHXTs exhibit a number of different spectral states during outbursts (e.g., low-hard, high-soft; Belloni & Motta 2016), where the accretion properties change.
Outbursts of BHXTs are thought to be triggered by a thermal-viscous instability in the accretion disk. In the disk instability model (DIM; for a review, see Lasota 2001), as matter accumulates in the disk during quiescence, the surface density increases until a threshold is exceeded at a certain radius in the disk. Hydrogen becomes ionized, the disk heats up quickly, and the source goes into outburst.
The DIM can broadly explain the quiescent-to-outburst cycle of BHXTs. However, some observed properties cannot be well reproduced by it. Most BHXTs directly fade into quiescence with an exponential decay after the outburst peak, whereas some BHXTs (e.g., GRO J0422+32, GRS 1009−45, MAXI J1659–152, and GRS 1739–278; Chen et al. 1997; Homan et al. 2013; Yan & Yu 2017) show several rebrightenings after the outburst peak. Some of these rebrightenings were defined as mini-outbursts by Chen et al. (1997) because they happen soon after the flux reaches close to the quiescence level, and they are of smaller amplitude and shorter duration compared to the normal outburst (see, e.g., Dubus et al. 2001, hereafter D01). A sudden reactivation soon after the end of an outburst decay has also been observed in neutron star (NS) systems (e.g., Hartman et al. 2011; Patruno et al. 2016). Mini-outbursts are of much greater amplitude than the more common "reflares" that typically occur during the fade of the main outburst before reaching quiescence (Lasota 2001). Reflares are theoretically expected to arise from a sequence of heating and cooling front reflections in the disk according to the DIM but could, alternatively, be caused by
- 1.
- 2.synchrotron emission from the reactivation of the jet in the hard-state decay (e.g., Kalemci et al. 2013); or,
- 3.
Even rarer are "multipeak" outbursts, where a second peak (or several peaks) following the main outburst reaches a similar flux level to the first peak and may last longer (e.g., the BH systems GRO J1655–40 and XTE J1118+480 and the NS system IGR J00291+5934; Chen et al. 1997; Chaty et al. 2007; Lewis et al. 2010). The properties of mini-outbursts are not well explained by the DIM but require specific conditions of the accretion flow, such as a hot inner disk residing near the end of the first outburst. This has been adopted to explain how the DIM can reproduce the mini-outbursts of some dwarf novae (DNe; e.g., Hameury et al. 2000), but to date, it has not successfully been applied to mini-outbursts of BHXTs.
Swift J1753.5–0127 (hereafter J1753) was discovered by the Swift Burst Alert Telescope (BAT) on 2005 June 30 (Palmer et al. 2005) and showed a typical fast-rise, exponential-decay (FRED) light curve. However, after decaying from the outburst peak, instead of returning to quiescence, J1753 remained active, with BAT fluxes varying between 0.001 and 0.03 counts s−1 (15–50 keV). The X-ray spectral and timing properties during outburst indicate that the source is a BH X-ray binary that remained in the low-hard state (e.g., Cadolle Bel et al. 2007; Zhang et al. 2007) for the vast majority of the time (Shaw et al. 2016a).
The orbital period of J1753 is constrained to be 3.24 hr (Zurita et al. 2008), with an alternative claim of 2.85 hr proposed by Neustroev et al. (2014) that has been challenged by Shaw et al. (2016a). The source distance is poorly constrained, ∼2.5–8 kpc, and the inclination i is constrained by model-dependent methods to be ∼55° (e.g., Zurita et al. 2008; Froning et al. 2014; Plotkin et al. 2017; Gandhi et al. 2018). Time-resolved optical spectroscopy suggests that the primary mass is greater than 7.4 M⊙ (Shaw et al. 2016a). During the outburst, the radio flux of J1753 (Cadolle Bel et al. 2007; Soleri et al. 2010), which is consistent with optically thick synchrotron emission likely originating in a compact jet (e.g., Tomsick et al. 2015), is typically lower than that of BHXTs following the standard track in the radio–versus–X-ray diagram (Gallo et al. 2012; Rushton et al. 2016), making J1753 one of the radio-faint BHXTs. However, recent observations show that the source was close to the standard track during the rise and decay of the rebrightenings discussed below (Plotkin et al. 2017).
After being active for ∼11 yr, J1753 became faint at X-ray, UV, optical, and radio wavelengths, almost reaching the previously measured optical quiescence level (V ∼ 21 mag; Cadolle Bel et al. 2007) in 2016 November (Al Qasim et al. 2016; Plotkin et al. 2016; Russell et al. 2016; Shaw et al. 2016b). Unexpectedly, within ∼3 months, J1753 was bright again at all wavelengths (e.g., Al Qasim et al. 2017; Bright et al. 2017; Zhang et al. 2017c).
Here we present 7 yr of multiband optical monitoring of J1753 with the Faulkes and Las Cumbres Observatory (LCO) telescopes, complemented with archival optical data and UV and soft X-ray coverage provided by Swift. In particular, we concentrate on the latest stage of the outburst (2016–2017 June), when the source faded and exhibited rebrightening episodes.
2. Rebrightenings Classification
Previously, some of the rebrightening phenomena (e.g., reflares, glitches, mini-outbursts) have been classified qualitatively in Chen et al. (1997). Since then, more rebrightening phenomena in X-ray transients (XTs) have been discovered and labeled (e.g., multipeak and secondary outbursts). However, a systematic classification scheme has not been developed for the rebrightenings, which has caused several inconsistencies in the literature (e.g., V404 Cyg; Muñoz-Darias et al. 2017)
In order to classify the rebrightening phenomena quantitatively, we introduce here a new observation-based classification scheme that first asks whether or not the source has reached quiescence preceding each rebrightening episode. We consider a source to have reached quiescence if either (a) the optical magnitude is within 0.5 mag of the quiescent level (or the X-ray flux is within a factor of 2 of the X-ray quiescent level) or (b) the extrapolation of the outburst decay rate reaches the quiescent level before the rebrightening is detected. Then we define Fi/Fout as the flux ratio between each rebrightening peak flux and the outburst peak flux, Δti as the time separating the start of the quiescent period from the start of each rebrightening, and tout as the duration of the main outburst.
In practice, for a rebrightening event (following Figure 1):
- 1.If the source flux does not reach quiescence before the rebrightening, it can be classified as
- (a)a glitch, if Fi/Fout < 0.7 and the light-curve slope in the decay of the rebrightening is similar to the light-curve slope during the main outburst decay;
- (b)a reflare, if Fi/Fout < 0.7 but the slopes of the light curve of the outburst decay and that following the rebrightening are different; or
- (c)a multipeak outburst, if Fi/Fout ≥ 0.7.
- 2.If the flux reaches quiescence before a rebrightening, it can be classified as
- (a)a mini-outburst, if Δti/tout ≤ 1 and Fi/Fout < 0.7; or
- (b)a new outburst, if Δti/tout > 1 or Δti/tout ≤ 1 and Fi/Fout ≥ 0.7.

Figure 1. Flowchart of the rebrightening classification scheme (left) with illustrations of the different classes of rebrightenings (right).
Download figure:
Standard image High-resolution imageThis method provides a unique classification for most of the rebrightenings observed in BH and NS transients. However, some caveats have to be taken into account. (1) The classification depends on the energy band (e.g., for the same source, simultaneous optical and X-ray light curves could lead to different classifications). (2) If the source is recurrent (e.g., GX 339–4, for which Δti/tout ≤ 1 is typically true for a large fraction of its outbursts), all rebrightenings should be categorized as new outbursts. (3) If there are observational gaps in the light curves with durations comparable to or longer than the outburst length, only a potential classification can be given. (4) We chose Fi/Fout = 0.7 to separate strong and weak rebrightenings and Δti/tout = 1 to separate mini-outbursts from new outbursts, so that known rebrightenings fall under the same classification as the definitions in Chen et al. (1997). These values can be further tuned in the future, when more data will become available.
3. Observations and Data Reduction
3.1. Optical Photometry
We observed J1753 with the 2 m robotic Faulkes Telescopes North (located at Haleakala on Maui, USA) and South (at Siding Spring, Australia; e.g., Lewis 2018) and the 1 m LCO telescopes (Brown et al. 2013). These observations are part of an ongoing monitoring campaign of ∼40 low-mass X-ray binaries (Lewis et al. 2008). Data were taken in the V-, R-, and i'-band filters from 2010 April and reduced using the LCO automatic pipeline. Photometry was performed using PHOT in IRAF. Photometric calibration was achieved using stars with magnitude errors of <0.05 in the Pan-STARRS1 and APASS catalogs (Magnier et al. 2013; Henden et al. 2015). The 2010–2013 January data were published in Shaw et al. (2013) using flux calibration from stars listed in Zurita et al. (2008). We also use archival I- and V-band data of J1753 published in Hynes et al. (2009) and Soleri et al. (2010). The observation logs are provided in Table 1
Table 1. Log of Las Cumbres Observatory Global Telescope Observations from 2016 June
| MJD | Magnitude (i') | MJD | Magnitude (i') | MJD | Magnitude (R) | MJD | Magnitude (V) |
|---|---|---|---|---|---|---|---|
| 57,576.408966 | 16.664 ± 0.041 | 57,852.653244 | 17.206 ± 0.007 | 57,558.574655 | 16.858 ± 0.040 | 57,558.571983 | 16.821 ± 0.075 |
| 57,582.337375 | 16.619 ± 0.033 | 57,852.667005 | 17.147 ± 0.008 | 57,576.406211 | 16.849 ± 0.007 | 57,576.403534 | 16.871 ± 0.012 |
| 57,592.379523 | 16.698 ± 0.029 | 57,852.673729 | 17.136 ± 0.013 | 57,582.334629 | 16.792 ± 0.008 | 57,582.33196 | 16.816 ± 0.014 |
| 57,601.423749 | 16.680 ± 0.024 | 57,852.678244 | 17.135 ± 0.008 | 57,592.376769 | 16.853 ± 0.012 | 57,592.374098 | 16.870 ± 0.019 |
| 57,622.373905 | 16.659 ± 0.033 | 57,852.686403 | 17.139 ± 0.009 | 57,601.420983 | 16.868 ± 0.008 | 57,601.418325 | 16.914 ± 0.012 |
| 57,650.438382 | 17.196 ± 0.030 | 57,852.691101 | 17.118 ± 0.013 | 57,622.371154 | 16.889 ± 0.010 | 57,622.368481 | 16.936 ± 0.019 |
| 57,657.303600 | 17.858 ± 0.031 | 57,852.698035 | 17.115 ± 0.037 | 57,650.435627 | 17.427 ± 0.012 | 57,650.432968 | 17.554 ± 0.031 |
| 57,681.395282 | 18.441 ± 0.024 | 57,852.709628 | 17.079 ± 0.035 | 57,657.300838 | 18.029 ± 0.027 | 57,657.298173 | 18.209 ± 0.068 |
| 57,693.199752 | 19.344 ± 0.024 | 57,852.717024 | 17.157 ± 0.114 | 57,681.392516 | 18.845 ± 0.036 | 57,681.389858 | 18.956 ± 0.069 |
| 57,698.204232 | 19.786 ± 0.022 | 57,852.72825 | 17.114 ± 0.161 | 57,693.196992 | 19.603 ± 0.117 | 57,698.19881 | 20.450 ± 0.296 |
| 57,700.039837 | 19.747 ± 0.026 | 57,852.729595 | 17.115 ± 0.346 | 57,698.201471 | 20.371 ± 0.189 | 57,783.663806 | 18.169 ± 0.064 |
| 57,700.194786 | 19.967 ± 0.020 | 57,852.734499 | 17.108 ± 0.300 | 57,783.666481 | 18.047 ± 0.033 | 57,797.623031 | 17.068 ± 0.046 |
| 57,783.669241 | 17.744 ± 0.020 | 57,852.74075 | 17.089 ± 0.047 | 57,797.62571 | 16.953 ± 0.018 | 57,798.621437 | 16.965 ± 0.038 |
| 57,797.628466 | 16.779 ± 0.019 | 57,852.746995 | 17.102 ± 0.015 | 57,798.622952 | 16.982 ± 0.022 | 57,799.386816 | 17.010 ± 0.031 |
| 57,798.619832 | 16.700 ± 0.027 | 57,852.753815 | 17.132 ± 0.016 | 57,799.38975 | 16.963 ± 0.018 | 57,799.775908 | 16.967 ± 0.066 |
| 57,799.383835 | 16.728 ± 0.025 | 57,852.762352 | 17.184 ± 0.018 | 57,799.778842 | 16.956 ± 0.041 | 57,800.773383 | 17.024 ± 0.116 |
| 57,799.772894 | 16.627 ± 0.020 | 57,852.765903 | 17.157 ± 0.035 | 57,800.774915 | 16.935 ± 0.041 | 57,801.384364 | 17.042 ± 0.032 |
| 57,800.771778 | 16.695 ± 0.019 | 57,852.773000 | 17.100 ± 0.033 | 57,801.387291 | 16.943 ± 0.020 | 57,801.769249 | 16.965 ± 0.169 |
| 57,801.381370 | 16.706 ± 0.020 | 57,852.778253 | 17.116 ± 0.023 | 57,801.770752 | 16.855 ± 0.051 | 57,802.768061 | 17.028 ± 0.068 |
| 57,801.767629 | 16.695 ± 0.021 | 57,853.033500 | 17.161 ± 0.041 | 57,801.773653 | 16.942 ± 0.032 | 57,804.766226 | 17.033 ± 0.085 |
| 57,802.765060 | 16.657 ± 0.075 | 57,853.475840 | 17.202 ± 0.051 | 57,802.770988 | 17.047 ± 0.054 | 57,804.772667 | 17.028 ± 0.082 |
| 57,807.466797 | 16.782 ± 0.062 | 57,856.258205 | 17.288 ± 0.017 | 57,804.768896 | 16.947 ± 0.038 | 57,807.394323 | 17.051 ± 0.019 |
| 57,808.111048 | 16.793 ± 0.031 | 57,856.050972 | 17.269 ± 0.015 | 57,804.775336 | 16.951 ± 0.042 | 57,807.463757 | 17.057 ± 0.019 |
| 57,809.108328 | 16.746 ± 0.043 | 57,857.626176 | 17.452 ± 0.017 | 57,807.46984 | 16.987 ± 0.013 | 57,808.108029 | 17.075 ± 0.018 |
| 57,810.105714 | 16.798 ± 0.035 | 57,861.993962 | 17.869 ± 0.020 | 57,808.114082 | 17.031 ± 0.012 | 57,809.105297 | 17.078 ± 0.020 |
| 57,811.102868 | 16.813 ± 0.038 | 57,862.094179 | 18.079 ± 0.017 | 57,809.111372 | 16.997 ± 0.013 | 57,810.102676 | 17.064 ± 0.029 |
| 57,814.101241 | 16.837 ± 0.039 | 57,865.000261 | 18.517 ± 0.017 | 57,810.108736 | 16.969 ± 0.015 | 57,811.099824 | 17.108 ± 0.021 |
| 57,816.086183 | 16.810 ± 0.092 | 57,866.986331 | 19.081 ± 0.014 | 57,811.10591 | 17.022 ± 0.014 | 57,814.104309 | 17.080 ± 0.019 |
| 57,818.080712 | 16.779 ± 0.053 | 57,868.000318 | 18.976 ± 0.018 | 57,814.107262 | 17.065 ± 0.013 | 57,816.089192 | 17.082 ± 0.017 |
| 57,818.570966 | 16.812 ± 0.041 | 57,868.04205 | 18.920 ± 0.008 | 57,816.09213 | 17.035 ± 0.011 | 57,818.083761 | 17.070 ± 0.020 |
| 57,820.075244 | 16.743 ± 0.041 | 57,868.050433 | 18.908 ± 0.015 | 57,818.08672 | 17.014 ± 0.013 | 57,818.565527 | 17.039 ± 0.016 |
| 57,823.067088 | 16.808 ± 0.033 | 57,870.405355 | 18.377 ± 0.020 | 57,818.568201 | 16.995 ± 0.009 | 57,820.078283 | 17.066 ± 0.018 |
| 57,824.064272 | 16.816 ± 0.035 | 57,870.609638 | 18.283 ± 0.039 | 57,820.081237 | 17.018 ± 0.013 | 57,823.070125 | 17.118 ± 0.034 |
| 57,826.310092 | 16.773 ± 0.048 | 57,870.625248 | 18.276 ± 0.020 | 57,823.07308 | 17.051 ± 0.017 | 57,824.067304 | 17.109 ± 0.057 |
| 57,828.053927 | 16.818 ± 0.036 | 57,871.426129 | 18.011 ± 0.023 | 57,824.070279 | 17.025 ± 0.030 | 57,826.31414 | 17.119 ± 0.035 |
| 57,830.062119 | 16.954 ± 0.020 | 57,871.752167 | 17.778 ± 0.049 | 57,826.317063 | 17.042 ± 0.020 | 57,828.056969 | 17.115 ± 0.034 |
| 57,835.098306 | 16.847 ± 0.015 | 57,873.325745 | 17.273 ± 0.014 | 57,828.059935 | 17.047 ± 0.020 | 57,830.065173 | 17.182 ± 0.065 |
| 57,846.035396 | 16.882 ± 0.028 | 57,874.361536 | 17.533 ± 0.014 | 57,830.068147 | 17.208 ± 0.038 | 57,835.101317 | 17.223 ± 0.021 |
| 57,846.045207 | 16.895 ± 0.028 | 57,877.257184 | 17.567 ± 0.014 | 57,835.104243 | 17.105 ± 0.012 | 57,846.038429 | 17.259 ± 0.018 |
| 57,847.032727 | 16.888 ± 0.021 | 57,877.615258 | 17.565 ± 0.014 | 57,846.041383 | 17.162 ± 0.011 | 57,846.048233 | 17.272 ± 0.017 |
| 57,850.244833 | 17.021 ± 0.034 | 57,878.212070 | 17.516 ± 0.017 | 57,847.038727 | 17.163 ± 0.011 | 57,847.035765 | 17.284 ± 0.018 |
| 57,850.248495 | 17.056 ± 0.037 | 57,878.587685 | 17.641 ± 0.017 | 57,851.281824 | 17.340 ± 0.016 | 57,851.2789 | 17.453 ± 0.026 |
| 57,850.257411 | 17.055 ± 0.052 | 57,879.584894 | 17.718 ± 0.017 | 57,853.039507 | 17.412 ± 0.019 | 57,853.036542 | 17.520 ± 0.035 |
| 57,850.263663 | 17.034 ± 0.018 | 57,879.572086 | 17.572 ± 0.016 | 57,856.264113 | 17.695 ± 0.052 | 57,856.261181 | 17.870 ± 0.090 |
| 57,850.270962 | 17.030 ± 0.052 | 57,880.582335 | 17.897 ± 0.016 | 57,857.623409 | 17.676 ± 0.054 | 57,857.620736 | 18.014 ± 0.142 |
| 57,850.277968 | 17.021 ± 0.057 | 57,881.579571 | 17.892 ± 0.015 | 57,862.100176 | 18.264 ± 0.028 | 57,862.097209 | 18.294 ± 0.038 |
| 57,850.284849 | 17.034 ± 0.039 | 57,881.585786 | 17.958 ± 0.015 | 57,865.006267 | 18.865 ± 0.032 | 57,865.0033 | 18.993 ± 0.044 |
| 57,850.292388 | 16.979 ± 0.118 | 57,882.580111 | 17.904 ± 0.015 | 57,866.992334 | 19.371 ± 0.061 | 57,866.989368 | 20.290 ± 0.199 |
| 57,850.343168 | 16.995 ± 0.212 | 57,885.679478 | 18.657 ± 0.026 | 57,868.006302 | 19.521 ± 0.051 | 57,868.003333 | 19.549 ± 0.067 |
| 57,850.347353 | 17.039 ± 0.138 | 57,889.557676 | 18.396 ± 0.025 | 57,870.615676 | 18.813 ± 0.034 | 57,868.046237 | 19.721 ± 0.060 |
| 57,850.354417 | 17.060 ± 0.023 | 57,893.644986 | 18.154 ± 0.013 | 57,874.365153 | 17.730 ± 0.021 | 57,868.054629 | 19.588 ± 0.053 |
| 57,850.361243 | 17.046 ± 0.070 | 57,898.038157 | 19.034 ± 0.013 | 57,877.618386 | 17.769 ± 0.021 | 57,870.612631 | 18.900 ± 0.048 |
| 57,850.366324 | 17.065 ± 0.048 | 57,898.702179 | 18.929 ± 0.013 | 57,879.575198 | 17.885 ± 0.019 | 57,874.363361 | 17.899 ± 0.033 |
| 57,850.370319 | 17.089 ± 0.042 | 57,899.770325 | 18.705 ± 0.013 | ⋯ | ⋯ | 57,877.616871 | 18.121 ± 0.038 |
| 57,850.382741 | 17.007 ± 0.286 | 57,908.607852 | 20.909 ± 0.022 | ⋯ | ⋯ | 57,879.573685 | 18.180 ± 0.033 |
| 57,850.384097 | 17.018 ± 0.337 | 57,930.011298 | 21.352 ± 0.013 | ⋯ | ⋯ | 57,881.580338 | 18.441 ± 0.107 |
| 57,851.275926 | 17.065 ± 0.278 | 57,932.261395 | 20.916 ± 0.018 | ⋯ | ⋯ | 57,889.55952 | 18.230 ± 0.259 |
| 57,852.628351 | 17.189 ± 0.195 | 57,932.394386 | 21.069 ± 0.058 | ⋯ | ⋯ | 57,893.639086 | 18.656 ± 0.044 |
| 57,852.628407 | 17.191 ± 0.220 | 57,934.480869 | 20.791 ± 0.075 | ⋯ | ⋯ | 57,898.041195 | 19.803 ± 0.085 |
| 57,852.637699 | 17.152 ± 0.197 | 57,934.841549 | 20.210 ± 0.037 | ⋯ | ⋯ | 57,898.704951 | 19.368 ± 0.083 |
| 57,852.640745 | 17.216 ± 0.140 | ⋯ | ⋯ | ⋯ | ⋯ | 57,899.764824 | 19.234 ± 0.084 |
| 57,852.646999 | 17.299 ± 1.000 | ⋯ | ⋯ | ⋯ | ⋯ | 57,932.398345 | 21.198 ± 0.216 |
Download table as: ASCIITypeset image
3.2. Swift Observations
The Swift X-ray Telescope (XRT; Burrows et al. 2005) data were reduced using the Swift tools within heasoft v. 6.23 (Blackburn 1995). All observations were reprocessed using the tool xrtpipeline. The source light curves and spectra were extracted in the 0.3–10.0 keV band using a 20'' circular extraction region centered on the source position. Background data were extracted from an annular region with an inner radius of 30'' and an outer radius of 60''. In some photon counting (PC) mode observations (with average count rates higher than 0.5 counts s−1), about 2–4 pixels were removed from the center of the extraction region of the source to account for the pile-up. The 15–50 keV BAT (Barthelmy et al. 2005) daily light curve was also downloaded,24 and a 5 day binning was applied to it.
The Ultraviolet/Optical Telescope (UVOT; Roming et al. 2005) on board Swift operated in imaging mode during all observations. In each UVOT observation, the source was observed with at least one of the six available filters: uvw2, uvm2, uvw1, u, b, and v. The UVOT data were analyzed following Poole et al. (2008). We extracted the source photons from a circular region with a radius of 4''. Background data were extracted from an annular region with an inner radius of 15'' and an outer radius of 25''. We used the task uvotsource to determine the optical/UV flux.
4. Results
4.1. First Rapid Flux Decay
We show the optical and X-ray (15–50 keV) light curves of J1753 in Figure 2. The beginning of the X-ray light curve shows the decay of a FRED-type outburst (see also Figure 1 in Zhang et al. 2007). This is followed by an unusually long period of low-level activity (∼11 yr), with several lower-intensity peaks. After a short transition to a low-luminosity soft state in 2015 March–April (MJD ∼ 57,100; Shaw et al. 2016c), the source flux again went below the BAT detection limit by the end of 2016 September (MJD ∼ 57,660), when J1753 faded toward quiescence.
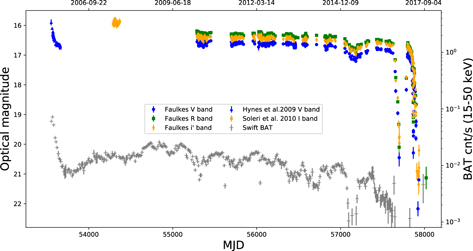
Figure 2. Optical (SMARTS data from Hynes et al. 2009 and Soleri et al. 2010 and our Faulkes/LCO data) and 15–50 keV X-ray (5 days binned) Swift-BAT light curve of J1753. Note the unusual low-luminosity soft state around MJD 57,100, the initial decay toward quiescence around MJD 57,650, and the rebrightening episodes at MJD ∼ 57,800–57,900.
Download figure:
Standard image High-resolution imageAfter the initial outburst peak in 2005, the optical light curve remained remarkably steady, around V ∼ 16.6; i' ∼ 16.4 mag from 2010 (MJD ∼ 55,200) to 2014 (MJD ∼ 57,000). The optical flux then gradually faded by 0.6 mag in both the V and i' bands during the 2015 transition to the low-luminosity soft state before subsequently recovering back to the hard state. From 2016 September (MJD ∼ 57,630) onward, the optical flux started a rapid decay (hereafter the "first decay"), and within ∼3 months (by MJD 57,700), the optical flux had faded by a factor of ∼30, becoming consistent with the quiescent flux upper limit (V ∼ 21 mag; Cadolle Bel et al. 2007; Neustroev et al. 2016). Assuming an exponential decay of the optical flux, we measure from MJD ∼ 57,630 to 57,700 an average decay rate of ∼0.051(3), 0.059(2), and 0.052(1) mag day−1 in the V, R, and i' bands, respectively. All quoted errors in the text are at 1σ c.l. if not otherwise specified.
We show in Figure 3 a zoom-in of the multiwavelength optical light curve from 2016 May onward to highlight the rebrightening episodes. Only three observations were taken by Swift during 2016; before the first decay and on November 6 and 7 near the end of the first decay (MJD 57,699). The source could not be detected with XRT and UVOT in November (or with radio facilities; Plotkin et al. 2016, 2017), further implying that the source was close to or in quiescence for the first time since its discovery (Shaw et al. 2016b). Then, up to the end of 2017 January, the source was Sun-constrained and not visible from the ground.
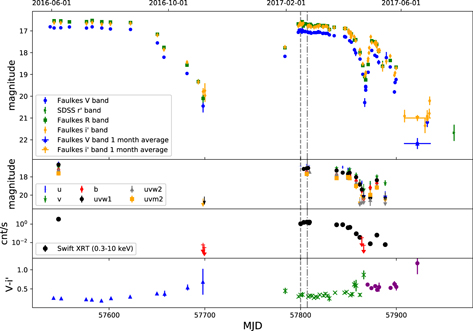
Figure 3. First panel: optical light curve of J1753 during the first decay and the following mini-outburst and reflares. The vertical lines represent MJD 57,800 and 57,807, when the optical flux and UV/X-ray fluxes peaked, respectively. Second panel: Swift-UVOT light curve in different filters. Downward arrows show upper limits. Third panel: Swift-XRT 0.3–10.0 keV light curve. Fourth panel: optical color (V to i') of J1753 with 2 day bins. The data with blue triangles, green crosses, and purple circles were observed during the first fade, the mini-outburst, and the reflares, respectively.
Download figure:
Standard image High-resolution image4.2. Bright Mini-outburst
When J1753 was again visible from the ground, on 2017 January 30 (MJD 57,783), it became clear that it had unexpectedly brightened at optical wavelengths (Al Qasim et al. 2017; see Figure 3). Subsequent radio (Bright et al. 2017), UV, and X-ray observations confirmed the flux increase in all bands (Kong 2017). According to our new classification method, this rebrightening after the main outburst is a mini-outburst (i.e., the flux reached quiescence, Δt1/tout ≪ 1, and F1/Fout ∼ 0.35 in the V band). The total duration of the first peak of the mini-outburst is ∼90 days (MJD 57,780–57,870).
We find that the optical, UV, and X-ray light curves are well correlated from MJD 57,800 onward. In the X-ray–UV bands, the mini-outburst seems to peak around MJD 57,807 (dotted–dashed vertical line in Figure 3), which is about 7 days after the optical flux peak (dashed vertical line around MJD 57,800). However, there are no UV data taken at the time of the optical peak, and the UV and X-ray coverage is sparse compared to that in the optical bands.
Interestingly, we find that the optical flux peaks at a value consistent with the extrapolation of the slow fading before the first decay, suggesting that the source somehow retains information about the previous flux decay (this was also the case for the first mini-outburst of GRO J0422+32 in 1993; e.g., Callanan et al. 1995). After the peak, J1753 remained bright for approximately 50 days, slowly fading. During the slow fade, the optical flux first decreased up to MJD ∼ 57,845 at a rate of 0.0037(5), 0.0039(6), and 0.0034(4) mag day−1 in the V, R, and i' bands, respectively (assuming an exponential decay). After MJD ∼ 57,845, the optical flux started to decrease rapidly (assuming an exponential decay) at a rate of 0.158(8), 0.112(4), and 0.098(4) mag day−1 in the V, R, and i' bands (with a corresponding decay in UV and X-ray fluxes as well). This is about two to three times faster than the decay rate of the first decay in 2016.
After reaching a minimum flux corresponding to V ∼ 20.3 mag on MJD 57,866, the optical flux started to rise again. We recorded a new rebrightening episode peaking at V = 17.9 mag on MJD 57,874 (Bernardini et al. 2017). Since the source did not reach quiescence before this second rebrightening, its properties have to be compared with that of the mini-outburst of which it is a part. In particular, F2/Fout ∼ 0.4, and the slope after the rebrightening peak is different from the slope of the mini-outburst decay. Consequently, we classify the second rebrightening as an ∼45 day long reflare (of the mini-outburst). There is at least another reflare shortly after the first (MJD 57,889).
After the reflares, the source went to quiescence again (likely between MJD 57,900 and 57,908). We combined our quiescent data into deep V- and i'-band images and calculated an average quiescent magnitude of V = 22.17 ± 0.25, i' = 21.00 ± 0.14 during 2017 June 2 to July 5 (see also Zhang et al. 2017b).
4.3. Color Evolution
Throughout the fading and rebrightening periods, there were large variations in the optical V to i' color (Figure 3, bottom panel). In Figure 4, we show the color–magnitude diagram (CMD) using 2 day bins of the data. The symbols correspond to different stages of the evolution of J1753. The color is bluer when brighter, and the general trend of the whole data set is well described by a simple model (Maitra & Bailyn 2008; Russell et al. 2011) of a single-temperature, constant-area blackbody heating and cooling. At the lower temperatures, the optical emission originates in the Rayleigh–Jeans tail of the blackbody, whereas at higher temperatures, it is coming from near the curved peak of the blackbody; this causes the color changes. We adopt the same method as Russell et al. (2011) to apply this model to the data of J1753. The model assumes an optical extinction of  = 0.45 ± 0.09 (Froning et al. 2014), the Cardelli et al. (1989) extinction law, and an orbital period of Porb = 3 hr. The source consistently follows the model during the fading and brightening periods of the mini-outburst and the reflares, implying that the optical emission is dominated by a characteristic disk radius with a temperature of ∼15,000 K during the period from 2010 to 2015, cooling down to ∼4000 K when the source is near quiescence (although the companion star may dominate at these low fluxes). This region has to be either the thermally emitting outer regions of the disk or the irradiated outer disk (e.g., Hynes 2005). We cannot distinguish this based on the emission area, since this depends on the uncertain distance of the source. However, in Shaw et al. (2019), sophisticated broadband fitting is applied to data from the rebrightening episodes of J1753, and a fully irradiated disk is favored from their modeling.
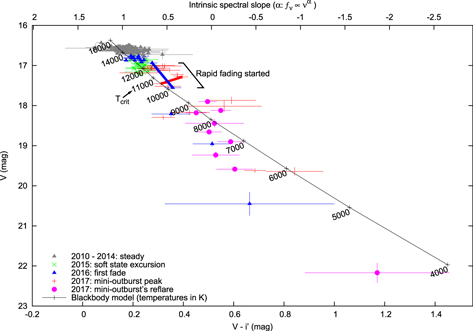
Figure 4. The CMD of the entire optical light curves. Blue colors are toward the left, red colors toward the right. Data were included when V and i' magnitudes were obtained within 2 days. The lower axis shows the (not dereddened) optical color between the V and i' bands. The upper axis shows the corresponding intrinsic (dereddened) spectral index α. The symbols denote the dates when the data were taken, with the epochs of soft state (2015) and fading and rebrightening events (2016–2017) shown as different symbols. The black solid line shows the blackbody model (see text) with temperatures in Kelvin indicated, ranging from 4000 K near quiescence to 16,000 K near the outburst peak. The data generally appear to follow the trend of the model, with some small excursions away from (redder than) the model. For the first rapid fade in 2016 and the fade of the mini-outburst in 2017, the fading started just as the source crossed the critical temperature Tcrit indicated in the figure (the thick blue and red lines indicate when the source crossed Tcrit).
Download figure:
Standard image High-resolution imageAccording to the irradiated DIM (IDIM), as the irradiated accretion disk gradually cools during the initial decay after outburst peak, a cooling wave develops in the outer disk that is at a critical photospheric temperature, rapidly shutting down the outburst (King & Ritter 1998, D01). This temperature corresponds to the minimum column density for the upper branch of the "S-curve," which, for an irradiated disk, is Tcrit ∼ 11,000 K (see Equation (A.2) in Lasota et al. 2008). We find from Figure 4 that the temperature of the emitting region is ∼11,000–12,000 K just when the source starts to fade rapidly. This occurs twice: once at the start of the first decay in 2016 (MJD 57,622–57,650) and again near the end of the mini-outburst in 2017 (MJD 57,848–57,852). These are shown in the CMD in Figure 4 as thick blue and red lines, respectively. On both occasions, the source crosses Tcrit, immediately fading rapidly, as expected in the IDIM as the cooling wave propagates through the disk. A similar process may have occurred in GRO J0422+32, in which there is a similar bluer-when-brighter behavior during the main outburst and the following two rebrightening events that, according to our classification method, are two mini-outbursts (see Figure 4 of Chevalier & Ilovaisky 1995).
This can explain why the source did not fade rapidly before 2016: because the outer disk temperature remained above Tcrit, so the entire disk was likely to be above the critical temperature. While the disk remained in this quasi-steady state above Tcrit, the mass transfer rate from the companion star must have been approximately equal to the mass accretion rate onto the compact object, since the viscous timescale is on the order of a month, much shorter than the 11 yr "standstill" period. In addition, there was no slow fade during the second mini-outburst in 2017 May–June because the disk remained below Tcrit, only reaching ∼9000 K, so it was likely that cooling fronts were still active, rapidly ending the outburst.
We note that there appear to be excursions away (redder) from the blackbody model near the peaks of the two mini-outbursts in Figure 4. This could be due to a changing area of the blackbody or a separate transient component redder than the disk that contributed to the optical flux at the time (e.g., synchrotron emission from the jet; Russell et al. 2011).
5. Discussion
The characteristics of the outburst of J1753 are peculiar in many ways. Three aspects of the outburst evolution are particularly interesting and not easily explained under the IDIM.
- 1.First, the 11 yr steady "standstill" period following the initial FRED is atypical and possibly unique. This requires the mass accretion rate onto the BH to be comparable to the mass transfer rate from the companion star. We find that the standstill can be due to the outer disk not cooling sufficiently and Tcrit not being reached, preventing a cooling front from forming. Why it took 11 yr for the source to reach Tcrit is unknown, although the 2015 low-luminosity soft state provides a clue, as it precedes the rapid fade. As a short orbital period system, J1753's irradiated disk is relatively small, so it is essentially missing the cool outer regions of a larger disk. This may have played a role in keeping the whole disk hotter than the critical temperature.
- 2.Second, rather than having low-amplitude reflares during the outburst fade, the source first reached close to quiescence and then suddenly brightened by >3 mag in the optical and ∼3 or more orders of magnitude in the X-ray during the mini-outburst. The amplitude of the rise into the mini-outburst is greater than expected from reflares, which have optical amplitudes of ∼1–2 mag at most (D01).
- 3.Third, the recurrence time between the end of the outburst and the start of the mini-outburst is very short, only a few months or less. This is insufficient time for the disk to be evaporated and filled in again before the mini-outburst. A further clue regarding the timing of the mini-outburst was suggested by Plotkin et al. (2017); see also Shaw et al. (2013). They identified a long-term X-ray modulation during the standstill with a period of ∼400 days and pointed out that the mini-outburst might be an extension of this long-term modulation (see their Figure 3).
Mini-outbursts are rare events, whereas reflares are commonly reported in the optical and X-ray light curves of BHXTs. Similar mini-outbursts have been observed from the BHXTs GRO J0422+32 (R band; Shrader et al. 1994; Chen et al. 1997), MAXI J1659–152 (X-rays; Homan et al. 2013), GRS 1739–278 (X-rays; Yan & Yu 2017; Corral-Santana et al. 2018), A0620–00 (optical; Charles 1998), and possibly GRS 1009−45 (V band; Chen et al. 1997).
The above systems all have short orbital periods in the range Porb ∼ 2.5–7 hr except GRS 1739–278, for which Porb is unknown, and we suggest that it may have a short orbital period. In fact, mini-outbursts have been detected from three out of the five BHXTs with periods ≤5.1 hr (see Table 2 in Shahbaz et al. 2013). The other two are XTE J1118+480 (Chaty et al. 2007), which in 2000 had a multipeak outburst according to our classification, and Swift J1357.2–0933, which did not have a mini-outburst following its 2011 or 2016 outbursts (but coverage was poor in the months after the 2011 outburst; see Russell et al. 2018, and references therein). The optical, X-ray, and radio (see also Plotkin et al. 2017; Shaw et al. 2019) monitoring of the mini-outburst and following reflares of J1753 represents the most complete multiwavelength coverage of such an event for a BHXT to date.
The optical light curves of the BHXT mini-outbursts are morphologically very similar to those of another class of short orbital period (a few hours) binaries, the DNe of the RZ LMi type (Hameury et al. 2000, and references therein), which exhibit short "superoutburst" duty cycles as low as ∼20 days (e.g., Osaki 1995). The DNe are cataclysmic variables, i.e., close binary systems that host accreting white dwarf primaries, and show much shorter outburst durations and recurrence times than BH or NS XTs (see Schreiber et al. 2003; Britt et al. 2015; Zhang et al. 2017a). Intriguingly, the first mini-outburst following a normal outburst of a BHXT or DN seems to usually peak at a flux level consistent with the extrapolation of the decay curve that precedes it. Mini-outbursts may be closely related to a critical temperature of the accretion disk corresponding to that flux. For J1753, we have demonstrated that this is indeed the case; when the rapid fade begins, the outer disk temperature is cooling and crossing the critical photospheric temperature needed for a cooling wave to develop, shutting down the outburst.
The DIM is able to reproduce the outburst light curves of DN mini-outbursts under the condition that the inner disk remains hot at the end of an outburst. In this case, when a cooling front develops in the disk, the density/temperature immediately below the front is high enough to start a new heating wave. The inward-moving cooling front is "reflected," and an outgoing heating front starts a new (mini)outburst (see, e.g., D01).
Perhaps the same mechanism could cause mini-outbursts in BHXTs if, like in DNe, there is a hot inner disk near the end of the outburst. There were no soft X-ray observations during the first fade of J1753 in 2016, so the inner disk radius is unknown at this time. However, in 2015, the source was observed in a unusual faint soft state, during which Shaw et al. (2016c) measured a disk inner radius of Rin ∼ 12–28 Rg at a temperature of kTin = 0.25 keV and an X-ray luminosity of ∼6 × 10⁻³LEdd. Therefore, J1753 is certainly capable of maintaining a hot inner disk at low luminosities. Presumably, during the first fade of J1753 in 2016, the source was in the low-hard state, which is usually characterized by a truncated disk. However, in the low-hard state of J1753 before 2016, evidence for the presence of a faint inner disk that resides at <20 Rg has been provided by iron line fitting, a soft excess in the continuum and variability spectra (Wilkinson & Uttley 2009; Kalamkar et al. 2013; Tomsick et al. 2015; Kajava et al. 2016). This is unusual for a BHXT in the low-hard state and could be an additional reason for J1753 to have a mini-outburst while many other (longer-period) systems do not.
We propose that BHXT mini-outbursts are actually fairly common in short-period (<7 hr) BHXTs, may be due to the presence of a hot inner disk at the end of the outburst decay, and arise from a sequence of heating and cooling front reflections in the accretion disk. Testing this would require a deep soft X-ray observation during an outburst fade to confirm the presence of a hot inner disk just before a mini-outburst. We speculate that in BHXTs with longer orbital periods, the disks are larger, and therefore the outermost regions of the disks are cooler than in short-period BHXTs. The inward-traveling cooling front may therefore take longer to reach the hot inner regions of the disk in long-period systems compared to short-period systems, by which time the inner disk may be truncated. Truncation typically occurs over several days to weeks during an outburst decay, which is a similar order of magnitude to the timescale for a heating/cooling front to move in/out (see, e.g., Bernardini et al. 2016). In the short-period systems, the temperature at the outer radius of the smaller disks will be higher than the temperature at the outer radius of the larger accretion disks of the longer-period systems (for the same accretion rate). The lack of cool outer regions in short-period XTs may cause the heating/cooling fronts to remain hot enough to initiate a new (mini)outburst, or the inner disk truncation radius may be somehow regulated by the small size of the disk and/or the hot flow at smaller radii. In addition, the hard-state nature of most of the outburst of J1753 (and most other short-period BHXTs) provides a clue about the state of the disk, i.e., that the irradiating source is hard and possibly extended (the hot flow/Comptonizing region is likely to be physically thicker than the inner disk), making it able to illuminate and heat the outer disk more readily than the soft photons from the inner disk. It is worth noting that long outbursts lasting several years or decades have been reported in some long-period XTs, e.g., GRS 1915+105 (>20 yr; Porb = 33.5 days), GRO J1655–40 (16 months; Porb = 2.6 days), and KS 1731–260 (12.5 yr; Porb ∼ 10 hr; Sobczak et al. 1999; Wijnands et al. 2001; Deegan et al. 2009; Zurita et al. 2010), although V404 Cyg had two very short outbursts in 2015–2016 (Muñoz-Darias et al. 2017). However, the NS system EXO 0748–676 had an outburst lasting 24 yr, and it has a 3.8 hr period (e.g., Hynes & Jones 2009).
5.1. Standstill
Since the beginning of the J1753 outburst is so well explained by the IDIM, it is worth investigating what makes its end different from what the standard version of the model predicts. During the long standstill period, the outer disk temperature is observed to be ∼15,000 K. This is most likely an irradiation temperature on the disk surface.25 Therefore,
where  . The mean flux during standstill is
  , corresponding to an accretion rate
  . For such an accretion rate, a temperature of ∼15,000 K corresponds to
  cm.
cm.
On the other hand, since the standstill corresponds to a steady stable disk, one must have  , where
  is the disk outer radius during standstill. The disk radius shrinks during the outburst decay, and a sudden enhancement of the mass transfer rate might reduce its value. For
  , the disk during standstill is stable when
  cm, consistent with the value deduced from the irradiation temperature. A fluctuation lowering the mass transfer rate from the companion star could end the standstill and trigger the decay of the outburst. Note that a detailed analysis of the standstill period based on broadband SED modeling is presented in Shaw et al. (2019).
5.2. The Outburst of J1753 According to the IDIM
Here we investigate how the initial decay from maximum of the J1753 outburst can be described by the IDIM. We assume a distance d = 3 kpc; a BH mass in solar units, m = 7; and an orbital period Porb = 3 hr. Using the formula (see, e.g., Lasota et al. 2008)

where Ph is the orbital period in hours, for the maximum disk radius, one obtains RD(max) = 8.3 × 1010 cm for J1753.
According to the IDIM, the maximum accretion rate (at the luminosity peak) is that of a (quasi)steady disk accreting at a constant rate of  , where

is the value of the minimum critical accretion for a hot, irradiated disk at its outer radius, RD = RD,101010 cm (Lasota et al. 2008), and  is a constant characterizing the outer disk irradiation by a central pointlike source. We ignore the very weak dependence on the viscosity parameter α.
Assuming  (Lasota et al. 2008; see, however, Tetarenko et al. 2018), one obtains
  g s−1 for the accretion rate at maximum of the J1753 outburst. For an accretion efficiency η = 0.1, this corresponds to a peak luminosity Lmax ≈ 1.2 × 1037 erg s−1. The observed X-ray flux at the peak of the J1753 outburst was
  erg cm−2 s−1, which at the assumed distance corresponds to Lmax ≈ 1.2 × 1037 erg s−1, which is in excellent agreement with the IDIM. Obviously, this excellence is a coincidence in view of the uncertainties in the values of the distance (Gandhi et al. 2018, which could well be further than the assumed 3 kpc; the GAIA parallax distance is unreliable),
  and η. Nevertheless, it shows that the IDIM can be successfully fit to describe the initial peak of the outburst of J1753, at least until the standstill.
This is confirmed by estimating the outburst decay time, which, according to the IDIM, is

where  is the Shakura–Sunyaev kinematic viscosity coefficient, cs ∝
  is the sound speed, Tc is the disk midplane temperature, and Ω = (GM/R3)1/2. Taking the critical midplane temperature
  corresponding to
  (Lasota et al. 2008) and the parameters assumed for J1753, one obtains for the decay timescale
  , where α0.2 = α/0.2 (i.e., we adopt α = 0.2). This is again in excellent agreement with observations of the first decay lasting ∼3 months.
5.3. Optical Fade during the 2015 Soft State
As mentioned in Section 3.1, the optical emission appears to gradually decrease by ∼0.6 mag in 2015 around MJD 57,100, which is when the source made a transition to the faint soft state (Shaw et al. 2016c). The optical flux then recovers, brightening back in the hard state, before starting the slow decay (Figure 2). A fade of the optical/infrared flux is common in the soft state in BHXTs and is usually attributed to the disappearance of the synchrotron jet component (e.g., Kalemci et al. 2013). However, this optical fade is usually more prominent in the infrared and less at optical wavelengths, with a large change in the color in the soft state. Such a color change is not apparent in J1753; in Figure 4, we find that the soft-state data (green crosses) lie on the blackbody line, as do the hard-state data just before and after the soft state, with a very similar color. The optical fade in the soft state is therefore unlikely to be due to a synchrotron component disappearing in this state. An excess has been detected in J1753 in the hard state, but only at longer wavelengths (Froning et al. 2014; Rahoui et al. 2015), not at optical wavelengths.
The soft X-ray flux increases in the soft state, as the inner disk is close to the BH and the inner disk temperature increases. Concurrently, the hard X-rays decrease as the power-law component fades in the soft state (this is visible in the Swift-BAT light curve; Figure 2). If the optical emission originates in the outer regions of the disk, the optical flux should remain approximately constant over the transition to/from the soft state (e.g., Russell et al. 2011). If the irradiated outer accretion disk produces the optical emission instead, the optical will be positively correlated with the X-ray emission. The optical flux of J1753 does not react to the increase of soft X-rays, which implies that it would be reprocessed hard X-rays. Since the X-ray power law in the hard state likely resides up to at least ∼100 keV (e.g., Tomsick et al. 2015; Kajava et al. 2016), and may even extend beyond 600 keV (Cadolle Bel et al. 2007), the bolometric luminosity is likely to be higher in the hard state than in the soft state. Moreover, as well as being more energetic, harder X-rays can penetrate further into the disk atmosphere and so heat the disk more efficiently. In addition, if the X-ray power law is elevated above the disk, such as in the lamppost model for the Comptonized region, these hard photons will more readily illuminate the outer disk compared to the inner regions of the disk itself. To summarize, the optical fade in the soft state is caused by a decrease either of intrinsic emission from the outer disk (for some unknown reason) or in the irradiation bump (if this is reprocessed hard X-rays).
6. Conclusions
In this paper, we have presented new optical, UV, and X-ray observations of the short orbital period BHXT Swift J1753.5–0127, focusing on the final stages of its 12 yr long outburst that started in 2005.
(i) We recorded a bright mini-outburst with a reflare at the end of the main outburst decay. We found from the optical colors that the temperature of the outer disk was ∼11,000 K when the source started to fade rapidly on both occasions. The mini-outburst had a peak flux consistent with the extrapolation of the previous decay before the first fade, which is similar to some mini-outbursts in other BHXTs.
(ii) According to the IDIM, ∼11,000 K is consistent with being the critical temperature (for an irradiated disk) when a cooling wave forms, accelerating the fade of the outburst, as is observed. The optical color could be a useful tool to predict decay rates in some XTs.
(iii) Based on available observations, we suggest that the X-ray binaries that have known mini-outbursts following an outburst are all short orbital period systems (<7 hr). Their smaller accretion disks may be a requirement for mini-outbursts to occur. Another requirement may be the existence of a hot inner disk at the end of the outburst, as was previously used to explain the mini-outbursts from RZ LMi–type cataclysmic variables.
(iv) In this paper, we also introduced for the first time a new method to classify rebrightening events quantitatively in NS/BH X-ray binaries.
The Faulkes Telescopes are maintained and operated by the Las Cumbres Observatory (LCO). The X-ray data were obtained from the High Energy Astrophysics Science Archive Research Center (HEASARC), provided by NASA's Goddard Space Flight Center and Astrophysics Data System Bibliographic Services. We thank the Swift Science Operations Team for performing the observations. The research reported in this publication was supported by the Mohammed Bin Rashid Space Centre (MBRSC), Dubai, UAE, under grant ID No. 201701.SS.NYUAD. G.Z. acknowledges funding support from the CAS Pioneer Hundred Talent Program Y7CZ181001. F.B. is funded by the European Union's Horizon 2020 research and innovation program under Marie Sklodowska-Curie grant agreement No. 664931. A.W.S. is supported by an NSERC Discovery Grant and a Discovery Accelerator Supplement. P.A.C. is grateful to the Leverhulme Trust for the award of a Leverhulme Emeritus Fellowship. R.M.P. acknowledges support from Curtin University through the Peter Curran Memorial Fellowship. The LCO data from this work are being used by F.L. and R.D. in their educational project, "Black Holes In My School." P.K. (teacher) and D.P. (pupil) represent one of the pilot schools in this project. J.P.L. was supported by the Polish NCN grant 2015/19/B/ST9/01099 and the French National Space Center CNES. J.C.A.M.J. is the recipient of an Australian Research Council Future Fellowship (FT140101082).
Footnotes
- 24
- 25
Here
 , so for R/Rin ≳ 103, the irradiation flux is always larger than the flux produced by viscosity.
