


Abstract
The radiative decay of a doubly excited autoionizing state is characterized by the dielectronic recombination in the photorecombination (PR) process. We calculate PR cross sections for the ground states of the Fe xxv and Ni xxvii ions by employing the Dirac R-matrix technique. The autoionizing states are treated in the framework of Davies and Seaton's theory to account for the radiative decay. The strengths of the KLL resonances that equate directly to the dielectronic satellite line strengths are evaluated. Besides, the Multiconfiguration Dirac Fock formalism is utilized to obtain the dielectronic satellite line strengths under the isolated resonance approximation. A very good agreement is found for the wavelengths and transition parameters belonging to the KLL autoionizing states with the previous theoretical and experimental results. The dominant KLL dielectronic satellite line strengths from both theoretical models are consistent with each other and are in good agreement with the established theoretical models and measurements at the electron beam ion trap.
Export citation and abstract BibTeX RIS
1. Introduction
Photorecombination (PR) has gained much attention in the past because of its importance in understanding the dynamics of the stellar objects, perturbing the ionization balance and emitted X-ray spectra (Kallman & Palmeri 2007). The PR process can follow radiative recombination (RR), which is the direct (nonresonant) transition from a free to bound state. In some cases a continuum electron is recombined with the N-electron target ion with simultaneous excitation of a core electron. As a result the (N + 1)-electron system enters into a doubly excited state. A doubly excited state or autoionizing state can either go back to an N-electron ion by autoionization or arrive at the bound state of the (N + 1)-electron system by radiative decay, thereby completing the dielectronic recombination (DR) process. The autoionizing states appear as resonances in the PR cross sections profile. In the DR process, radiative decay rates are either comparable or greater than the autoinization rates; therefore, the DR process is responsible for the radiation damping (RD) of these autoionizing resonances. In the emission spectrum, these resonances are accompanied with the parent lines of the recombining ion (Edwards 1970), but they are at longer wavelengths and therefore termed DR satellite lines. The shifting of the resonances toward longer wavelengths or lower energies is caused by the screening of the core due to the additional recombined electron (Savin 2000). The X-ray spectra of the highly charged ions, particularly H- and He-like ions, contain strong DR satellite lines due to the high rates of radiative decay (Nahar et al. 2009). The resonance spectra of these ions along with the satellite lines are helpful in determining the ionization equilibrium and diagnosing the temperature of the hot plasma (Gu 2003; Goryaev et al. 2017).
The K-shell X-ray emission lines of the most abundant element, Fe, have been observed in many astrophysical X-ray sources like active galactic nuclei, X-rays binaries, supernova remnants, clusters of galaxies, and active solar corona (Beiersdorfer et al. 1993). The K lines of the Ni have also been detected in a few astrophysical X-ray emission spectra (Palmeri et al. 2008). The new generation observatories Chandra, XMM-Newton, and Suzaku have provided highly resolved X-ray spectra originating from the astrophysical sources like starburst galaxy M82 (Strickland & Heckman 2007), galactic center black hole sagittarius A* (Xu et al. 2006), solar flares (Phillips 2004), and galactic center (Nobukawa et al. 2016). The Kα emission lines from these spectra for the Fe and Ni ions, particularly the Fe xxv and Ni xxvii ions, lie at ∼6.7 keV and ∼7.8 keV (∼1.8 Å and ∼1.6 Å) respectively. These Kα complexes contain main transition lines (1s2 1S0 → 1s2p 1P , 1s2 1S0 → 1s2p 3P
 , 1s2 1S0 → 1s2s 3S1), which are formed partially due to the collisional excitations and contributions from the DR satellite lines of the Fe xxv and Ni xxvii ions (Phillips 2004). The DR satellites are responsible for the small redshift and appear redward of the transition (1s2 1S0 →1s2p 1P
 ) (Xu et al. 2006). Therefore, the precise and accurate description of the DR satellites is essential for the determination of extrinsic macroscopic variables of the astrophysical sources (Nahar & Pradhan 2006).
Theoretically, the DR process can be treated in the nonperturbative formalism of the PR process by including the radiative decay channels in the scattering matrix S (Davies & Seaton 1969). Therefore, the RD of the resonances in the PR cross sections correspond to the DR process, and can be generalized to obtain the DR satellite lines (Nahar & Pradhan 2006). This is particularly important for the highly charged systems where the radiative decay rates from the doubly excited states compete effectively with the autoionizing rates, and the neglect of radiative damping leads to overestimation of the PR cross sections at resonances. Following the theory of Davies & Seaton (1969), Sakimoto et al. (1990) evaluated the radiatively damped PI and PR processes. In their treatment, the numerical fittings to the dipole matrix elements were made in the complex planes and then before evaluation of the scattering matrix, contour integration was performed. Later Pradhan & Zhang (1997), Zhang et al. (1999), Nahar et al. (2000, 2001), and Nahar & Pradhan (2003) adopted this scheme to calculate PI and PR cross sections for the H- and He-like ions. The dipole matrix elements were calculated using the Breit–Pauli R-matrix (BPRM) version family of codes. The BPRM code was also utilized by Gorczyca & Badnell (1997) to study the PR of the Fe xxv ion. They used RD optical potential (Robicheaux et al. 1995) to account for the RD effects. Nahar & Pradhan (2006) and Nahar et al. (2009) further extended the theoretical model of Sakimoto et al. (1990) to evaluate the strengths of the DR satellite lines of the He-like iron and nickel ions. The overlapping of the resonances were not considered in this scheme and dipole matrix elements were split into resonant and nonresonant contributions. Therefore, configuration mixing among the resonances can not be treated accurately in this scheme. Davies and Seaton's theory (Davies & Seaton 1969) of radiative decay of autoionizing states was also utilized by Zhao et al. (2000) to investigate the RD effects on the low-lying resonances in the PR of He like C. In their study, the integral in the scattering matrices was evaluated by numerical calculations of the Cauchy principle value, and the dipole matrix elements were obtained in the LS coupling approach from the R-matrix code of Berrington et al. (1995). Recently, same theoretical work of direct evaluation of the integral of the scattering matrices was also implemented by Zabaydullin & Dubao (2012, 2013) to investigate the photoionization and photoabsorption of the He- and Li-like ions. Based on the work of Zhao et al. (2000) and Zabaydullin & Dubao (2012), we solve the integrals in the scattering matrices numerically to obtain the radiatively damped PR cross sections for the Fe xxv and Ni xxvii ions. The resonances appearing in the PR cross sections are identified and the corresponding DR satellite line strengths are calculated for the comparison with the experiment and other theoretical results. We adopt a fully relativistic R-matrix approach (Chang 1977; Norrington & Grant 1981) for these highly charged ions, and the dipole matrix elements are obtained from the Dirac atomic R-matrix code.
The nonperturbative model of the PR process, described above, has the advantage of automatically incorporating all the effects of quantum interference among the resonances and also the interference of the DR with background (RR). Therefore, it is likely to achieve a better description of the KLL DR satellite spectra with this model. However, there exists a perturbative method of investigating the DR process, i.e., the isolated resonance approximation (IRA). This method is based on the separate computations of the radiative and autoinization rates, and the inclusion of RD is straightforward. This method has been utilized for quite some time to study the DR process and DR satellite spectra, and the works of Gabriel (1972), Vainshtein & Safronova (1978), Dubau et al. (1982), Chen (1986), Nilsen (1988), Kato et al. (1997), Savin et al. (2006), Novotný et al. (2012), and Goryaev et al. (2017) are some examples of this approach. The atomic structure calculations in these references are based on different theoretical models. In the present work, we carry out Dirac–Coulomb approximation of Dyall et al. (1989) to compute the radiative rates. The Hamiltonian also contains the Breit interactions and important QED effects. The KLL DR satellite line strengths of Fe xxv and Ni xxvii ions are also calculated under IRA. We aim to compare our Dirac R-matrix approach with the previous R-matrix and IRA approaches and to provide new data for the DR dielectronic satellite spectra of the Fe xxv and Ni xxvi ions.
In the rest of the paper we proceed as follows. Theoretical model based on Davies & Seaton (1969) and calculations under the IRA are described in Section 2. In Section 3, present findings from both approaches are compared with those obtained from the previous theories and experimental measurements. Finally, our study is briefly concluded in Section 4.
2. Theoretical Method
In the present study, the final recombined states (ground or excited) of the Fe xxiv and Ni xxvi ions are achieved either by RR (nonresonant process) or through the doubly excited intermediate state (DR resonant process). The later process can be shown schematically as
We have adopted the Dirac atomic R-matrix technique in which the Hamiltonian for the (N + 1)-electron system can be expressed in atomic units as (Sardar et al. 2015)
where j and k are indices for the individual electrons. Dirac matrices are represented by α and β, which are obtained from the Pauli spin and unit matrices. The rest mass of the electron is subtracted and Z is the charge on the heavy point nucleus. The first three terms of the Hamiltonian are one-electron terms and represent the momentum, mass, and Coulomb attraction between the electron and nucleus respectively. The last two-electron term accounts for the Coulomb repulsion of the electrons. In the R-matrix scheme, the system of (N + 1)-electrons in the internal region can be represented by the wavefunction Ψ as

In the above equation, ![$A[{{\rm{\Phi }}}_{i}^{N},{u}_{{ij}}]$](https://content.cld.iop.org/journals/0004-637X/869/2/128/revision1/apjaaeb89ieqn4.gif) represents the coupled wavefunction for the system of (N + 1) electrons with parity π and total angular momentum J. The coupled wavefunction is constructed from the target (N-electrons) state wavefunction
represents the coupled wavefunction for the system of (N + 1) electrons with parity π and total angular momentum J. The coupled wavefunction is constructed from the target (N-electrons) state wavefunction  and single electron state
 for
for  , being the relativistic angular quantum number. The antisymmetric operator, A, is responsible for the exchange effects between the free electron and target (N-electron system) ion. Furthermore,
  , constructed by adding the continuum electron state to the N-electron target states, accounts for the correlation function (capture states) of the (N + 1)-electron system, and is needed for the completeness and orthogonalization of wavefunction. The evaluation of the coefficients
  and
and  is done by the diagonalization of the Hamiltonian matrix
  of the (N + 1)-electron system.
The atomic state functions (ASFs) for the N-electron target ion are determined by performing SCF (self-consistent-field) calculations in the Multiconfiguration Dirac Fock (MCDF) approximation of grasp0. Radial wavefunctions are generated with the extended average level (EAL) in which radial equations are defined with an average of configurations approximation (Dyall et al. 1989). This scheme provides ASFs describing energy levels and transition parameters of the target ion with moderate accuracy. The radial wavefunctions have been determined for the orbitals 1s, 2s, 2p, 3s, 3p, and 3d, and then input to darc for atomic structure calculations of the target ions (Fe xxv and Ni xxvii) in the internal region of the R-matrix scheme. The 17 lowest target states of the target ion arising from configurations (1s , 1s2s, 1s2p, 1s3s, 1s3p, and 1s3d) are used to generate the (N + 1)-electron capture states of Fe xxiv and Ni xxvi ions.
The theoretical framework adopted in the present work for the radiatively damped PI and PR cross sections has been introduced by Davies & Seaton (1969). The higher order effects of the radiation field are taken into account by partitioning the scattering matrix S into different modes of interaction. Sakimoto et al. (1990) further introduce expressions for the PR and PI in the following forms:


where Dep represents the reduced dipole matrix and its matrix elements can be defined by
with E, ω, and α being the total energy, photon energy, and fine structure constant respectively. The bound and continuum states are specified by  J' and Eγ J respectively. The total angular momenta of the bound and continuum states are represented by J' and J respectively . We have carried out a fully relativistic R-matrix approach (darc) to obtain the dipole matrix elements for Jπ symmetries; 1/2e, 3/2e, 5/2e, 1/2o, and 3/2o. In Equations (5) and (6), L is responsible for the higher order effects of the radiation field and can be written into real and imaginary parts (Zabaydullin & Dubao 2012) as
The imaginary part is the Cauchy principle value integral and can be solved numerically. The probabilities for the PI and PR are given by (Sakimoto et al. 1990; Zhao et al. 2000)

where See is the submatrix for the electron scattering. The radiatively damped cross sections for the PI and PR are given in terms of probabilities for PI and PR:


where J and  are the total angular momenta of the final combined (target+e) state and initial (N + 1) bound state, respectively, in the PI process. In Equation (11) gt and k2 are the statistical weight of the target (recombining) state and incident electron's energy respectively. The undamped PI or PR cross sections can be obtained by neglecting the higher order effects (L ≃ 0). The PR cross sections are obtained for the ground states 1s2 1S0 of the Fe xxv and Ni xxvii ions. The ground 1s22s 2S1/2 and excited states 1s22p 2P1/2,3/2 of the Fe xxiv and Ni xxvi ions are taken as final recombined states in the PR process of electron recombining with the ground states of the Fe xxv and Ni xxvii ions. The cross sections are obtained at sufficiently fine energy mesh with the step of 0.000005 Ryd (≈68 μeV). This energy step is small enough to delineate and identify the closely lying resonances. The following integration is carried out to get the energy integrated cross section of a particular DR satellite line,

where S shows the resonance strength of the line and the extension of the line is delimited by initial (Ei) and final (Ef) energies.
The resonance strength for a particular KLL DR satellite line can also be determined in the IRA by defining (Beiersdorfer et al. 1992)

where a0, Ry, and me are Bohr radius, Rydberg energy, and electron mass, respectively. The resonance strength is evaluated in the unit of cm2 eV and Er is the resonance energy. The satellite line factor F2 can be expressed as

where  and
and  are the rates for the autoionization and radiative decay, respectively.
  ,
,  , and
, and  are the autoionizing (doubly excited) state, ground state of the recombining target ion, and lower state of the recombined ion, respectively; gd is the statistical weight of the state
  and gt is that of state
  . The first and second summations in the denominator include all the channels of autoionization and radiative decay from the autoionizing state
  . For the He- and Li-like ions, the first sum is equal to the autoionization decay rate
  . The radiative decay rate of the upper ASF ϒ' to lower ASF ϒ is calculated from dipole matrix elements (Chen 1986; Dyall et al. 1989),

where rank L is the tensor operator for the dipole transition. The ASFs are determined by diagonalizing the Dirac–Coulomb Hamiltonian. The Hamiltonian also includes low frequency transverse electron–electron interaction (Breit interaction) and the important effects of QED (polarization of vacuum and electron self-energy) are added as perturbations. In the present study, EAL calculations for eight configuration state functions (CSFs) arising from 1s2 nl (n = 2,3 and l = s, p, d), are followed by the configuration interaction calculations for 82 CFSs arising from 1snl nl' and 1snl nl'' (n = 2, 3; l,l' = s, p and l'' = s, p, d). Moreover, the autoionization rates are obtained from the transition matrix given by

where  are the initial excited bound states obtained from the MCDF approximation and
 ![$[{{\rm{\Phi }}}_{i}^{N},{u}_{{ij}}]$](https://content.cld.iop.org/journals/0004-637X/869/2/128/revision1/apjaaeb89ieqn26.gif) are the final states constructed by the coupling the partial wave of the free electron with the bound states
are the final states constructed by the coupling the partial wave of the free electron with the bound states  . V is the interaction operator and is sum over the Coulomb and Breit interactions. The final bound states
  after the autoionization process are also obtained from MCDF approximation. The single electron state
  and continuum orbitals of the free electron are obtained by the component auger of the ratip code (Fritzsche 2012).
3. Results and Discussion
Our main focus of the present study is to compare the results produced in two different approaches with each other and with previous experiments and theories. As described earlier, the DR satellite lines in the IRA method are related to the radiative and autoionization decay rates. Therefore, it is worthwhile to discuss these atomic parameters along with the wavelengths of the transitions.
3.1. Wavelengths, Radiative, and Autoinization Rates of the Autoionizing States of the Fe xxiv and Ni xxvi Ions
In Table 1 the present MCDF wavelengths of the KLL DR satellite transitions to the bound states of the Fe xxiv ion, are compared with other experimental and theoretical results. These transitions are assigned alphabetical notations according to Gabriel (1972). The wavelengths reported by the improved 1/Z-expansion (Goryaev et al. 2017) and relativistic many body perturbation theory (RMBPT; Safronova & Vainshtein 2004) methods are closer to the experimental results (Beiersdorfer et al. 1993); nevertheless, the present wavelengths are different from the experiment by only 2.2 × 10⁻⁴ Å on average. When compared to the previous MCDF (Chen 1986) and 1/Z-expansion (Vainshtein & Safronova 1978) calculations, the present MCDF wavelengths for most of the transitions lie closer to experimental observations (Beiersdorfer et al. 1993) and are in very good agreement with the improved theoretical results of Goryaev et al. (2017) and Safronova & Vainshtein (2004). In our adopted model of electronic configurations, we obtain transition wavelengths as close to experimental values as possible and with almost the same accuracy as that achieved in previous theoretical calculations. Moreover, we note that the wavelengths belonging to the transitions e, r, and u have better agreement than other existing calculations. For the KLL DR satellite transitions to the bound states of the Ni xxvii ion, the transition wavelengths from present MCDF calculations are tabulated in Table 2 along with different sets of experimental and theoretical data. It is evident from the comparison that the present calculated wavelengths are consistent with the improved 1/Z-expansion and Hartree–Fock Relativistic (HFR) results of Goryaev et al. (2017) and Palmeri et al. (2008), respectively, and do not exceed more than 2 × 10⁻⁴ Å on average. On the other hand, the present wavelengths deviate from the experimental measurements (Bombarda et al. 1988; Hsuan et al. 1987) in the similar amount as the other theoretical values.
Table 1. Present MCDF Wavelengths λ (Å) of the 22 KLL DR Satellite Transitions to the Bound States of the Fe xxiv Compared with the Experimental and Different Theoretical Values
| Key | Transitions | λ(Exp.) | λ(Present) | λ(MZa) | λ(RMBPT) | λ(MCDF) | λ(MZb) |
|---|---|---|---|---|---|---|---|
| a | 1s2p2 2P3/2  1s22p 2P3/2 1s22p 2P3/2 |
1.8621 | 1.8618 | 1.8621 | 1.8622 | 1.8622 | 1.8617 |
| b | 1s2p2 2P3/2  1s22p 2P1/2 1s22p 2P1/2 |
⋯ | 1.8574 | 1.8578 | 1.8577 | 1.8578 | 1.8573 |
| c | 1s2p2 2P  1s22p 2P 1s22p 2P
|
⋯ | 1.8670 | 1.8671 | 1.8673 | 1.8673 | 1.8667 |
| d | 1s2p2 2P  1s22p 2P 1s22p 2P
|
⋯ | 1.8625 | 1.8627 | 1.8628 | 1.8629 | 1.8623 |
| e | 1s2p2 4P  1s22p 2P 1s22p 2P
|
1.8724 | 1.8724 | 1.8726 | 1.8727 | 1.8730 | 1.8721 |
| f | 1s2p2 4P  1s22p 2P 1s22p 2P
|
⋯ | 1.8742 | 1.8743 | 1.8744 | 1.8747 | 1.8738 |
| g | 1s2p2 4P  1s22p 2P 1s22p 2P
|
⋯ | 1.8697 | 1.8699 | 1.8699 | 1.8702 | 1.8694 |
| h | 1s2p2 4P  1s22p 2P 1s22p 2P
|
⋯ | 1.8765 | 1.8766 | 1.8768 | 1.8771 | 1.8761 |
| i | 1s2p2 4P  1s22p 2P 1s22p 2P
|
⋯ | 1.8720 | 1.8722 | 1.8722 | 1.8725 | 1.8717 |
| j | 1s2p2 2D  1s22p 2P 1s22p 2P
|
1.8658 | 1.8655 | 1.8659 | 1.8659 | 1.8660 | 1.8654 |
| k | 1s2p2 2D  1s22p 2P 1s22p 2P
|
1.8633 | 1.8627 | 1.8630 | 1.8630 | 1.8631 | 1.8625 |
| l | 1s2p2 2D  1s22p 2P 1s22p 2P
|
⋯ | 1.8671 | 1.8674 | 1.8675 | 1.8676 | 1.8669 |
| m | 1s2p2 2S  1s22p 2P 1s22p 2P
|
1.8569 | 1.8561 | 1.8566 | 1.8567 | 1.8565 | 1.8562 |
| n | 1s2p2 2S  1s22p 2P 1s22p 2P
|
⋯ | 1.8517 | 1.8523 | 1.8522 | 1.8521 | 1.8519 |
| o | 1s2s2 2S  1s22p 2P 1s22p 2P
|
1.8968 | 1.8966 | 1.8969 | 1.8968 | 1.8973 | 1.8963 |
| p | 1s2s2 2S  1s22p 2P 1s22p 2P
|
1.8922 | 1.8920 | 1.8923 | 1.8922 | 1.8927 | 1.8918 |
| q | 1s2s2p 2P  1s22s 2S 1s22s 2S
|
1.8610 | 1.8607 | 1.8610 | 1.8610 | 1.8613 | 1.8605 |
| r | 1s2s2p 2P  1s22s 2S 1s22s 2S
|
1.8633 | 1.8634 | 1.8635 | 1.8636 | 1.8640 | 1.8630 |
| s | 1s2s2p 2P  1s22s 2S 1s22s 2S
|
⋯ | 1.8558 | 1.8563 | 1.8563 | 1.8564 | 1.8557 |
| t | 1s2s2p 2P  1s22s 2S 1s22s 2S
|
1.8569 | 1.8566 | 1.8571 | 1.8571 | 1.8571 | 1.8565 |
| u | 1s2s2p 4P  1s22s 2S 1s22s 2S
|
1.8734 | 1.8735 | 1.8738 | 1.8738 | 1.8742 | 1.8732 |
| v | 1s2s2p 4P  1s22s 2S 1s22s 2S
|
⋯ | 1.8746 | 1.8748 | 1.8748 | 1.8752 | 1.8743 |
Note. Exp.: experimental measurements at Princeton Large Torus tokamak (Beiersdorfer et al. 1993); MZa: theoretical values of Goryaev et al. (2017); RMBPT: theoretical values reported in Safronova & Vainshtein (2004); MCDF: calculations of Chen (1986); MZb: theoretical values from Vainshtein & Safronova (1978).
Download table as: ASCIITypeset image
Table 2. Present MCDF Wavelengths λ (Å) of the 22 KLL DR Satellite Transitions to the Bound States of the Ni xxvi Compared with the Experimental and Different Theoretical Values
| Key | Transitions | λ(Present) | λ(Exp.a) | λ(Exp.b) | λ(Exp.c) | λ(HFR) | λ(MZd) | λ(MZe) |
|---|---|---|---|---|---|---|---|---|
| a | 1s2p2 2P  1s22p 2P 1s22p 2P
|
1.5975 | 1.5950 | ⋯ | ⋯ | 1.5973 | 1.5977 | 1.5973 |
| b | 1s2p2 2P  1s22p 2P 1s22p 2P
|
1.5930 | 1.5899 | ⋯ | ⋯ | 1.5927 | 1.5933 | 1.5929 |
| c | 1s2p2 2P  1s22p 2P 1s22p 2P
|
1.6028 | 1.6004 | ⋯ | ⋯ | 1.6025 | 1.6028 | 1.6025 |
| d | 1s2p2 2P  1s22p 2P 1s22p 2P
|
1.5983 | 1.5953 | ⋯ | ⋯ | 1.5979 | 1.5984 | 1.5980 |
| e | 1s2p2 4P  1s22p 2P 1s22p 2P
|
1.6067 | 1.6046 | ⋯ | ⋯ | 1.6066 | 1.6068 | 1.6064 |
| f | 1s2p2 4P  1s22p 2P 1s22p 2P
|
1.6083 | 1.6066 | ⋯ | ⋯ | 1.6085 | 1.6083 | 1.6079 |
| g | 1s2p2 4P  1s22p 2P 1s22p 2P
|
1.6037 | ⋯ | ⋯ | ⋯ | 1.6039 | 1.6038 | 1.6034 |
| h | 1s2p2 4P  1s22p 2P 1s22p 2P
|
1.6108 | ⋯ | ⋯ | ⋯ | 1.6110 | 1.6108 | 1.6104 |
| i | 1s2p2 4P  1s22p 2P 1s22p 2P
|
1.6062 | 1.6040 | ⋯ | ⋯ | 1.6064 | 1.6063 | 1.6059 |
| j | 1s2p2 2D  1s22p 2P 1s22p 2P
|
1.6007 | 1.5983 | 1.6003 | 1.6010 | 1.6004 | 1.6009 | 1.6005 |
| k | 1s2p2 2D  1s22p 2P 1s22p 2P
|
1.5982 | 1.5956 | 1.5978 | 1.5985 | 1.5981 | 1.5984 | 1.5980 |
| l | 1s2p2 2D  1s22p 2P 1s22p 2P
|
1.6027 | 1.6007 | 1.6029 | 1.6036 | 1.6027 | 1.6028 | 1.6024 |
| m | 1s2p2 2S  1s22p 2P 1s22p 2P
|
1.5932 | 1.5910 | 1.5931 | 1.5938 | 1.5932 | 1.5935 | 1.5932 |
| n | 1s2p2 2S  1s22p 2P 1s22p 2P
|
1.5887 | 1.5859 | ⋯ | ⋯ | 1.5886 | 1.5891 | 1.5888 |
| o | 1s2s2 2S  1s22p 2P 1s22p 2P
|
1.6273 | 1.6252 | ⋯ | ⋯ | 1.6272 | 1.6274 | 1.6269 |
| p | 1s2s2 2S  1s22p 2P 1s22p 2P
|
1.6226 | 1.6199 | ⋯ | ⋯ | 1.6225 | 1.6229 | 1.6223 |
| q | 1s2s2p 2P  1s22s 2S 1s22s 2S
|
1.5968 | 1.5941 | 1.5962 | 1.5969 | 1.5966 | 1.5970 | 1.5965 |
| r | 1s2s2p 2P  1s22s 2S 1s22s 2S
|
1.5996 | 1.5973 | 1.5991 | 1.5998 | 1.5996 | 1.5996 | 1.5992 |
| s | 1s2s2p 2P  1s22s 2S 1s22s 2S
|
1.5927 | 1.5905 | ⋯ | ⋯ | 1.5928 | 1.5930 | 1.5926 |
| t | 1s2s2p 2P  1s22s 2S 1s22s 2S
|
1.5935 | 1.5911 | ⋯ | ⋯ | 1.5935 | 1.5938 | 1.5934 |
| u | 1s2s2p 4P  1s22s 2S 1s22s 2S
|
1.6076 | 1.6052 | ⋯ | ⋯ | 1.6075 | 1.6077 | 1.6073 |
| v | 1s2s2p 4P  1s22s 2S 1s22s 2S
|
1.6086 | 1.6066 | ⋯ | ⋯ | 1.6089 | 1.6087 | 1.6083 |
Note. Exp.a: experimental measurements at Joint European Torus tokamak (Bombarda et al. 1988); Exp.b: experimental measurements at tokamak Fusion Test Reactor (Hsuan et al. 1987), normalized with the parent He-like transition value of Vainshtein & Safronova (1978); Exp.c: experimental measurements at tokamak Fusion Test Reactor (Hsuan et al. 1987), normalized with the parent He-like transition value of Hsuan et al. (1987); HFR: theoretical values reported in Palmeri et al. (2008); MZd: theoretical values of Goryaev et al. (2017); MZe: theoretical values of Vainshtein & Safronova (1978).
Download table as: ASCIITypeset image
The comparisons of the present radiative and autoionization decay rates (Ar and Aa respectively) for the Fe xxiv ion with other theoretical results are made in Table 3. Generally, the present results for the majority of the strong transitions (Ar ≥ 1013 s−1) agree very well with the MCDF (Chen 1986), 1/Z-expansion (Goryaev et al. 2017), and autostructure (Palmeri et al. 2003) calculations with less than 5%. There are large differences for some weak transitions (Ar < 1013 s−1), but the average departure for all 22 transitions from the exiting calculations is well within 8%. Similarly, for most of the strong transitions (Aa ≥ 1013 s−1), the agreement of the autoionization rates from the present model of calculations is within 8% and 10% with the models of Chen (1986), Palmeri et al. (2003), and Goryaev et al. (2017) respectively. The previously reported autoinization rates (Chen 1986; Palmeri et al. 2003; Goryaev et al. 2017) tabulated in Table 3, have almost the same agreement with each other for the strong transitions. However, this agreement breaks up for the weak transitions (Aa < 1013 s−1) and all of the results have large deviations from each other. This indicates that the evaluation of the autoinization rates for weak transitions is strongly dependent on the model of calculations. Moreover, in terms of ratios of the previous theoretical values with respect to the present values, it is found that the present results are more consistent with MCDF calculations of Chen (1986; having average ratios 1.00 and 1.04 for radiative and autoionization rates, respectively) than other model of calculations. A similar situation arises for the transition data of the Ni xxvi ion in Table 4 while comparing with the 1/Z-expansion (Goryaev et al. 2017; Vainshtein & Safronova 1978) and superstructure (Palmeri et al. 2008) calculations. The comparison with the 1/Z-expansion calculations shows that for strong transitions (Ar, Aa ≥ 1013 s−1), our radiative and autoionization rates have an accuracy of ≈10% on average, while large differences in autoionization rates are observed for the particular lines with rates <1013 s−1. The discrepancies in the superstructure calculations of Bombarda et al. (1988) may be attributed to their procedure of optimization of the atomic orbitals (Palmeri et al. 2008).
Table 3. Present Radiative Ar (1013 s−1) and Autoionization Aa (1013 s−1) Rates from the Upper 22 Autoionizing Levels of the Fe xxiv ion Compared with Previous Theoretical Radiative and Autoionization Rates
| Present | MZa | MCDFb | AST3c | Radiative Branching Ratio | |||||||
|---|---|---|---|---|---|---|---|---|---|---|---|
| Key | Ar | Aa | Ar | Aa | Ar | Aa | Ar | Aa | η = Ar/(Ar+Aa) % | ||
| a | 59.0 | 3.56 | 62.1 | 3.49 | 56.4 | 3.14 | 60.7 | 3.28 | 94.31 | ||
| b | 0.75 | 3.56 | 0.863 | 3.49 | 0.757 | 3.14 | 0.969 | 3.28 | 17.40 | ||
| c | 16.1 | 0.0856 | 16.5 | 0.0688 | 15.3 | 0.164 | 16.0 | 0.0939 | 99.47 | ||
| d | 52.3 | 0.0856 | 54.4 | 0.0688 | 49.7 | 0.164 | 53.1 | 0.0939 | 99.84 | ||
| e | 3.38 | 2.28 | 3.51 | 2.22 | 3.17 | 2.17 | 3.58 | 2.61 | 59.72 | ||
| f | 1.02 | 0.0844 | 1.01 | 0.0848 | 0.967 | 0.0430 | 1.06 | 0.0966 | 92.36 | ||
| g | 0.0032 | 0.0844 | 0.0024 | 0.0848 | 0.00342 | 0.0430 | 0.00451 | 0.0966 | 3.65 | ||
| h | 0.01 | 0.0187 | 0.0093 | 0.0212 | 0.0127 | 0.0153 | 0.00912 | 0.0337 | 34.84 | ||
| i | 2.11 | 0.0187 | 2.10 | 0.0212 | 1.98 | 0.0153 | 2.17 | 0.0337 | 99.12 | ||
| j | 20.5 | 14.2 | 21.6 | 13.5 | 19.8 | 14.2 | 20.5 | 13.7 | 59.08 | ||
| k | 31.0 | 13.1 | 32.7 | 12.1 | 29.6 | 12.7 | 31.4 | 12.5 | 70.29 | ||
| l | 4.15 | 13.1 | 3.90 | 12.1 | 3.80 | 12.7 | 3.64 | 12.5 | 24.06 | ||
| m | 23.3 | 2.24 | 24.3 | 2.52 | 22.2 | 2.72 | 24.0 | 2.92 | 91.23 | ||
| n | 1.11 | 2.24 | 1.09 | 2.52 | 1.08 | 2.72 | 1.03 | 2.92 | 33.13 | ||
| o | 0.897 | 14.2 | 0.907 | 13.4 | 0.836 | 14.2 | 0.952 | 14.3 | 5.94 | ||
| p | 0.884 | 14.2 | 0.875 | 13.4 | 0.825 | 14.2 | 0.927 | 14.3 | 5.86 | ||
| q | 46.6 | 0.0032 | 48.7 | 0.00671 | 44.3 | 0.0574 | 47.1 | 0.0141 | 99.99 | ||
| r | 31.0 | 4.73 | 31.9 | 3.05 | 28.9 | 4.83 | 30.1 | 4.24 | 86.76 | ||
| s | 0.203 | 11.2 | 0.0778 | 10.6 | 0.323 | 10.5 | 0.419 | 10.7 | 1.78 | ||
| t | 16.9 | 8.41 | 17.9 | 7.62 | 16.8 | 7.00 | 18.6 | 6.77 | 66.77 | ||
| u | 1.61 | 0.071 | 1.59 | 0.0699 | 1.54 | 0.171 | 1.55 | 0.0391 | 95.78 | ||
| v | 0.506 | 0.0079 | 0.492 | 0.00887 | 0.486 | 0.00557 | 0.497 | 0.00133 | 98.46 | ||
Note. The key notations belong to the same transitions as those indicated in Tables 1 and 2. MZa: 1/Z-expansion calculations from Goryaev et al. (2017); MCDFb: MCDF calculations from Chen (1986); AST3c: autostructure calculations from Palmeri et al. (2003).
Download table as: ASCIITypeset image
Table 4. Present Radiative Ar (1013 s−1) and Autoionization Aa (1013 s−1) Rates from the Upper 22 Autoionizing Levels of the Ni xxvi ion Compared with Previous Theoretical Radiative and Autoionization Rates
| Present | MZa | Autob | MZc | Radiative Branching Ratio | |||||||
|---|---|---|---|---|---|---|---|---|---|---|---|
| Key | Ar | Aa | Ar | Aa | Ar | Aa | Ar | Aa | η = Ar/(Ar+Aa) % | ||
| a | 78.4 | 3.80 | 82.9 | 3.97 | 83.5 | 3.75 | 82.6 | 4.65 | 95.38 | ||
| b | 0.638 | 3.80 | 0.435 | 3.97 | 1.17 | 3.75 | 0.744 | 4.65 | 14.38 | ||
| c | 20.8 | 0.112 | 21.3 | 0.084 | 20.1 | 0.12 | 21.2 | 0.107 | 99.46 | ||
| d | 70.0 | 0.112 | 73.2 | 0.084 | 73.2 | 0.12 | 72.9 | 0.107 | 99.84 | ||
| e | 6.59 | 3.13 | 6.8 | 3.18 | 6.65 | 3.39 | 6.76 | 3.73 | 67.80 | ||
| f | 1.83 | 0.105 | 1.84 | 0.111 | 1.48 | 0.21 | 1.83 | 0.131 | 94.57 | ||
| g | 0.00755 | 0.105 | 0.00543 | 0.111 | ⋯ | ⋯ | 0.00527 | 0.131 | 6.71 | ||
| h | 0.01067 | 0.035 | 0.00861 | 0.0377 | ⋯ | ⋯ | 0.010 | 0.0577 | 23.36 | ||
| i | 4.17 | 0.035 | 4.49 | 0.0377 | 4.28 | 0.02 | 4.50 | 0.0577 | 99.17 | ||
| j | 26.0 | 12.6 | 27.4 | 12.7 | 27.4 | 13.8 | 27.3 | 14.9 | 67.36 | ||
| k | 42.6 | 12.2 | 45.2 | 11.8 | 44.1 | 13.2 | 45.0 | 13.8 | 77.74 | ||
| l | 7.07 | 12.2 | 6.86 | 11.8 | 5.49 | 13.2 | 6.79 | 13.8 | 36.69 | ||
| m | 33.0 | 2.43 | 34.6 | 2.66 | 36.0 | 3.06 | 34.5 | 3.36 | 93.14 | ||
| n | 0.97 | 2.43 | 0.95 | 2.66 | 0.8 | 3.06 | 0.941 | 3.36 | 28.53 | ||
| o | 1.07 | 14.4 | 1.10 | 13.4 | 0.94 | 13.8 | 1.03 | 14.5 | 6.97 | ||
| p | 1.23 | 14.4 | 1.22 | 13.4 | 1.19 | 13.8 | 1.21 | 14.5 | 7.87 | ||
| q | 62.6 | 0.036 | 65.7 | 0.0439 | 64.8 | 0.10 | 65.4 | 0.118 | 99.94 | ||
| r | 38.7 | 5.97 | 39.9 | 3.61 | 34.8 | 4.10 | 39.9 | 3.79 | 86.64 | ||
| s | 0.02526 | 11.5 | 0.00109 | 10.6 | 0.29 | 10.7 | 0.00266 | 11.9 | 0.22 | ||
| t | 26.2 | 8.13 | 27.9 | 7.17 | 32.4 | 6.83 | 27.7 | 8.32 | 76.32 | ||
| u | 3.17 | 0.116 | 3.13 | 0.108 | 2.95 | 0.13 | 3.10 | 0.124 | 96.47 | ||
| v | 0.961 | 0.0115 | 0.935 | 0.0125 | 0.81 | 0.03 | 0.903 | 0.0335 | 98.82 | ||
Note. The key notations belong to the same transitions as those indicated in Tables 1 and 2. MZa: 1/Z-expansion calculations of Goryaev et al. (2017); Autob: autostructure (Bombarda et al. 1988) calculations; MZc: 1/Z-expansion calculations of Vainshtein & Safronova (1978).
Download table as: ASCIITypeset image
In brief, our results for the atomic data of both ions are consistent with the experimental and different theoretical results.
3.2. KLL DR Satellite Lines Strengths from Dirac R-matrix and IRA Calculations
In Tables 3 and 4, the radiative branching ratios from the present calculations are also tabulated along with autoionization and radiative and rates. These branching ratios are in general agreement with other theoretical results. Moreover, these radiative branching ratios also provide an estimation of the reduction in magnitude of the resonances due to the RD. In the PR cross sections, these radiatively damped resonances are related to the DR process and are observed as DR satellites of the Fe xxv and Ni xxvii ions in the laboratory and astrophysical sources. Both damped and undamped PR cross sections for the ions Fe xxv and Ni xxvii are plotted in Figures 1 and 2, respectively, against photoelectron energy. These cross sections correspond to the KLL energy regions, i.e., the intermediate autoionizing states are formed due to the excitations from K- to L-shell. Figures 1 and 2 represent the cross sections for the recombining of the ground states of Fe xxv and Ni xxvii ions with the electron, and formation of the final recombined states 1s22s 2S1/2, 1s22p 2P1/2, and 1s22p 2P3/2 (panels a, b, and c respectively) of the Fe xxiv and Ni xxvi ions. The resonances in both figures are assigned alphabetical notations according to the order of Gabriel (1972). The damped PR cross sections shown in Figures 1 and 2 for both ions, produce 22 KLL resonances with similar line profiles. Moreover, the PR cross sections for both ions follow similar patterns, but with different resonance peak values, as those shown in Figures 1 and 2 of Nahar & Pradhan (2006) respectively. The differences are attributed to the different numerical methods adopted in the treatment of damped PR cross sections. The amount of reduction in the peak of each resonance is different depending on its radiative branching ratio. This provides an accuracy check for the present numerical scheme for the radiatively damped PR cross section calculations. The resonances with very large radiative rates as compared to the autoionization rates, for instance c, d, i, and q, have pronounced effects of RD. These narrow resonances (small autoinization rate) have significant contributions in RD (Zhao et al. 2000), and need very high energy resolution to estimate the extent of RD effects.
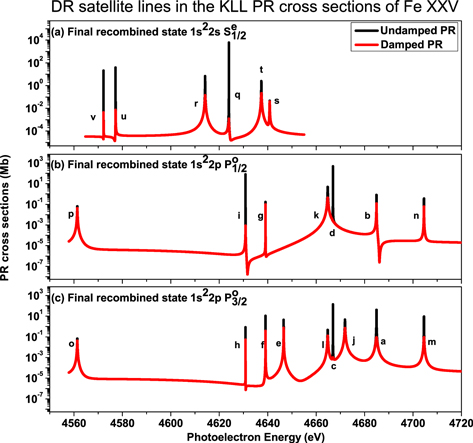
Figure 1. Radiatively undamped and damped KLL PR cross sections for the ground state of the Fe xxv from the present Dirac R-matrix approach. Panels a, b, and c correspond to the final recombined states 1s22s  , 1s22p
  , and 1s22p
  . Resonances in each panel are identified as KLL DR satellite lines and assigned alphabetical notations according to Gabriel (1972).
Download figure:
Standard image High-resolution image
Figure 2. Same as Figure 1, but for Ni xxvii.
Download figure:
Standard image High-resolution imageThe effects of RD are highlighted in Figures 3 and 4. The PR cross sections (with and without RD) are plotted for some strong resonances of the Fe xxv ion in Figure 3. These resonances have easily noticeable RD effects, particularly the peak value of the resonance 1s2p2 2P3/2 is reduced by a factor of near 200. In Figure 4 we present the total PR cross sections (with and without RD) of the Fe xxv ion on a linear scale. In the linear scale all the KLL resonances can be identified and the RD effects are noticeable for some of the resonances. There are very large differences in the the peak values of damped and undamped cross sections for most of the resonances. Therefore, in order to show the overall RD effects on the total PR cross sections, we convolute the total PR cross sections with a 50 eV FWHM, which is equal to the electron beamwidth in the electron beam ion trap (EBIT) experiment (Beiersdorfer et al. 1992). These convoluted PR cross sections (with and without RD) are also plotted in Figure 4. We note that after the convolution the RD effects are more pronounced and the overall strength of the PR cross sections is damped by a factor of almost 7. It should be mentioned that the same amount of damping has also been reported by Gorczyca & Badnell (1997) in their treatment of the PR cross sections of the Fe xxv ion.
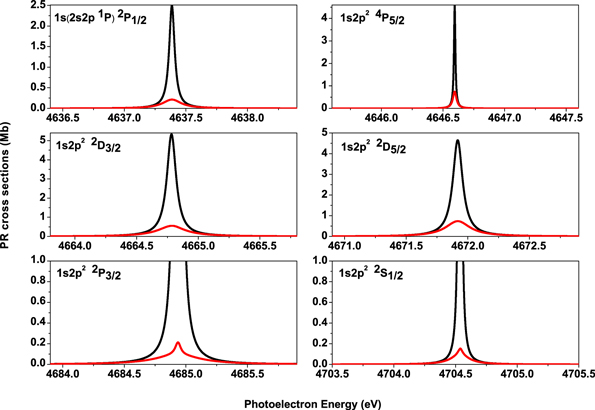
Figure 3. RD effects on some strong resonances in the KLL PR cross sections of Fe xxv: black solid line without damping, red solid line with damping. Note that the peak values of the undamped cross sections for the resonances 1s2p2 2P and 1s2p2 2S
 are 42.07 and 9.7, respectively.
Download figure:
Standard image High-resolution image
Figure 4. Total KLL PR cross sections for the Fe xxv ion, convoluted with 50 eV FWHM: solid black line (undamped), red solid line (damped), blue solid line (convoluted undamped), green solid line (convoluted damped).
Download figure:
Standard image High-resolution image
In the following the comparison is made for the resonance strengths of the KLL DR satellite lines. For this purpose we carry out integration (Equation (12)) of the damped PR cross sections of the Fe xxv and Ni xxvii ions. The PR cross sections usually contain the RR part, which appears as a plateaued background in the cross section profiles. But for the highly charged ions considered in the present study, major contributions to the PR cross sections come from the DR process (Zhang et al. 1999), and RR has no significant influence on the integration path. There is a total of 22 resonances in three panels of the Figures 1 and 2, corresponding to the KLL DR satellite lines. The integration is performed for each resonance individually. These lines are well isolated; therefore, the interference of the resonances has negligible influence on the accuracy. It can be noted that the weak lines c and d, which lie on the strong lines k and l, respectively, apparently damped out completely in both figures. However, these can be observed while zooming into the PR cross sections that range from 0 to 0.001 Mb and thus integration can be performed around their peaks.
In Table 5, our DR satellite line strengths from two independent and entirely different approaches, i.e., damped Dirac R-matrix and IRA calculations, are compared with each other. The results from BPRM calculations with different treatment of RD (Nahar & Pradhan 2006; Nahar et al. 2009), are also tabulated in this table. For comprehensive comparison, Table 5 also contains the previous IRA results based on different theoretical models (Vainshtein & Safronova 1978; Dubau et al. 1982; Chen 1986; Nilsen 1988). In this table the related energies of satellites are also compared with the BPRM calculations and observations at EBIT (Beiersdorfer et al. 1992). The present energies are in good agreement (within 0.38 eV on the average) with the BPRM calculations of Nahar & Pradhan (2006). However, the observed energies (Beiersdorfer et al. 1992) are lower (≈7 eV on the average) than those from both theoretical calculations. It is revealed by a close inspection that our IRA resonance strengths are in respectable agreement with the previous IRA calculations for most of the satellite lines. Moreover, for strong and intermediate satellite line strengths (≥10−20 cm2 eV), we find a close agreement of our Dirac R-matrix calculations with not only IRA calculations but also with BPRM calculations of Nahar & Pradhan (2006) and Nahar et al. (2009). This is important because these strong and intermediate line strengths for the satellites j, k, a, t, r, e, m, o, and p, dominate the total KLL DR resonance strength. This ascertains the reliability of the present damped Dirac R-matrix calculations, keeping in view that these are based on a different approach. It should be mentioned that the present line strengths for the satellites l, b, and n have larger values that can be attributed to the larger values of the reduced dipole matrix elements for these satellite transitions. We assume that these larger dipole matrix elements may have been missed in the BPRM calculations (Nahar & Pradhan 2006; Nahar et al. 2009) due to a larger energy step. Moreover, we note that there are large differences among all the theoretical models for the weak satellite lines. Although the overall KLL spectrum is dominated by the strong lines, these weak lines are important contributors to the RD effects and are essential for the accurate description of the Kα spectra of highly charged ions. The highly sensitive experimental findings are needed to assess the accuracy of all the theoretical models.
Table 5. Present Resonance Energies E (eV) and Strengths S (10−20 cm2 eV) from Dirac R-matrix and IRA Calculations for the 22 KLL DR Satellite Lines Fe xxv ion Compared with Different Theoretical Models
| Key | Transitions | E(Exp.) | E(present) | Ea | S(DARC) | Sa | S(IRA) | Sb | Sc | Sd | Se |
|---|---|---|---|---|---|---|---|---|---|---|---|
| o | 1s2s2 2S  1s22p 2P 1s22p 2P
|
4553.4 | 4561.4 | 4561.5 | 0.83 | 0.89 | 0.87 | 0.84 | 0.91 | 0.82 | 0.94 |
| p | 1s2s2 2S  1s22p 2P 1s22p 2P
|
4553.4 | 4561.4 | 4561.5 | 0.81 | 0.88 | 0.85 | 0.85 | 0.92 | 0.80 | 0.91 |
| v | 1s2s2p 4P  1s22s 2S 1s22s 2S
|
4566.3 | 4572.2 | 4572.2 | 0.02 | 0.06 | 0.008 | 0.03 | 0.02 | 0.01 | 2.9(−3) |
| u | 1s2s2p 4P  1s22s 2S 1s22s 2S
|
4570.1 | 4577.2 | 4577.5 | 0.06 | 0.16 | 0.15 | 0.17 | 0.02 | 0.04 | 0.15 |
| r | 1s2s2p 2P  1s22s 2S 1s22s 2S
|
4604.9 | 4614.2 | 4612.6 | 4.46 | 3.80 | 4.40 | 3.13 | 3.62 | 4.45 | 3.68 |
| q | 1s2s2p 2P  1s22s 2S 1s22s 2S
|
4615.3 | 4623.9 | 4624.1 | 0.08 | 0.08 | 0.007 | 0.11 | 0.02 | 0.12 | 2.0(−3) |
| i | 1s2p2 4P  1s22p 2P 1s22p 2P
|
4624.6 | 4630.9 | 4629.9 | 0.04 | 0.08 | 0.02 | 0.04 | 0.02 | 0.02 | 0.03 |
| h | 1s2p2 4P  1s22p 2P 1s22p 2P
|
4624.6 | 4630.9 | 4629.9 | 7.0(−3) | 5.5(−3) | 9.4(−5) | 1.8(−4) | 2.1(−4) | 1.0(−4) | 1.0(−4) |
| f | 1s2p2 4P  1s22p 2P 1s22p 2P
|
4632.9 | 4639.1 | 4638.8 | 0.27 | 0.37 | 0.17 | 0.20 | 0.26 | 0.09 | 0.16 |
| t | 1s2s2p 2P  1s22s 2S 1s22s 2S
|
4631.2 | 4637.4 | 4637.3 | 6.00 | 5.52 | 6.00 | 6.35 | 5.83 | 5.28 | 5.77 |
| g | 1s2p2 4P  1s22p 2P 1s22p 2P
|
4632.9 | 4639.1 | 4638.8 | 0.04 | 0.01 | 5.2(−4) | 4.5(−3) | 4.0(−4) | 4.1(−4) | 5.6(−4) |
| s | 1s2s2p 2P  1s22s 2S 1s22s 2S
|
4633.2 | 4640.8 | 4639.8 | 0.52 | 1.29 | 0.43 | 0.15 | 0.90 | 0.67 | 0.24 |
| e | 1s2p2 4P  1s22p 2P 1s22p 2P
|
4639.0 | 4646.6 | 4646.6 | 4.16 | 4.85 | 4.35 | 4.80 | 4.28 | 4.12 | 4.32 |
| k | 1s2p2 2D  1s22p 2P 1s22p 2P
|
4658.1 | 4664.8 | 4664.4 | 19.81 | 17.43 | 17.90 | 19.60 | 18.60 | 17.27 | 17.53 |
| d | 1s2p2 2P  1s22p 2P 1s22p 2P
|
4658.6 | 4666.9 | 4666.9 | 0.10 | 0.78 | 0.07 | 0.07 | 0.07 | 0.13 | 0.08 |
| l | 1s2p2 2D  1s22p 2P 1s22p 2P
|
4658.1 | 4664.8 | 4664.4 | 3.43 | 1.45 | 2.39 | 2.32 | 1.79 | 2.22 | 2.22 |
| c | 1s2p2 2P  1s22p 2P 1s22p 2P
|
4658.6 | 4666.9 | 4666.8 | 0.09 | 0.17 | 0.02 | 0.02 | 0.02 | 0.04 | 0.03 |
| j | 1s2p2 2D  1s22p 2P 1s22p 2P
|
4664.1 | 4671.9 | 4672.1 | 27.70 | 26.82 | 26.70 | 29.15 | 27.22 | 26.27 | 26.90 |
| b | 1s2p2 2P  1s22p 2P 1s22p 2P
|
4677.0 | 4684.9 | 4685.2 | 0.99 | 0.21 | 0.09 | 0.11 | 0.13 | 0.08 | 0.09 |
| a | 1s2p2 2P  1s22p 2P 1s22p 2P
|
4677.0 | 4684.9 | 4685.3 | 6.50 | 6.12 | 7.01 | 8.11 | 6.40 | 6.24 | 6.88 |
| m | 1s2p2 2S  1s22p 2P 1s22p 2P
|
4697.7 | 4704.5 | 4704.7 | 2.63 | 2.75 | 2.06 | 2.91 | 2.56 | 2.44 | 2.41 |
| n | 1s2p2 2S  1s22p 2P 1s22p 2P
|
4697.7 | 4704.5 | 4704.7 | 0.46 | 0.13 | 0.10 | 0.13 | 0.09 | 0.12 | 0.11 |
Note. E(Exp.): Experimental energies from Beiersdorfer et al. (1992). Ea: present theoretical energies from Dirac R-matrix calculations; S(DARC): present resonance strengths from Dirac R-matrix calculations; S(IRA): present IRA-based MCDF calculations for the resonance strengths; Sa: MCBP calculations of Nahar & Pradhan (2006) and Nahar et al. (2009); Sb: IRA-based calculations from Vainshtein & Safronova (1978); Sc: IRA-based calculations from Dubau et al. (1982); Sd: IRA-based calculations from Chen (1986); Se: IRA-based calculations from Nilsen (1988).
Download table as: ASCIITypeset image
The experimental observations at EBIT are reported by Beiersdorfer et al. (1992) for dominant KLL DR satellite lines of the Fe xxv ion. With the objective to check the validity of our theoretical models, we compare our Dirac R-matrix and IRA results with the EBIT experiment and previous theories in Table 6. Each theoretical resonance strength is multiplied by its corresponding crystal response factor of the spectrometer (G(s/w)) (Beiersdorfer et al. 1992) to take into account the polarization effects. The theoretical values tabulated in Table 6 are the ratios of the theoretical to experimental values, R = G(s/w)S/S(EBIT), with S and S(EBIT) being the theoretical and experimental resonance strengths respectively. The uncertainty in the experimental values is 20%, and therefore the theoretical values of R which lie in the range 0.80–1.20 are within the experimental error limits (Beiersdorfer et al. 1992). As compared to the BPRM (Nahar & Pradhan 2006) and Relativistic Distorted Wave (RDW) (Pradhan & Zhang 1997) calculations, our Dirac R-matrix calculations for all satellite line are more accurate and within the 20% experimental uncertainty. There is one exception for the blended satellites (t, s) for which the present result has 26% error. This error may be attributed to the interference of the resonances with common final recombined state. Nevertheless, this result is still better than the BPRM and RDW (with 38% and 41% errors respectively) results. Moreover, our Dirac R-matrix R values are in very good agreement with the present and previous MCDF (Chen 1986) IRA calculations. As compared to our Dirac R-matrix results, all other models have more than two or three S values that lie outside the experimental error. It should be mentioned that all the R values of MCDF results (Chen 1986) are in the experimental error limits. However, except for the satellites (t,s) and o, our IRA results are consistent with the experimental results and are more accurate than the previous (Vainshtein & Safronova 1978; Dubau et al. 1982; Nilsen 1988) IRA results.
Table 6. Present Ratios of the S (10−20 cm2 eV) Values to the Experimental (Beiersdorfer et al. 1992) S (10−20 cm2 eV) Values for the 22 KLL DR Satellite Lines of Fe xxv ion Compared with Similar Ratios from Different Theoretical Models
| Key | S(EBIT) | R(DARC) | Ra | Rb | R(IRA) | Rc | Rd | Re | Rf |
|---|---|---|---|---|---|---|---|---|---|
| o | 0.48 | 1.18 | 1.25 | 1.22 | 1.23 | 1.20 | 1.29 | 1.16 | 1.34 |
| p | 0.50 | 1.10 | 1.20 | 1.15 | 1.16 | 1.16 | 1.26 | 1.10 | 1.25 |
| r | 3.42 | 0.89 | 0.76 | 0.77 | 0.87 | 0.62 | 0.72 | 0.89 | 0.73 |
| e | 3.63 | 1.07 | 1.24 | 1.02 | 1.11 | 1.23 | 1.10 | 1.06 | 1.11 |
| k + a | 21.23 | 0.98 | 0.91 | 0.91 | 0.89 | 0.98 | 0.93 | 0.86 | 0.87 |
| j + l | 24.06 | 1.09 | 1.06 | 1.05 | 1.05 | 1.15 | 1.06 | 1.03 | 1.05 |
| t + s | 3.65 | 1.26 | 1.38 | 1.41 | 1.24 | 1.22 | 1.33 | 1.17 | 0.14 |
| m | 1.52 | 1.18 | 1.23 | 1.01 | 0.92 | 1.31 | 1.14 | 1.10 | 1.08 |
Note. Theoretical S values are first multiplied with the crystal response factor of the spectrometer (G(s/w)) for each DR satellite line and then ratios are taken. S(EBIT): experimental resonance strengths for the DR satellite lines observed at EBIT (Beiersdorfer et al. 1992); R(DARC): ratio of the present Dirac R-matrix S value to the experimental S value; R(IRA): ratio of the present IRA S value to the experimental S value; Ra: ratio of the BPRM S (Nahar & Pradhan 2006) value to the experimental S value; Rb: ratio of the RDW S (Pradhan & Zhang 1997) value to the experimental S value; Rc: ratio of the IRA S value (Vainshtein & Safronova 1978) to the experimental S value; Rd: ratio of the IRA S value (Dubau et al. 1982) to the experimental S value; Re: ratio of the IRA S value Chen (1986) to the experimental S value; Rf: ratio of the IRA S value Nilsen (1988) to the experimental S value.
Download table as: ASCIITypeset image
In Table 7, the resonance strengths of KLL satellite lines of the Ni xxvii ion from two different approaches of the present study are compared with each other and with the available results of Nahar & Pradhan (2006) and Nahar et al. (2009). We note that for most of the strong and intermediate strengths (≥10−20 cm2 eV), the agreement between the IRA and Dirac R-matrix calculations is similar as that obtained for the Fe xxv ion. This indicates that for the strong lines of the highly charged ions, the calculations based on different theoretical models are consistent and provide almost similar resonance strengths. But we find that some of the BPRM (Nahar & Pradhan 2006; Nahar et al. 2009) resonance strengths have larger differences with the IRA results as compared to the Dirac R-matrix results, particularly for the satellites p, r, k, and l. Therefore, the Dirac R-matrix approach as adopted in the present study does reflect more accuracy than the BPRM approach of Nahar & Pradhan (2006) and Nahar et al. (2009). Furthermore, the situation is the same for the weak satellite lines, i.e., the agreement among the different calculations is worse. Finally, the resonance energies tabulated in Table 7, from two different theoretical models, are within an average difference of 2.67 eV owing to different theoretical models.
Table 7. Present Resonance Energies E (eV) and Strengths S (10−20 cm2 eV) from Dirac R-matrix and IRA Calculations for the 22 KLL DR Satellite Lines Ni xxiv ion Compared with Different Theoretical Models
| Key | Transitions | E(present) | Ea | S(DARC) | Sa | S(IRA) |
|---|---|---|---|---|---|---|
| o | 1s2s2 2S  1s22p 2P 1s22p 2P
|
5302.5 | 5296.0 | 0.87 | 0.99 | 0.86 |
| p | 1s2s2 2S  1s22p 2P 1s22p 2P
|
5302.5 | 5296.0 | 0.92 | 1.11 | 0.99 |
| v | 1s2s2p 4P  1s22s 2S 1s22s 2S
|
5314.3 | 5312.3 | 0.04 | 0.07 | 0.01 |
| u | 1s2s2p 4P  1s22s 2S 1s22s 2S
|
5320.7 | 5321.2 | 0.14 | 0.18 | 0.21 |
| r | 1s2s2p 2P  1s22s 2S 1s22s 2S
|
5360.1 | 5357.2 | 4.56 | 4.26 | 4.78 |
| q | 1s2s2p 2P  1s22s 2S 1s22s 2S
|
5374.3 | 5372.2 | 0.06 | 0.11 | 0.07 |
| i | 1s2p2 4P  1s22p 2P 1s22p 2P
|
5379.8 | 5379.4 | 0.02 | 0.28 | 0.03 |
| h | 1s2p2 4P  1s22p 2P 1s22p 2P
|
5379.8 | 5379.4 | 0.01 | 4.3(−3) | 8.15(−5) |
| t | 1s2s2p 2P  1s22s 2S 1s22s 2S
|
5388.8 | 5385.8 | 5.43 | 5.36 | 5.70 |
| f | 1s2p2 4P  1s22p 2P 1s22p 2P
|
5391.9 | 5394.3 | 0.32 | 0.03 | 0.18 |
| g | 1s2p2 4P  1s22p 2P 1s22p 2P
|
5391.9 | 5394.3 | 0.05 | 0.04 | 7.5(−4) |
| s | 1s2s2p 2P  1s22s 2S 1s22s 2S
|
5393.0 | 5394.3 | 0.28 | 0.13 | 0.05 |
| e | 1s2p2 4P  1s22p 2P 1s22p 2P
|
5401.2 | 5402.1 | 5.82 | 5.40 | 5.83 |
| k | 1s2p2 2D  1s22p 2P 1s22p 2P
|
5419.7 | 5414.4 | 17.50 | 6.38 | 15.3 |
| l | 1s2p2 2D  1s22p 2P 1s22p 2P
|
5419.7 | 5414.4 | 3.64 | 6.10 | 2.55 |
| d | 1s2p2 2P  1s22p 2P 1s22p 2P
|
5420.9 | 5424.1 | 0.57 | 1.16 | 0.08 |
| c | 1s2p2 2P  1s22p 2P 1s22p 2P
|
5420.9 | 5424.1 | 0.06 | 1.15 | 0.02 |
| j | 1s2p2 2D  1s22p 2P 1s22p 2P
|
5430.9 | 5427.6 | 25.05 | 25.04 | 23.20 |
| b | 1s2p2 2P  1s22p 2P 1s22p 2P
|
5446.1 | 5447.7 | 0.88 | 0.23 | 0.05 |
| a | 1s2p2 2P  1s22p 2P 1s22p 2P
|
5446.1 | 5447.7 | 6.42 | 5.99 | 6.54 |
| m | 1s2p2 2S  1s22p 2P 1s22p 2P
|
5466.1 | 5468.1 | 2.44 | 2.33 | 2.00 |
| n | 1s2p2 2S  1s22p 2P 1s22p 2P
|
5466.1 | 5468.1 | 0.37 | 0.66 | 0.06 |
Note. E(present): theoretical energies from Dirac R-matrix calculations; Ea: theoretical energies from BPRM calculations of Nahar & Pradhan (2006) and Nahar et al. (2009); S(DARC): present resonance strengths from Dirac R-matrix calculations; S(IRA): present IRA-based MCDF calculations for the resonance strengths; Sa: MCBP calculations of Nahar & Pradhan (2006) and Nahar et al. (2009).
Download table as: ASCIITypeset image
4. Conclusion
In summary, the Dirac R-matrix method based on the Davies and Seaton's theory of RD is applied for the PR cross sections of ground states of the Fe xxv and Ni xxvii ions. The resonances appear to be damped by similar amounts, as indicated by the radiation branching ratios from the present IRA calculations. The resonance strengths for the KLL DR satellite lines are acquired from the damped PR cross sections. Overall, the resonance strengths from this approach turned out to be in good agreement with those obtained from a vastly different IRA-based method of the present and previous theories. The related wavelengths, radiative and autoionization rates are consistent with the previous theories and experiments. Also, in comparison with the measurements of the dominant DR satellite lines at EBIT (Beiersdorfer et al. 1992), the present Dirac R-matrix approach is potentially more accurate than the radiatively damped BPRM approach of Nahar & Pradhan (2006) and Nahar et al. (2009). However, for very weak satellite lines, the measurements of the Kα complex with more better experimental conditions are required to assess the level of accuracy of all theoretical models. Nevertheless, after the detailed analysis of each resonance, we find that the present results for the satellite lines from the Dirac R-matrix are appeared to be better than those from the previous R-matrix and many IRA calculations. Moreover, the present results is reliable to be used in the plasma diagnostics and provide an accuracy check for the future experiments.
This work is supported by the National Key Research and Development Program of China (grant No. 2017YFA0402300) and National Natural Science Foundation of China (grant Nos. U1732133 and 11320101003).