


Abstract
Ultra-diffuse galaxies (UDGs) are unusual galaxies with low luminosities, similar to classical dwarf galaxies, but with sizes up to ∼5 larger than expected for their mass. Some UDGs have large populations of globular clusters (GCs), something unexpected in galaxies with such low stellar density and mass. We have carried out a comprehensive study of GCs in both UDGs and classical dwarf galaxies at comparable stellar masses using Hubble Space Telescope (HST) observations of the Coma cluster. We present new imaging for 33 Dragonfly UDGs with the largest effective radii (>2 kpc), and additionally include 15 UDGs and 54 classical dwarf galaxies from the HST/ACS Coma Treasury Survey and the literature. Out of a total of 48 UDGs, 27 have statistically significant GC systems, and 11 have candidate nuclear star clusters. The GC specific frequency (SN) varies dramatically, with the mean SN being higher for UDGs than for classical dwarfs. At constant stellar mass, galaxies with larger sizes (or lower surface brightnesses) have higher SN, with the trend being stronger at higher stellar mass. At lower stellar masses, UDGs tend to have higher SN when closer to the center of the cluster, i.e., in denser environments. The fraction of UDGs with a nuclear star cluster also depends on environment, varying from ∼40% in the cluster core, where it is slightly lower than the nucleation fraction of classical dwarfs, to ≲20% in the outskirts. Collectively, we observe an unmistakable diversity in the abundance of GCs, and this may point to multiple formation routes.
Export citation and abstract BibTeX RIS
1. Introduction
Following the discovery of a population of faint, yet surprisingly large galaxies in the Coma cluster (van Dokkum et al. 2015), ultra-diffuse galaxies (UDGs, defined as galaxies with μ(g, 0) ≳ 24.0 and Re,gal ≥ 1.5 kpc) have been discovered in numerous environments. Although such galaxies have been known since the 1980s (Binggeli et al. 1985; Impey et al. 1988), and a substantial number of similar types of galaxies have been previously identified (Conselice et al. 2003), the survey of van Dokkum et al. (2015) has prompted an explosion of interest in these large, diffuse galaxies. UDGs have been found in the other clusters (Mihos et al. 2015, 2017; Muñoz et al. 2015; van der Burg et al. 2016; Janssens et al. 2017; Lee et al. 2017), as well as in low-density environments (Martínez-Delgado et al. 2016; Merritt et al. 2016; Román & Trujillo 2017; Trujillo et al. 2017). These galaxies have luminosities and morphologies similar to early-type dwarf galaxies, but larger sizes—similar, in fact, to L* galaxies (1.5 < Re,gal <4.5 kpc), making them outliers in the galaxy size-magnitude scaling relations.
It remains unclear how UDGs formed and evolved. The very existence of UDGs in dense environments (van der Burg et al. 2016) suggests that at least some UDGs must be dominated by dark matter, and that environment may even play an important role in their evolution. UDGs may be "failed" galaxies, meaning that they were extremely inefficient at forming stars, and are thus severely under-luminous for their halo mass. On the other hand, some suggest that UDGs are "genuine" dwarf galaxies with correspondingly modest halo masses, but with anomalously large sizes. They could be the high-spin tails of the halo angular momentum distribution (Amorisco & Loeb 2016) or the result of feedback-driven gas outflows that can lead to the expansion of both the dark matter and the stars (Di Cintio et al. 2017).
Globular clusters (GCs) are excellent probes of the stellar populations in these diffuse galaxies. GCs allow us to trace an early epoch of galaxy building, when intense star formation was needed to form massive star clusters. Observationally, GCs are useful tracers of old stellar populations because they can be seen out to cosmological distances. Because the number of GCs in a galaxy correlates linearly with the total host halo mass (e.g., Blakeslee et al. 1997; Peng et al. 2008; Harris et al. 2017), they provide a means of estimating the total mass of a galaxy based solely on photometric measures. While the sparse nature of UDGs points to inefficient star formation, GCs have, perhaps surprisingly, been identified in a number of UDGs.
Previous studies of GCs in UDGs have provided an important clue to their formation. Mihos et al. (2015) found a large GC population in VLSB-B, a UDG in the Virgo cluster. Its GC specific frequency (SN)8 is considerably larger than those typical of dwarf galaxies with similar luminosity. Large GC populations have subsequently been reported for Virgo and Coma UDGs (Beasley et al. 2016; Peng & Lim 2016; van Dokkum et al. 2016), and in the field (van Dokkum et al. 2018a). These GCs may be metal-poor based on their broadband colors (Peng et al. 2006; Beasley & Trujillo 2016). In addition, kinematic measurements of GCs indicate that at least some UDGs are dark-matter-dominated systems (Beasley et al. 2016; van Dokkum et al. 2016; Toloba et al. 2018), while others may have very little dark matter (van Dokkum et al. 2018b). Taken together, these results show that UDGs are different from galaxies with similar luminosities.
Nevertheless, UDGs may merely be large dwarf galaxies. There are several UDGs with highly elongated shapes, suggestive of tidal disruption (Merritt et al. 2016; Mihos et al. 2017). Equally important, a number of UDGs have no significant GC populations (Mihos et al. 2015).
van Dokkum et al. (2017) and Amorisco et al. (2018) have amassed fairly large UDG samples in the Coma cluster that are suitable for the study of GCs (15 and 18 UDGs, respectively), but these samples are nearly all in the cluster central regions (except for three UDGs from van Dokkum et al. 2017). Moreover, no previous GC study in UDGs has included a careful comparison with classical dwarf galaxies9 in the same environments, despite the fact that environment is known to affect GC specific frequency (Peng et al. 2008). Thus, we need a comprehensive GC study of UDGs and classical dwarf galaxies located in the same environments. In this paper, we use the Hubble Space Telescope (HST) to analyze the GC systems for 33 Dragonfly UDGs that inhabit a range of environments within the Coma cluster. We also include 12 UDGs in the archival data of the Coma Treasury Survey (Carter et al. 2008; Yagi et al. 2016), as well as other measurements from the literature. For the comparison sample, we focus on classical dwarf galaxies selected from the Coma Treasury survey (den Brok et al. 2014). In what follows, we adopt a distance to the Coma cluster of 100 Mpc (m − M = 35; Carter et al. 2008), which we apply to all galaxies except for DF3, which is located behind the Coma cluster (142 Mpc, Kadowaki et al. 2017).
2. Observations and Data Analysis
2.1. HST Imaging Program
In a 26-orbit HST program (GO-14658), we imaged 33 large (Re,gal ≥ 2.0 kpc) Coma cluster UDGs from the catalog of van Dokkum et al. (2015). Each galaxy was observed for one orbit in the F606W ("wide V") filter, with ACS/WFC serving as the primary instrument, and WFC3/UVIS used in parallel mode. Accumulated exposure times were 2358 and 2445 s for ACS/WFC and WFC3/UVIS, respectively. The observations were taken between 2017 January and July. CTE corrections and drizzling were performed with the standard STScI pipeline. Figure 1 shows a montage of thumbnail images for our 33 program galaxies.

Figure 1. Thumbnail images for our HST program sample. Each F606W image measures 50'' × 50'' and has been Gaussian smoothed with 5 pixel FWHM to show the UDG more clearly. North is up and east is to the left.
Download figure:
Standard image High-resolution imageSource catalogs were generated using the SExtractor package (Bertin & Arnouts 1996). Photometric magnitudes were obtained from aperture magnitudes measured within a 6 pixel (0 3 for ACS, 024 for WFC3) diameter aperture. To correct for flux missed due to the finite aperture size, we computed aperture correction values out to a 10 pixel diameter (05 for ACS, 04 for WFC3) using bright stars in the field, and then applied the aperture correction to infinity using values from the literature (Bohlin 2011; UVIS webpage10
). We adopted photometric zeropoints for AB magnitudes in F606W for ACS/WFC and WFC3/UVIS from the appropriate STScI websites.
3 for ACS, 024 for WFC3) diameter aperture. To correct for flux missed due to the finite aperture size, we computed aperture correction values out to a 10 pixel diameter (05 for ACS, 04 for WFC3) using bright stars in the field, and then applied the aperture correction to infinity using values from the literature (Bohlin 2011; UVIS webpage10
). We adopted photometric zeropoints for AB magnitudes in F606W for ACS/WFC and WFC3/UVIS from the appropriate STScI websites.
GCs in these galaxies appear as point sources, because GCs at the distance of the Coma cluster are unresolved, even with HST resolution; we therefore identified point sources as candidate GCs. Similar to Peng et al. (2011) and Peng & Lim (2016), we adopted an "inverse concentration" index (C4–7), which is the difference in magnitude between a 4 pixel aperture (02 for ACS, 016 for WFC3) and a 7 pixel aperture (035 for ACS, 028 for WFC3) for the point source selection. This parameter is normalized, so point sources will have C4–7 = 0. Most detected sources are brighter than V606 ≈ 27.5 mag, so we identified sources with V606 ≤ 27.5 mag and C4–7 < 0.3 as point sources.
We carried out artificial star tests to quantify the detection efficiency in our images. An empirical point spread function (PSF) was constructed using DAOPHOT II (Stetson 1987) using bright stars. These empirical PSFs were added to the images as artificial stars; we then ran the same detection and selection procedures as were used to generate the GC catalogs. The 90% completeness levels were found to be V606 = 27.50 mag and V606 = 27.55 mag for ACS and WFC3, respectively.
2.2. UDGs in the Coma Cluster Treasury Survey
The Coma Cluster Treasury Survey (Carter et al. 2008) is a program that images the core of the Coma cluster in with HST in two filters, g475 and I814. The depth of the imaging is adequate to detect GCs at Coma distance down to the mean of the GC luminosity function (Peng et al. 2011). These images contain 54 of the UDG candidates selected by Yagi et al. (2016) from ground-based imaging. This list, however, includes galaxies with Re as small as 0.7 kpc, which is well within the range expected for normal dwarf galaxies.
van Dokkum et al. (2017) used the Coma Treasury Survey data, combining g475- and I814-band images to generate deeper pseudo-V-band images, and measured the sizes of these 54 galaxies using GALFIT (Peng et al. 2002), finding that 12 of them have Reff ≥ 1.5 kpc. They then identified GC candidates associated with these 12 UDGs. Amorisco et al. (2018) also studied GCs of UDGs in Coma Treasury Survey data. They provide estimates of the numbers of GCs in 54 UDG candidates from Yagi et al. (2016), 18 of which have Reff ≥ 1.5 kpc based on the size measurement of Yagi et al. (2016). Although these previous studies provide total GC numbers for UDGs in the Coma Treasury Survey data, we have re-measured them to ensure a consistent methodology across all galaxies. We chose to include the 11 of the 12 UDGs from van Dokkum et al. (2017) in our analysis, excluding Y419 because it looks like superposition of two small galaxies (something mentioned in van Dokkum et al. 2017). We also combined g475- and I814-band images to estimate the total number of GCs in these UDGs. Our measured GC numbers are similar, within the uncertainties, to those from van Dokkum et al. (2017) and Amorisco et al. (2018) (Figure 2).

Figure 2. GC numbers measured in this study compared with those measured for the same UDGs in two other published studies. The X-axis shows number of GCs in UDGs from this study, and Y-axis indicates number of GCs presented in the literature. Crosses and squares represent comparisons with van Dokkum et al. (2017) and Amorisco et al. (2018), respectively. Squares are shifted a little to avoid overlapping error bars.
Download figure:
Standard image High-resolution imageIn total, we have 45 UDGs with our consistent GC analysis after combining our new HST observations (33), UDGs from the Coma Treasury Survey (11), and DF17 from our previous work (Peng & Lim 2016). In what follows, we also included three UDGs (DF42, DF44, and DFX1) from van Dokkum et al. (2017) in our analysis, giving us a full sample of 48 UDGs.
2.3. A Comparison Sample of Classical Dwarf Galaxies
To understand the properties and origins of these UDGs, a clean comparison with classical dwarf galaxies is important. There are numerous studies of GCs in classical dwarf galaxies, but no large samples for the Coma cluster. We therefore performed the same GC analysis for classical dwarf galaxies in the Coma Treasury Survey using the catalog of den Brok et al. (2014).
den Brok et al. (2014) studied galaxy photometric parameters, including magnitudes and effective radii, using the Coma Treasury Survey data. Their study contains about 200 galaxies within the magnitude range of −18 ≲ MV ≲ −12. We used 88 of these galaxies in our GC analysis, after excluding galaxies located in the halos of bright galaxies or close to the edges of the HST fields. Of these 88 galaxies, 54 have magnitudes in the range spanned by the UDGs, and we use these to provide a matched comparison sample for the UDGs.
2.4. GC Numbers and Specific Frequencies
Measuring the total number of GCs in a galaxy requires us to make an estimate (or assumption) about the spatial extent and luminosity function of the GCs. In Peng & Lim (2016), we estimated the spatial extent of GCs in DF17 directly from the data. Unfortunately, it is difficult to measure GC system spatial extent in these UDGs due to the comparatively shallower imaging. Although Forbes (2017) fit a relation between Re,GCS and host galaxy stellar mass for massive early-type galaxies, he also noted that UDGs do not follow the relation. van Dokkum et al. (2017) adopted a relation between the effective radii of the galaxy and GC system, concluding that Re,GCS ∼ 1.5 Re,gal is a reasonable approximation for UDGs where both quantities are measured. We have tested this assumption using GC and galaxy data from the ACS Virgo Cluster Survey (ACSVCS; Côté et al. 2004; Ferrarese et al. 2006; Jordán et al. 2009), and find it to be an adequate description for low-mass galaxies, so we have used the same assumption to derive total GC numbers in our analysis.
The magnitude limit of our data is similar to the peak magnitude of the GC luminosity function (GCLF) at the distance of the Coma cluster, so it is difficult to constrain the shape or mean of the GCLF. Therefore, we have assumed that the shape of GC luminosity function in UDGs is the same as that in classical dwarf galaxies (i.e., roughly Gaussian; Jordán et al. 2007; Miller & Lotz 2007). In DF17, where we could measure the GCLF past the turnover, we found that this was a reasonable assumption (Peng & Lim 2016).
We measure the number of GC candidates with g <27.5 mag within 1.5 Re,gal. This number will be contaminated by compact background sources and intra-cluster GCs. We estimate the level of this contamination using a local background in an annulus outside 5 Re,gal. After background subtraction and completeness corrections down to the GCLF peak, we obtain the total number of GCs within the aperture by multiplying by two, which is the traditional way to account for the unseen faint end of the GCLF in extragalactic systems (Harris & van den Bergh 1981). We then multiple by two again to account for the GCs that are outside our chosen aperture of 1.5 Re,gal.
To check the reliability of the latter assumptions, we also estimated the total number of GCs by measuring the number of GCs within 4 Re,gal. Based on the assumption that Re,GCS ∼1.5 Re,gal, the fraction of GCs within 4 Re,gal is about 94%. Thus, we calculated the total number of GCs based on this measurement, comparing the results to those obtained from GC counts within 1.5 Re,gal and 4 Re,gal. The two estimates are in good agreement with low scatter, so we conclude that the assumption Re,GCS ∼ 1.5 Re,gal is reliable for UDGs.
For classical dwarf galaxies, we used the same assumption for the GC distribution, but estimated the total number of GCs within 4 Re,gal. Because the effective radii of classical dwarf galaxies are generally small, this smaller size allow us to use a larger aperture (relative to Re,gal) without incurring a large penalty from the background. After applying corrections for completeness and sampling of the GC luminosity function, we obtain the total number of GCs by multiplying by a factor of 1.06 to correct GC fraction within 4 Re,gal to total number.
In all galaxies, we estimated the amplitude of fluctuations in background counts. To estimate this fluctuation, we randomly chose locations on the HST images excluding regions with UDGs and Coma galaxies (Sohn et al. 2017), and measured the number of GC candidates using same size aperture as for the background annulus of the target UDG. We repeated this procedure for more than 100 locations and used the standard deviation of these values as the background fluctuation amplitude. The final uncertainties in the total GC numbers are a combination of Poisson errors and the estimated background fluctuations.
Finally, we note that we find eleven UDGs that may contain central nuclei (Figure 3) i.e., UDGs with bright point-like sources at their photocenters. The candidate nuclei in DF7 and DF12 are not selected as GCs, but those in the remaining galaxies were identified as GCs by our automated selection. In all cases, we excluded these nuclei when calculating the number of GCs. The GC system properties of the Coma UDGs and classical dwarf galaxies are summarized in Tables 1 and 2, respectively.

Figure 3. Thumbnail images for 11 nucleated UDGs. To highlight subtle morphological details, we show 30'' × 30'' regions centered on each UDG. Images have been smoothed with a Gaussian kernel of FWHM = 7 pixels to emphasize faint structures. UDG names are given at the upper left corner of each panel. North is up and east is to the left.
Download figure:
Standard image High-resolution imageTable 1. The Globular Cluster System Properties of Coma Ultra-diffuse Galaxies
| Name | NGC | SN | MV | Re,gal |

|
RComa |
|---|---|---|---|---|---|---|
| (mag) | (kpc) | (mag/arcsec2) | (deg) | |||
| DF1 | 18.6 ± 13.9 | 22.3 ± 16.7 | −14.8 | 3.1 | 26.2 | 1.164 |
| DF2 | 0.0 ± 7.8 | 0.0 ± 12.4 | −14.5 | 2.1 | 25.7 | 1.052 |
| DF3a | 3.7 ± 65.2 | 3.1 ± 53.2 | −15.2 | 4.2 | 26.5 | ⋯ |
| DF4 | −18.0 ± 36.8 | −28.5 ± 58.3 | −14.5 | 3.9 | 27.0 | 0.901 |
| DF6 | 31.4 ± 22.6 | 49.8 ± 35.8 | −14.5 | 4.4 | 27.3 | 0.838 |
| DF7b | 39.1 ± 23.8 | 12.9 ± 7.9 | −16.2 | 4.3 | 25.6 | 0.711 |
| DF8 | 42.6 ± 23.9 | 38.9 ± 21.8 | −15.1 | 4.4 | 26.7 | 0.591 |
| DF9 | 14.1 ± 13.7 | 29.5 ± 28.5 | −14.2 | 2.8 | 26.6 | 0.800 |
| DF10 | 1.9 ± 10.9 | 2.1 ± 12.0 | −14.9 | 2.4 | 25.6 | 0.346 |
| DF11 | 9.4 ± 12.7 | 9.4 ± 12.7 | −15.0 | 2.1 | 25.2 | 0.681 |
| DF12b | 23.5 ± 17.4 | 44.7 ± 33.1 | −14.3 | 2.6 | 26.4 | 0.219 |
| DF13 | 11.3 ± 10.5 | 31.0 ± 29.0 | −13.9 | 2.2 | 26.4 | 0.542 |
| DF14b | 54.6 ± 24.2 | 78.9 ± 35.0 | −14.6 | 3.8 | 26.9 | 0.327 |
| DF15 | 15.2 ± 22.6 | 13.8 ± 20.6 | −15.1 | 4.0 | 26.5 | 0.300 |
| DF18 | 10.6 ± 19.1 | 38.6 ± 69.4 | −13.6 | 2.8 | 27.2 | 0.162 |
| DF19 | 28.8 ± 23.4 | 37.9 ± 30.8 | −14.7 | 4.4 | 27.1 | 1.005 |
| DF20 | −0.1 ± 9.9 | −0.7 ± 51.9 | −13.2 | 2.3 | 27.2 | 0.224 |
| DF22 | 15.0 ± 11.3 | 37.7 ± 28.5 | −14.0 | 2.1 | 26.2 | 0.763 |
| DF23b | 38.5 ± 19.2 | 61.0 ± 30.4 | −14.5 | 2.3 | 25.9 | 0.174 |
| DF25 | 10.7 ± 24.3 | 14.1 ± 32.0 | −14.7 | 4.4 | 27.1 | 0.188 |
| DF26 | 20.0 ± 20.7 | 11.5 ± 11.9 | −15.6 | 3.3 | 25.6 | 0.239 |
| DF29 | 45.1 ± 21.5 | 54.2 ± 25.8 | −14.8 | 3.1 | 26.2 | 0.404 |
| DF30 | 28.2 ± 18.4 | 19.5 ± 12.8 | −15.4 | 3.2 | 25.7 | 1.429 |
| DF31b | 27.2 ± 17.0 | 51.9 ± 32.3 | −14.3 | 2.5 | 26.3 | 1.048 |
| DF32 | 5.1 ± 13.1 | 8.8 ± 22.8 | −14.4 | 2.8 | 26.4 | 0.770 |
| DF34 | −2.7 ± 12.4 | −8.3 ± 37.4 | −13.8 | 3.4 | 27.4 | 0.854 |
| DF35 | 6.6 ± 14.4 | 15.1 ± 33.1 | −14.1 | 2.7 | 26.6 | 0.512 |
| DF36b | 25.4 ± 15.7 | 40.2 ± 24.9 | −14.5 | 2.6 | 26.2 | 0.954 |
| DF39 | 11.2 ± 17.6 | 12.3 ± 19.3 | −14.9 | 4.0 | 26.7 | 0.713 |
| DF40 | −7.1 ± 10.3 | −8.5 ± 12.4 | −14.8 | 2.9 | 26.1 | 0.844 |
| DF41 | −1.9 ± 14.3 | −2.1 ± 15.7 | −14.9 | 3.4 | 26.3 | 0.998 |
| DF46 | 0.0 ± 15.7 | 0.0 ± 22.7 | −14.6 | 3.4 | 26.6 | 1.206 |
| DF47 | 2.4 ± 16.9 | 2.9 ± 20.3 | −14.8 | 4.2 | 26.9 | 1.630 |
| Y112b | 2.1 ± 5.6 | 4.5 ± 17.6 | −14.2 | 1.8 | 25.7 | 0.259 |
| Y121 | 22.4 ± 4.1 | 56.3 ± 30.9 | −14.0 | 1.5 | 25.5 | 0.295 |
| Y122 | −12.8 ± 8.1 | −38.7 ± 36.9 | −13.8 | 2.4 | 26.7 | 0.301 |
| Y358b | 28.0 ± 5.3 | 33.7 ± 19.1 | −14.8 | 2.3 | 25.6 | 0.111 |
| Y367b | 22.4 ± 5.2 | 74.2 ± 44.2 | −13.7 | 1.7 | 26.0 | 0.093 |
| Y370 | 17.0 ± 6.4 | 46.8 ± 38.6 | −13.9 | 2.1 | 26.3 | 0.068 |
| Y386 | 6.8 ± 11.4 | 9.0 ± 24.9 | −14.7 | 2.6 | 26.0 | 0.056 |
| Y424c | 16.7 ± 5.7 | 348.3 ± 262.6 | −11.7 | 1.7 | 28.0 | 0.163 |
| Y425 | 10.4 ± 6.8 | 49.7 ± 61.3 | −13.3 | 1.8 | 26.6 | 0.152 |
| Y436b | 42.4 ± 7.3 | 168.8 ± 67.0 | −13.5 | 1.7 | 26.2 | 0.199 |
| Y534b | 23.2 ± 5.0 | 63.9 ± 36.1 | −13.9 | 1.9 | 26.1 | 0.713 |
Notes.
aThe background UDG at 142 Mpc. bCandidate nucleated UDG. cUDG excluded from our analysis due its much lower luminosity compared with other UDGs.Download table as: ASCIITypeset image
Table 2. The Globular Cluster System Properties of Coma Dwarf Galaxiesa
| Name | NGC | SN |
 b
b
|
Re,gal |

|
|---|---|---|---|---|---|
| (mag) | (kpc) | (mag/arcsec2) | |||
| COMAi13052.942p28435.86 | −2.1 ± 7.3 | −11.2 ± 34.5 | −13.2 | 1.6 | 24.8 |
| COMAi13045.913p28335.50 | 7.8 ± 5.9 | 44.6 ± 31.0 | −13.1 | 1.6 | 25.0 |
| SDSSJ130032.61–280331.4 | 42.3 ± 13.6 | 11.7 ± 4.3 | −16.4 | 4.0 | 23.6 |
| SDSSJ130027.57–280323.9 | −1.8 ± 8.8 | −0.7 ± 4.5 | −16.1 | 4.2 | 24.0 |
| SDSSJ130026.88–280450.7 | −8.5 ± 8.0 | −14.8 ± 16.4 | −14.4 | 2.5 | 24.6 |
| SDSSJ130037.05–280544.7 | −6.4 ± 11.6 | −14.7 ± 32.9 | −14.1 | 4.2 | 26.0 |
| SDSSJ130020.39–280413.9 | −8.6 ± 9.1 | −4.5 ± 3.3 | −15.7 | 1.9 | 22.7 |
| SDSSJ130020.39–280413.9c | 5.8 ± 10.4 | 5.3 ± 7.2 | −15.1 | 2.9 | 24.2 |
| SDSSJ130019.08–280508.9 | −2.1 ± 8.6 | −3.7 ± 6.8 | −14.4 | 1.9 | 24.0 |
| SDSSJ130021.38–280327.3 | −3.0 ± 12.4 | −6.8 ± 22.8 | −14.1 | 2.9 | 25.2 |
| SDSSJ130020.27–280453.2 | 2.1 ± 9.7 | 4.5 ± 7.4 | −14.2 | 1.7 | 24.0 |
| SDSSJ130022.01–280220.9 | 4.3 ± 149.7 | 9.8 ± 17.7 | −14.1 | 1.8 | 24.2 |
| SDSSJ130031.97–280125.1 | −2.1 ± 148.9 | −7.7 ± 31.7 | −13.6 | 2.2 | 25.1 |
| SDSSJ130030.05–280134.8 | 4.3 ± 6.1 | 14.1 ± 17.3 | −13.7 | 1.5 | 24.2 |
| SDSSJ130005.76–280212.1 | −0.7 ± 6.3 | −0.9 ± 8.3 | −14.8 | 1.7 | 23.4 |
| SDSSJ130015.68–280146.3 | 10.7 ± 8.9 | 22.3 ± 20.4 | −14.2 | 2.5 | 24.8 |
| COMAi125937.975p28054.48 | −2.2 ± 7.6 | −12.4 ± 48.5 | −13.1 | 2.0 | 25.5 |
| COMAi125925.477p28211.03 | −5.6 ± 7.1 | −15.5 ± 20.0 | −13.9 | 1.9 | 24.5 |
| SDSSJ125905.94–280228.8 | 14.9 ± 15.2 | 6.5 ± 6.0 | −15.9 | 3.6 | 23.9 |
| SDSSJ130034.32–275817.6 | 2.1 ± 7.6 | 4.5 ± 15.5 | −14.2 | 1.7 | 23.9 |
| SDSSJ130039.32–275748.4 | 5.4 ± 8.3 | 11.3 ± 18.4 | −14.2 | 2.1 | 24.5 |
| COMAi13043.723p275920.89 | −10.7 ± 6.3 | −42.4 ± 24.3 | −13.5 | 1.7 | 24.7 |
| SDSSJ130022.65–275754.9c | 3.2 ± 11.1 | 0.9 ± 4.4 | −16.4 | 2.8 | 22.9 |
| COMAi13026.767p275953.57 | 4.1 ± 6.3 | 9.4 ± 14.6 | −14.1 | 1.6 | 23.9 |
| COMAi13029.716p275806.72 | 2.1 ± 5.7 | 9.3 ± 25.2 | −13.4 | 1.4 | 24.3 |
| COMAi13023.227p275948.84 | 8.5 ± 9.3 | 34.0 ± 43.0 | −13.5 | 2.0 | 25.0 |
| SDSSJ125955.93–275748.6 | 10.7 ± 14.9 | 7.4 ± 10.2 | −15.4 | 2.2 | 23.3 |
| SDSSJ125952.18–275946.3 | 2.1 ± 11.1 | 5.4 ± 25.0 | −14.0 | 1.7 | 24.2 |
| COMAi125956.527p275909.33 | 10.7 ± 11.5 | 38.7 ± 42.7 | −13.6 | 1.9 | 24.8 |
| SDSSJ125934.39–275942.9 | 6.4 ± 11.1 | 8.4 ± 31.8 | −14.7 | 2.1 | 23.9 |
| SDSSJ130032.96–275406.6 | 29.9 ± 14.9 | 10.9 ± 6.3 | −16.1 | 5.8 | 24.7 |
| COMAi13033.689p275524.77 | 4.3 ± 6.1 | 22.4 ± 27.5 | −13.2 | 1.7 | 25.0 |
| SDSSJ130022.90–275515.1 | −4.3 ± 6.9 | −3.9 ± 5.3 | −15.1 | 2.4 | 23.8 |
| SDSSJ130016.68–275638.9 | 0.0 ± 15.3 | 0.0 ± 8.6 | −15.7 | 4.3 | 24.5 |
| COMAi13025.049p275637.93 | 8.6 ± 7.8 | 13.6 ± 9.2 | −14.5 | 1.5 | 23.5 |
| SDSSJ130016.37–275522.2 | 14.9 ± 7.5 | 14.9 ± 8.1 | −15.0 | 2.3 | 23.9 |
| COMAi13018.409p275530.52 | 4.3 ± 6.9 | 26.9 ± 31.8 | −13.0 | 1.6 | 25.0 |
| COMAi13021.712p275650.16 | 12.8 ± 5.7 | 67.0 ± 31.3 | −13.2 | 1.7 | 25.0 |
| SDSSJ130011.41–275436.4 | 2.0 ± 4.9 | 0.6 ± 2.2 | −16.3 | 2.8 | 23.0 |
| SDSSJ130005.34–275628.9 | 5.3 ± 10.8 | 2.3 ± 2.9 | −15.9 | 1.7 | 22.3 |
| SDSSJ125958.22–275410.8 | 14.7 ± 10.0 | 7.7 ± 5.1 | −15.7 | 3.0 | 23.7 |
| SDSSJ130010.38–275617.0 | 0.0 ± 10.0 | 0.0 ± 3.0 | −14.3 | 0.8 | 22.1 |
| SDSSJ130007.04–275416.8 | 2.1 ± 5.1 | 5.4 ± 13.6 | −14.0 | 1.8 | 24.3 |
| COMAi125944.825p275536.87 | 8.5 ± 18.1 | 14.8 ± 33.0 | −14.4 | 3.8 | 25.5 |
| COMAi125956.755p275615.80 | 6.4 ± 10.2 | 16.1 ± 25.5 | −14.0 | 2.2 | 24.7 |
| SDSSJ125927.22–275257.0 | 4.3 ± 7.5 | 4.3 ± 7.6 | −15.0 | 2.1 | 23.6 |
| COMAi125828.358p271315.01 | 10.7 ± 7.6 | 4.2 ± 2.6 | −16.0 | 3.4 | 23.7 |
| SDSSJ125636.63–271503.6 | 0.0 ± 10.7 | 0.0 ± 10.6 | −15.1 | 2.8 | 24.2 |
| SDSSJ125844.37–274740.9 | −6.4 ± 18.8 | −2.3 ± 2.4 | −16.1 | 2.7 | 23.1 |
| SDSSJ125856.95–274719.9 | 2.9 ± 13.2 | 4.2 ± 13.5 | −14.6 | 2.1 | 24.0 |
| SDSSJ125843.28–274721.1 | 0.0 ± 10.2 | 0.0 ± 15.0 | −13.8 | 1.5 | 24.2 |
| COMAi125713.240p272437.24 | 4.6 ± 9.9 | 1.5 ± 2.1 | −16.2 | 2.1 | 22.5 |
| SDSSJ125712.27–272313.0 | 23.5 ± 11.6 | 10.2 ± 5.0 | −15.9 | 3.9 | 24.1 |
| SDSSJ125711.01–273142.2 | −4.3 ± 7.6 | −1.7 ± 2.3 | −16.0 | 2.4 | 22.9 |
Notes.
aCoordinates of objects are presented in the Table A1 of den Brok et al. (2014). bV-band magnitudes are converted from their I-band magnitude with an assumption of dwarf galaxy's color with V − I = 0.4 mag. cThere are duplicated objects with same name. This is the second among them.Download table as: ASCIITypeset image
3. Results
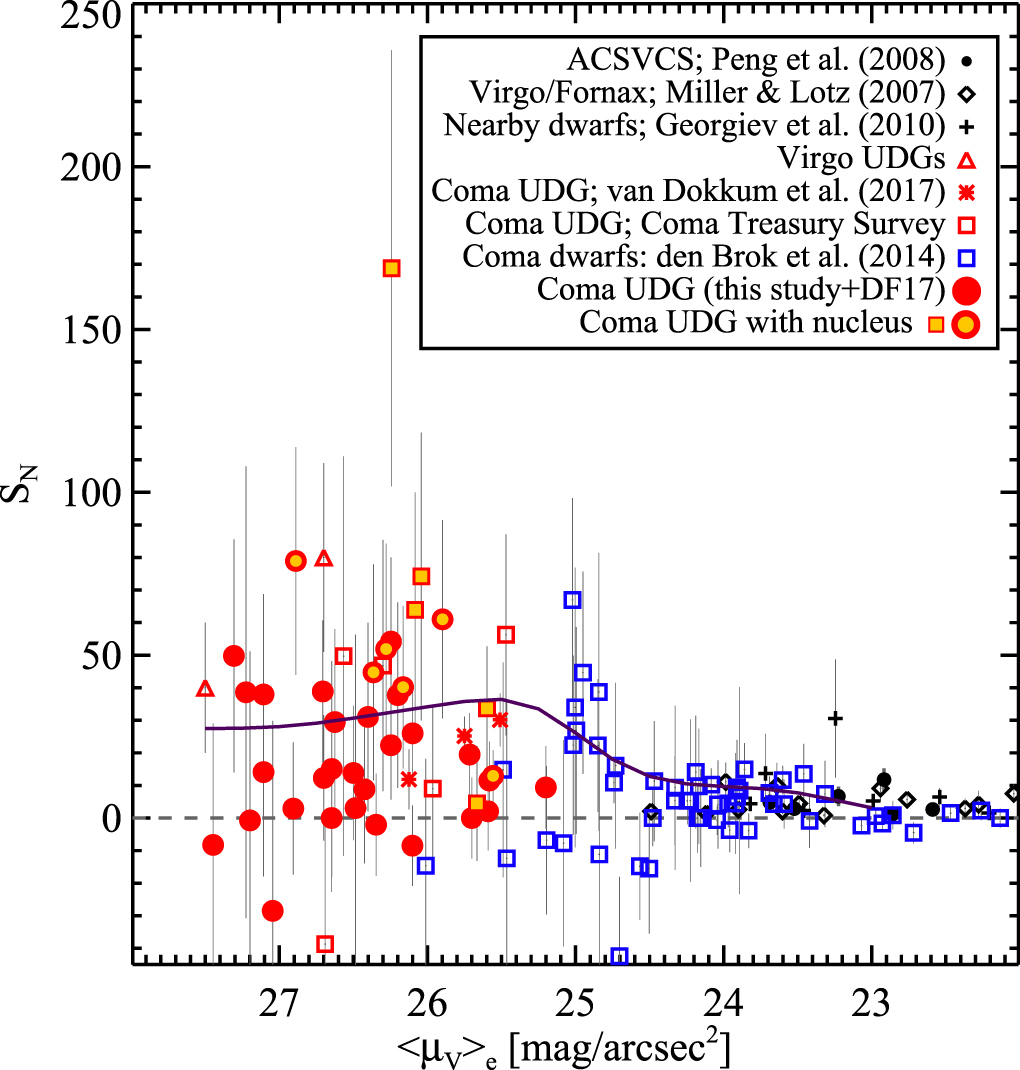
Figure 4 compares SN for UDGs and classical dwarf galaxies, plotting their specific frequencies against absolute V-band magnitudes. On average, the UDGs have higher SN values than the classical dwarfs. At a given luminosity or stellar mass, the mean SN values of UDGs are more than 1σ above the mean SN values of classical dwarf galaxies. The upper range of SN values for UDGs are from ∼30 to ∼100, for −16 < MV <−13 mag. These values are extremely high compared to any other type of galaxy, suggesting that UDGs have some of the largest GC fractions among known galaxies. At the same time, several UDGs have SN values similar to those of classical dwarfs, and some others are consistent with having no GCs at all. UDGs clearly exhibit a very wide range in GC properties. Our focus in the next section is to understand the origin this diversity.

Figure 4. Globular cluster specific frequency, SN, vs. galaxy V-band absolute magnitude. Plotted are Virgo cluster galaxies from the ACSVCS (Peng et al. 2008, black dots), dwarf galaxies in the Virgo and Fornax clusters (Miller & Lotz 2007, black diamonds), and nearby dwarf galaxies (Georgiev et al. 2010, crosses). Literature UDGs are plotted for Virgo (Mihos et al. 2015, red triangles) and Coma (van Dokkum et al. 2017, red asterisks). Red filled circles and red open squares show UDGs from our HST program and the Coma Treasury Survey data, respectively. We have indicated nucleated UDGs as the small yellow filled circles. The red solid line shows the mean SN values for all Coma UDGs. The blue solid line shows the mean SN values for "classical" Coma dwarf galaxies from den Brok et al. (2014) (shown individually as blue squares), and blue shading shows their associated standard deviation (1σ). Most UDGs (i.e., all red symbols) have large SN values that fall above the 1σ distribution for classical Coma dwarf galaxies. The gray dashed line indicates SN = 0. Along the top axis, we show the stellar masses for the UDGs calculated from their V-band total magnitudes using Bell & de Jong (2001), assuming their colors to be the same as DF44 and DFX1.
Download figure:
Standard image High-resolution image3.1. GC Specific Frequencies and Connections to Host Galaxy Properties
We have examined the properties of the individual galaxies to better understand which parameters are responsible for the observed wide range in specific frequency. Although UDGs have large sizes, their luminosities are similar to classical dwarf galaxies, leading us to suspect that the high specific frequencies are somehow related to the larger sizes of UDGs relative to classical dwarfs. Figure 5 shows our measured SN values plotted as a function of effective radius in three bins of galaxy magnitude. We find that for the more luminous galaxies, mean SN increases with galaxy size, although there is large scatter. There is no corresponding trend for the fainter galaxies, however. In order to make sure that our size-dependent aperture for counting the number of GCs was not causing the trend for the brighter galaxies, we also used a fixed large aperture to count the number of GCs and we found the same trend.

Figure 5. SN plotted as a function of galaxy effective radius. All symbols are the same as in Figure 4. We divided galaxies into three groups according to their total magnitudes, and magnitude ranges are noted in the top left corners of panels. Purple solid lines show mean SN values of all Coma galaxies in each magnitude range. The mean lines are smoothed using Gaussian kernel with FWHM of 0.5 kpc. Gray dashed lines indicate SN = 0.
Download figure:
Standard image High-resolution imageSurface brightness is another extreme property of UDGs, so we examine the relationship between SN and surface brightness in Figure 6. There appears to be a transition, where galaxies with surface brightness is fainter than  mag arcsec−2 have higher SN values than those in higher surface brightness galaxies, although there is a lot of scatter in this trend as well.

Figure 6. SN plotted as a function of galaxy surface brightness. All symbols are the same as in Figure 4. The purple solid line shows mean values of SN for all Coma galaxies (i.e., UDGs plus classical dwarfs). The line for mean values are smoothed using Gaussian kernal with FWHM of 0.5 mag arcsec−2. The gray dashed line indicates SN = 0. There is no significant correlation between surface brightness and SN.
Download figure:
Standard image High-resolution image3.2. GC Specific Frequencies and their Connection to Environment
There is also evidence that environment can also affect GC specific frequencies, particularly for low-mass galaxies. In Virgo cluster dwarfs, SN is generally higher the closer the galaxy is to the cluster center (Peng et al. 2008). Figure 7 shows SN plotted against distance from the Coma cluster center, RComa, which we take to be the cD galaxy, NGC 4874. As in Figure 5, we divide the sample into three bins of MV in order to separate out the trends in magnitude that we see in Figure 4.

Figure 7. SN of Coma galaxies plotted as against distance from cluster center (taken to be NGC 4874). All symbols are the same as in Figure 4, but we only plotted UDGs in the Coma cluster and mean value of classical Coma dwarf galaxies (blue squares; rms are shown as error bars) in this figure. The UDGs are divided into three groups with their total magnitude as same as Figure 5. Solid lines show mean SN values, and they are smoothed using Gaussian kernel with FWHM of 0 15.
15.
Download figure:
Standard image High-resolution imageThe SN of the most luminous UDGs do not show any trend with RComa, but with only five galaxies in this bin it is difficult to draw any conclusions. The fainter bins, however, do appear to display a correlation between SN and proximity to the cluster center. In the intermediate luminosity sample, the mean SN in the cluster core is ∼30, and in the faintest bin, the mean SN is ∼60. These are very high SN values when compared with the classical dwarfs in this luminosity range. In both magnitude bins, there is a weak but noticeable trend, with large scatter, for the mean SN to be higher at the cluster center and lower in the outskirts.
3.3. Nuclear Star Clusters
den Brok et al. (2014) studied the nucleation fraction of classical dwarf galaxies in the Coma cluster core and showed that is was quite high, with fnuc ≈ 60%. We visually identified stellar nuclei in our UDG sample, and found that 11 out of 48 galaxies appeared nucleated, an overall nucleation fraction of fnuc,UDG = 23%. At first, this seems significantly lower than for the classical dwarfs, but there has been some evidence that fnuc may be higher in denser environments (Baldassare et al. 2014; Ordenes-Briceño et al. 2018), and the Coma classical dwarf sample is biased toward the cluster core. In Figure 8, we plot the UDG nucleation fraction as a function of RComa and find a distinct trend where the fnuc,UDG ≈ 40% in the cluster core, dropping to 0%–20% in the outskirts. Even at the center of the cluster, UDGs still seem to have a lower nucleation fraction than the classical dwarfs, although the difference is not as large as when compared with the full UDG sample.

Figure 8. Fraction of nucleated UDGs and classical dwarfs plotted against distance from cluster center. Red filled circles indicate nucleated UDG fraction, and blue open square shows nucleation fraction of classical dwarf galaxies within our UDG magnitude range from den Brok et al. (2014). Error bars on X-axis show bin sizes, and error bars on Y-axis indicate pure Poisson errors.
Download figure:
Standard image High-resolution image4. Discussion
We have shown that UDGs exhibit a wide range in GC content, and that they generally have more GCs per unit luminosity than their classical dwarf counterparts. Some UDGs have SN values well above those of most classical dwarf galaxies; at the same time, nearly half of UDG sample shows SN values that are indistinguishable from those in classical dwarfs. We divide UDGs into "low" SN UDGs—with values within 1σ of that in classical dwarf galaxies (e.g., the blue region in Figure 4—and "high" SN UDGs—with values which are higher than 1σ limits observed in classical dwarf galaxies. Interestingly, most nucleated UDGs (10/11) are members of the high SN class.
We can also investigate the total masses of UDGs using their GC properties. Several studies have shown that the number of GCs is related to the total mass of a galaxy (Blakeslee et al. 1997; Peng et al. 2008; Harris et al. 2017), and UDGs may obey this relation based on dynamical mass estimates for three UDGs (Beasley et al. 2016; van Dokkum et al. 2017). We cannot overstate that the number of GCs is a highly uncertain measure of galaxy halo mass, especially in this mass regime, but it is the only information we have for a vast majority of UDGs. We have transformed the number of GCs to halo masses using the relation, log Mhalo = 9.62+1.12 log NGC (Harris et al. 2017). Although the interpretation of halo mass for satellites is not straightforward, it is customary to consider it as an estimate of the virial mass of their halos possibly at the time of infall into the cluster. With that caveat in mind, we find that the median total mass is about 1011 M⊙, which is larger than expected at their luminosity compared to simple extrapolation of abundance matching results (e.g., Moster et al. 2010; Behroozi et al. 2013), but still within the dwarf halo regime.
Figure 9 shows the relation between stellar mass and total mass. The stellar masses were measured from the galaxy luminosities and colors using Bell & de Jong (2001). There are many UDGs offset to higher halo mass when compared with the region defined by normal galaxies (blue and gray shaded regions). The UDGs have a median inferred Mh/LV ∼ 1000, suggestive of a massive galaxy origin. These galaxies could have formed their GCs early, after which time star formation was quenched preventing the formation of a disk and bulge. As our UDGs are located in a rich galaxy cluster environment, one might suppose that UDGs were efficiently quenched once they fell into the cluster potential well. A similar process can explain variation in SN for classical dwarfs (Peng et al. 2008; Liu et al. 2016; Mistani et al. 2016).

Figure 9. Inferred stellar mass vs. inferred total mass. The ordinate shows the stellar mass measured from the total V-band magnitudes using Bell & de Jong (2001), while the abscissa is total mass inferred from the NGC-total mass relation of Harris et al. (2017). We also note the total number of GCs along the upper axis. Filled circles show UDGs from this study and Peng & Lim (2016). Open squares and asterisks show UDGs from the Coma Treasury Survey and van Dokkum et al. (2017), respectively. Nucleated UDGs are indicated by small yellow dots, and UDGs with high SN values are highlighted with large open circles. Gray shaded regions shows galaxies from other environments. The blue shaded region indicates classical dwarf galaxies in the Coma cluster. The dashed line and solid line show the expectation from abundance matching and their extrapolation below M⋆ ∼ 108 M⊙ (Moster et al. 2010) and  (Behroozi et al. 2013).
Download figure:
Standard image High-resolution imageThe average total mass of high-SN UDGs is similar to that of M33. The Re,GCS of the M33 GC system (∼3 kpc, Peng & Lim 2016) is also within the range of the Re,GCS used for UDGs in this study (median Re,GCS ∼ 4 kpc). As a thought experiment, we can crudely estimate the infall time of these UDGs using M33's star formation history. UDGs have about 5% of the stellar mass of M33, and the time when M33 formed 5% of current stellar mass is about 7 Gyr ago based on its inner halo region of Barker et al. (2011). Being in a denser environment, it is likely that the Coma UDGs built their stars up faster. It is then plausible that galaxies having a mass similar to M33 fell into the Coma cluster at least 7 Gyr ago (zinfall > 0.8), and that their star formation was subsequently quenched by environmental processes, meaning that these galaxies could not form additional stars and eventually became UDGs. This qualitative picture is also supported by recent spectroscopic studies of UDGs in our sample which find mean stellar ages of 7–9 Gyr (Gu et al. 2018; Ferre-Mateu et al. 2018; Ruiz-Lara et al. 2018).
Low-SN UDGs, on the other hand, lie on the expected relation between stellar mass and total mass in Figure 9. These systems could have halo masses similar to those of classical dwarf galaxies. Indeed, a dwarf galaxy origin scenario for UDGs has been raised in several studies (e.g., Amorisco & Loeb 2016; Di Cintio et al. 2017; Rong et al. 2017). Total inferred halo masses for low-SN UDGs have a similar range as halo masses for UDGs with a dwarf galaxy origin seen in simulations. These UDGs could represent the high angular momentum tail of dwarf galaxies; alternatively, feedback-driven gas outflows or tidal harassment, could expand both the stellar content and dark matter within dwarf galaxies.
Finally, we show in Figure 10 that low-SN UDGs are on average slightly more elongated than high-SN UDGs. The distributions of b/a for high- and low SN UDGs are moderately different (at ≳2σ), with a KS test indicating D = 0.40 and probability of pKS = 0.038. This could be an indication having higher angular momentum, but this is speculation until we have stellar kinematic observations.

Figure 10. Distribution of axial ratios, b/a, for UDGs. The b/a values are from van Dokkum et al. (2015) and van Dokkum et al. (2017). The blue solid open histogram shows the distribution for UDGs with SN values similar to classical dwarf galaxies. The red dashed histogram shows the distribution for UDGs with high SN values. A KS test for these two distributions yields a K-S statistic of 0.40 and probability of 0.038, indicating that the distributions differ at high confidence.
Download figure:
Standard image High-resolution image5. Summary and Conclusion
We have presented a comprehensive study of GCs in 48 UDGs in the Coma cluster using HST data. Our sample includes 33 UDGs from a new observing program, one from our previous HST study (Peng & Lim 2016), 11 from the Coma Treasury Survey, and three UDGs from van Dokkum et al. (2017). Our primary findings can be summarized as follows:
- 1.The GC specific frequencies of UDGs are found to vary dramatically. On the whole, though, the mean SN values of UDGs are higher than those of classical dwarf galaxies at a given luminosity.
- 2.For the most luminous subset of UDGs, we find that GC specific frequencies are higher when the galaxy effective radius is larger. This trend is not so apparent for fainter UDGs.
- 3.For intermediate- and low-luminosity UDGs, those closer to the cluster center have higher SN values, pointing to the importance of environmental processes.
- 4.We have divided UDGs into two classes: UDGs with high and low SN values as compared with those of classical dwarf galaxies. The subsample of high-SN UDGs are dark-matter-dominated systems with M/LV ≳1000 based on the total mass inferred from total number of GCs. UDGs with low GC specific frequencies have M/LV values similar to those of classical dwarf galaxies (M/LV ∼ 500).
- 5.We find that 11 of our 48 UDGs to harbor nuclear star clusters. The fraction of nucleated UDGs varies with the distance to center of the cluster. UDGs have a higher nucleation fraction (fnuc,UDG ≈ 40%) in the cluster core, decreasing to 0%–20% in the outskirts. Classical dwarf galaxies, however, have an even higher nucleation fraction, fnuc ≈ 60% (den Brok et al. 2014), in the cluster core. Ten of the 11 nucleated UDG candidates are classified as high-SN systems.
The diversity in GC systems suggests that UDGs may arise through more than one formation channel (Pandya et al. 2018; Alabi et al. 2018; Amorisco et al. 2018). Further study of UDGs, particularly kinematic constraints from deep IFU spectroscopy, could provide important clues for our understanding of the properties and origins of UDGs.
S.L. thanks Jubee Sohn for providing a galaxy catalog for the Coma cluster. S.L. and E.W.P. acknowledge support from the National Natural Science Foundation of China through grant No. 11573002, and from the Strategic Priority Research Program, "The Emergence of Cosmological Structures," of the Chinese Academy of Sciences, grant No. XDB09000105. L.V.S. acknowledges support from the Hellman Foundation and HST grant HST-AR-14583. This research is based on observations made with the NASA/ESA Hubble Space Telescope, obtained [from the Data Archive] at the Space Telescope Science Institute, which is operated by the Association of Universities for Research in Astronomy, Inc., under NASA contract NAS 5-26555. These observations are associated with program 14658.
Facility: HST. -
Footnotes
- 8
Number of GCs per unit luminosity of host galaxy,
 .
. - 9
We refer to more typical dwarf galaxies, those with low stellar mass and smaller sizes, as "classical" dwarf galaxies to avoid pre-supposing that UDGs are not dwarf galaxies.
- 10
