


Abstract
This paper presents data on the simultaneous and complementary observations of the gamma-ray burst (GRB) GRB 161017A for optical, X-ray, and gamma wavelengths obtained by the Russian multi-messenger Lomonosov space observatory and supplemented by additional data from the Swift satellite as well as the ground-based MASTER Global Robotic Net and the 10 m Gran Telescopio Canarias. Multifrequency spectra of this very powerful explosion indicate that it originated at a distance of 10 billion light years from Earth. Here, we present the results of the prompt, early, and afterglow optical observations. The light curves and spectra suggest that the prompt optical and high-energy emissions occur in the same region near the GRB source.
Export citation and abstract BibTeX RIS
1. Introduction
Only a few months after the launch of the Lomonosov spacecraft, a gamma-ray burst (GRB), GRB 161017A, was extensively observed with the satellite's onboard instrumentation. The Lomonosov observatory was created through the efforts of scientists at both the Lomonosov Moscow State University (MSU) and at the Electro-mechanical Institute (VNIIEM) of the Russian Space Agency, and successfully launched from the newly opened Vostochny cosmodrome on 2016 April 28. During the first months of space operation, dozens of very interesting phenomena were detected from space and from terrestrial origins. In particular, several GRBs were detected. GRBs are the most explosive events known in the universe. GRBs typically last only seconds, but extend in some cases for minutes and even up to several hours. The prompt optical emission and optical afterglows of GRBs are now observable by the robotic ground-based telescopes of the MASTER Global Robotic Net, which was constructed by MSU. These optical telescopes are located across four continents and are also situated in the Canary Islands. Thus, the MSU researchers and their collaborators are in a unique position to carry out synchronous optical and gamma-ray observations of black holes, which may provide important clues regarding black hole formation, the process that is likely to be responsible for GRBs.
The GRB monitor (BDRG) on board the Lomonosov observatory (hereafter BDRG/Lomonosov) recorded multi-channel data (at gamma wavelengths) for the powerful burst occurring on 2016 October 17, while the ground-based MASTER facility located near Blagoveshchensk automatically recorded emissions of the same event in the optical range. It should be noted that such synchronous observations are very rare in the history of GRB observations. The coincidence is all the more noteworthy, because the Lomonosov Space Observatory was launched from the Vostoschny cosmodrome located near Blagoveschensk, i.e., a location hosting one of the MASTER single units that obtained this unique data set.
2. Gamma-ray Observations
The BDRG/Lomonosov10 (Amelushkin et al. 2013a, 2013b) was built for the early detection of GRBs in the 10–3000 keV energy range and for the generation of triggers for those events. The BDRG consists of three identical detector units connected to the electronic unit. The BDRG instrument detector units (blocks) are mounted on the spacecraft payload platform in such a way that their axes are oriented 90° to each other. Each detector has a cosine angular dependence for a sensitive area not occluded by satellite construction elements within ∼60° of its axis. The monitor's central axis, relative to which the detector axes are inclined, is directed toward to the local zenith. Thus, the total field of view (FOV) for all three detectors is about 2π sr; and one quarter of this field, i.e., π/2 sr, has the value of a solid angle, within which limits the GRB error can be estimated with sufficiently high accuracy through the comparison of all three detector outputs.
The BDRG instrument operates in two main observational modes: the monitor or continuous mode, and the event mode. In the monitor mode, all instrument outputs are recorded and stored continuously with time resolutions adjustable by commands from Earth. On the other hand, the burst mode is activated by onboard instrument triggers to record detailed information of each photon during the pre-burst, burst, and after-burst intervals. These data are further analyzed, and when identified as GRB-like events, they are subsequently utilized for data fixation in the MASTER-SHOK optical cameras. MASTER-SHOK has FOVs that overlap the FOVs of two of the BDRG detector units and thus is able to make optical observations without redirection of the optical instrument. Consequently, the negligible time lapse between the GRB trigger and the beginning of optical observation allows for the capture of optical light curves, not simply for prompt emissions but also for their precursors. The BDRG trigger initializes the estimation of GRB positions and relays the trigger data not only to the other GRB observation instrument on board the Lomonosov spacecraft, the Ultrafast Flash Observatory (Park et al. 2013), but to ground telescopes as well through the Gamma-ray Coordinates Network (GCN) via the Global Star transmitter.
Each BDRG detector unit consists of a thin layer of (0.3 cm) Na i(Tl) crystals optically coupled to a considerably thicker layer (1.7 cm) of Cs i(Tl) crystals situated underneath. The diameter of these scintillators is 13 cm, and both layers are read by a single photomultiplier tube. Thus, the overall detector area is about 130 cm2. The thickness of the Na i(Tl) layer is optimized for the soft part of energy range, and the working ranges of the units are 0.01–0.5 MeV for the Na i(Tl) layer and 0.05–3 MeV for Cs i(Tl). As such, the Na i(Tl) layer serves as the main detector for hard X-ray timing, while the Cs i(Tl) operates as an active shield against background gamma-rays. Additionally, the Cs i(Tl) crystals can also detect gamma-rays with energies up to a few MeV. The difference in decay times for the Na i(Tl) (∼0.25 ms) and Cs i(Tl) (∼2.0 ms) crystals permits the separation of light flashes in the scintillators through special electronic circuits that differentiate pulse shapes.
The information provided by the BDRG units consists of a number of different categories for the data frames generated continuously (continuous mode) as well as irregularly by various triggers (burst mode). The continuous data stream includes three types of frames corresponding to the instruments' monitoring, spectrum, and event. Monitoring frames provide count rates in 8 energy channels for the Na i(Tl) and Cs i(Tl) scintillator crystals for each of the BDRG detector units, while spectrum frames contain 724 channel spectra for Na i(Tl) and Cs i(Tl), separately. Event frames give the primary values for energy release within the Na i(Tl) and Cs i(Tl) crystals, combined with time data for a fixed number of detected gamma quanta. Likewise, information about the main parameters for all GRB triggers is stored and transferred in the form of "trigger logs." There are three trigger types categorized as "fast," "slow," and "super-slow," with characteristic times of 10 ms, 1 s, and 20 s, respectively. Corresponding to each trigger type, three data frame sequences for the monitoring, spectrum, and event are generated continuously in a manner similar to the continuous mode discussed above. A portion of data collected before the trigger is always included for all trigger types.
On 2016 September 17, the BDRG/Lomonosov triggered upon detection of GRB 161017A (Troja et al. 2016) at 17:52:17 UT. This event was characterized as super-slow, and gamma by gamma counts were recorded for a 30 s interval prior to triggering and 119 s thereafter. The burst intensities measured in the 20–100 keV range by the Na i(Tl) detectors of BDRG1, BDRG2, BDRG3 units correspond to 4.4σ, 14.1σ, and 0.045σ significance levels, respectively. Thus, the event was registered as significant by two of the three detectors (BDRG-1 and BDRG-2), with the most significant results from the BDRG-2 instrument.
Figure 1 presents the GRB 161017A light curve for the 20–300 keV range obtained from the BDRG-2 Na i(Tl) outputs with a time resolution of 1 s. Also presented in this figure are the light curves for the same event captured by the BAT Swift11 (Barthelmy 2000; Parsons et al. 2000) and GBM Fermi12 instruments at the energy range of 15–350 keV. As shown in the plots of all three observations, the GRB 161017A light curve has several peaks, and the total burst duration within the energy range of 20–300 keV is ∼100 s. The ∼30° difference between the BDRG-2 axis and the GRB source coordinates necessitates adjustment by a factor of approximately 0.8 in the estimation of real effective area, and after this correction is taken into consideration, we may conclude that the BDRG/Lomonosov and BAT/Swift instruments provide similar intensities for both peaks.

Figure 1. GRB 161017A light curves. The top panel presents the count rates in the 20–300 keV range for the BDRG-2 Na i(Tl) detector; the middle panel gives the time intensity profile in the 15–350 keV range for the BAT/Swift (https://gcn.gsfc.nasa.gov/swift_gnd_ana_lc/718023_bat64ms_lc.txt) instrument; and the bottom panel provides the count rate time profile in the 15–350 keV range for the GBM/Fermi (https://heasarc.gsfc.nasa.gov/FTP/fermi/data/gbm) detector. The countdowns presented in the panels lead up to the corresponding trigger times (17:52:17 UT BDRG/Lomonosov, 17:51:51 UT BAT/Swift, 17:52:08.26 UT GBM/Fermi). The time intervals for which energy spectra were obtained (see Figure 4) are numbered for Lomonosov data and marked by vertical lines for Fermi data.
Download figure:
Standard image High-resolution imageThe most intriguing feature of the GRB 161017A data is the presence of a quite significant increase in the count rate at about 140 s after the BAT/Swift trigger and at about 100 s after the BDRG/Lomonosov trigger. This time shift of about 40 s between the two triggers indicates an equivalent increase for both light curves. The event is observed at about 140 s after the first burst peak, which implies that the GRB central engine continues its operation for a rather long time following burst inception.
Figure 2 presents the time profiles of gamma-ray counts in different energy ranges along with the hardness ratios for burst peaks. These profiles are derived from the BDRG-2 Na i(Tl) detector monitor frame data through the subtraction of background counts from the initial counts collected over 1 s exposure intervals. As is apparent in Figure 2, the lesser and greater intensities of the first and second peaks are traceable in the 10–20, 20–35, 35–60, 60–100, and 100–170 keV channels, while the second peak is also detected in the 170–300 keV range. The double-peak structure of the second more intensive peak, clearly visible in the BAT/Swift data, is also apparent in the BDRG data, but only in the 60–100, 100–170, and 170–300 keV channels. These higher values indicate that the structure is caused by higher energy gamma-ray photons, as confirmed by the 60–300 keV to 20–60 keV count rate hardness ratio. This ratio is significantly higher at peak times than during the interpeak intervals. There is also some indication of a double-peak structure for the first peak, but the data lacks adequate resolution as a result of the lower count rate.
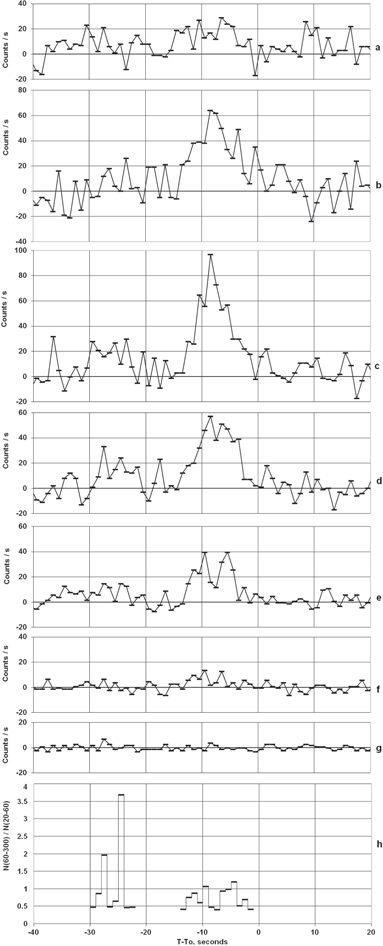
Figure 2. Counting rate time profiles for the BDRG-2 Na i(Tl) energy channels shown for the panels above: (a) 10–20 keV (N10–20), (b) 20–35 keV (N20–35), (c) 35–60 keV (N35–60), (d) 60–100 keV (N60–100), (e) 100–170 keV (N100–170), (f) 170–300 keV (N170–300), (g) 300–450 keV (N300–450), and (h) hardness ratio for 60–300 keV to 20–60 keV (N20–60/N60–300) considering t0 = 17:51:51 UT as the trigger time.
Download figure:
Standard image High-resolution imageThe fine structure of the GRB 161017A time profile in gamma-rays shown in Figure 3 displays as a function of the intervals recorded at three different time resolutions for a counting rate in the 15–600 keV range. These dependences are reconstructed from gamma-ray photons recorded in the event frames. The top panel depicts a fraction of the light curve at a 100 ms time resolution; the central panel zooms in on a 25 s period centered on the peak structure; and the bottom panel presents the data recorded at a 10 ms resolution for the interval corresponding to the highest count rate, which includes the peak. The double structure of the second burst peak of these gamma-ray light curves, which becomes quite apparent at a 1 s time resolution (see Figures 1, 2), is actually more complex. A number of several peak-like variations with typical durations in the dozens of ms can be detected in the light curve when the time resolution is increased to 10 ms.
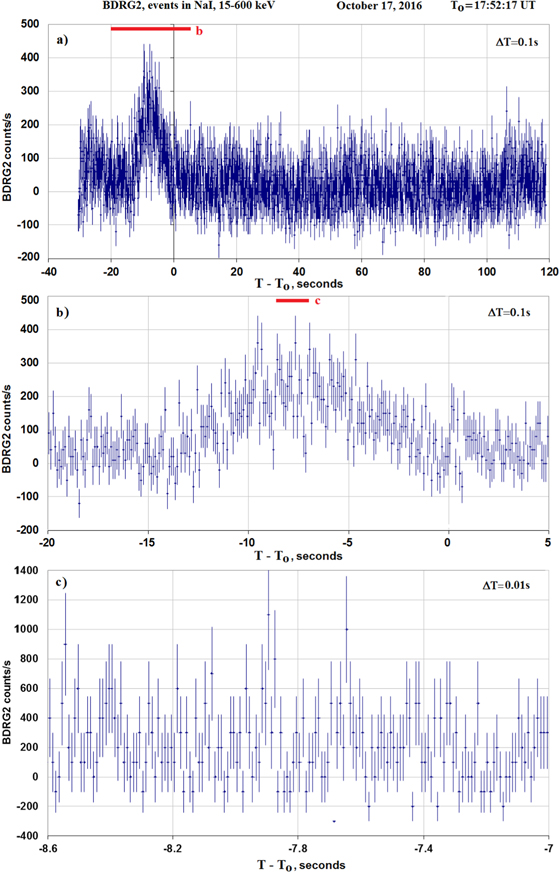
Figure 3. Lomonosov/BDRG-2 Na i(Tl) counting rate time profiles in the 15–600 keV energy range at different time resolutions. The uppermost panel provides a light curve for a 100 ms time resolution, while the middle panel is a blow-up of the region surrounding the most intense peak (the corresponding time interval is marked in red at the top of the panel). The bottom panel shows the same light curve at a 10 ms time resolution for the interval marked in red in the middle panel. T–T0 indicates time elapsed since the time of trigger (T0).
Download figure:
Standard image High-resolution imageMonitoring counts taken across wide energy ranges and event-by-event data were employed to obtain energy spectra. The background counts in the Na i(Tl) monitoring channels (20–450 keV) were estimated from non-burst background counts collected during other orbits for celestial coordinates in the vicinity of the coordinates from which the bursts were detected. These background values were subtracted from initial counts to extract so called "burst counts." Further, these corrected count values were estimated independently from gamma to gamma data for the burst time interval. The primary energy spectra were reconstructed from the burst counts with the use of the BDRG response matrix for the Na i(Tl) detector (Svertilov et al. 2018) and the application of a power-law method with an exponential cut-off model:
where Ep and A are measured in keV and phot cm−2 s keV units, respectively. The spectrum reconstruction was made for the three intervals marked by the blue lines above the light curve in the top panel of Figure 1. The first of these intervals corresponds to the first burst peak, or precursor signal, occurring at 17:51:49–17:51:53 UT. Interval 2 refers to an early sub-interval of the GRB's second and most intense peak, i.e., the first subpeak recorded at 17:52:07–17:52:09 UT. Finally, interval 3 identifies the second subpeak of the main peak at 17:52:11–17:52:13 UT. Table 1 presents the power law with exponential cut-off approximation parameters for spectra obtained for the three intervals mentioned above. The chi-square test was used to determine the spectral parameters. For various combinations of Ep, A, and α, the expected response of NaI(Tl) in six energy channels ranging between 20 keV and 450 keV was compared with the experimental data. We chose the values for which the chi-square value was minimal. The accuracy of Ep, A, and α was estimated from the interval of values in which the experimental and model counting rates do not differ at a significant level. This accuracy is 15%–20% because of background conditions and a small number of high-energy channels.
Table 1. Spectral Parameters Obtained from Chi-square Fit to the Data
| Time Intervals | Epeak, keV | α | A, phot cm−2 s keV |
|---|---|---|---|
| 17:51:49–17:51:53 UT | 190 ± 30 | −(0.8 ± 0.2) | 0.011 ± 0.005 |
| 17:52:07–17:52:09 UT | 220 ± 50 | −(0.8 ± 0.2) | 0.025 ± 0.01 |
| 17:52:11–17:52:13 UT | 200 ± 40 | −(0.8 ± 0.2) | 0.03 ± 0.01 |
Download table as: ASCIITypeset image
To obtain a complete spectral data presentation across a wider energy range, we performed a time-dependent spectral fitting utilizing GBM/Fermi data for the following time intervals: (i) T0 − 18 s to T0 − 15 s and (ii) T0 − 2 s to T0 + 10 s, where T0 = 17:52:08.26 UT, 2016.10.17. These intervals are also marked on the GBM light curve presented in Figure 1. Actually, interval (i) of this GBM/Fermi data corresponds to the first interval (1) of the Lomonosov light curve presented in Figure 1: i.e., the interval surrounding the first, or precursor, peak. Interval (ii) of the GBM/Fermi data slightly overlaps intervals 2 and 3 of the Lomonosov light curve and corresponds to the main peak. The Fermi's fourth and fifth Na i(Tl) GBM detectors and BGO B0 unit were selected based on the brightness of the signal they received and the geometry of their angles (<60°) with respect to the source position relative to their detector axes. We extracted the discrete source and background spectra of these detectors for each given time interval. The detector response matrix files were generated time-dependently using the GBM Response Generator.13 We fit the spectra with our Monte Carlo-based spectral fitting package (McSpecFit; Zhang et al. 2016). Thus, the primary GBM/Fermi spectra were deconvolved from the three count spectra of the Na i(Tl) 4 and 5 and BGO B0 detectors. The energy ranges are 8–907 keV for the Na i(Tl) and 0.2–40.0 MeV for the BGO detectors, respectively. We found that a simple power-law model with a photon index α = −(1.5 ± 0.1) is adequate to fit the spectra in interval 1 with PGSTAT/dof = 306.1/363. For interval 2 the best-fit model is a Band function (Band et al. 1993):
with the following best-fit parameters:  ,
,  ,
,  keV, A = 0.011 ± 0.005 phot cm−2 s keV with PGSTAT/DOF = 330.0/361. The result is similar to the one obtained by a χ2 analysis, but it is calculated for Poisson data with a Gaussian background.14
DOF states the number of degrees of freedom.
keV, A = 0.011 ± 0.005 phot cm−2 s keV with PGSTAT/DOF = 330.0/361. The result is similar to the one obtained by a χ2 analysis, but it is calculated for Poisson data with a Gaussian background.14
DOF states the number of degrees of freedom.
The deconvolved energy spectra from BDRG/Lomonosov and GBM/Fermi data are presented in Figure 4. Also given are the spectral flux density residual values, i.e., the deviations of the observational values Jobs from theoretical values Jth relative to absolute errors Jerr, (Jobs − Jth)/Jerr. As can be seen, there is no contraction between the BDRG/Lomonosov and the GBM/Fermi data. Some of the spectrum steepening of BDRG/Lomonosov data can be explained by the lower efficiency of the thin BDRG Na i(Tl) detector at energies above 300 keV. The spectra for the first (or precursor) peak and the subpeaks of the second burst peak match the hardness ratio of Figure 3 and are significantly harder than the spectra of the interpeaks.

Figure 4. Spectral fitting plots for the GRB 161017A precursor and main peaks. The left panel (a) shows the power-law function fitting (red line) for interval (i) from both the GBM/Fermi data (vertical black error bars), as well as the spectral flux density values from the BDRG/Lomonosov monitoring channels (light blue crossed lines) for the precursor (time interval No 1 in Figure 1). The right panel depicts a Band function fitting (red line) for interval (ii) of the GBM/Fermi data and the spectral flux density readings of the BDRG/Lomonosov monitoring channels. The light blue crossed lines indicate the main peak's first subpeak (time interval No 2 of Figure 1), and the lime green crossed lines, the main peak's second subpeak (time interval No 3 on the Figure 1). The spectra have been rebinned into wider bins for clarity. The flux spectral density residual values are presented in the bottom parts of the figure.
Download figure:
Standard image High-resolution imageFrom these energy spectra, burst fluence values in the 10–300 keV energy range were estimated for the precursor and the main peak as 5.5 · 10−7 erg cm−2 and 3 · 10−6 erg cm−2, respectively.
3. Optical Follow-up Observations
GRB 161017A was first detected at gamma-ray wavelengths by the Lomonosov and Swift instruments. Following the Swift's transmission of a GCN alert, the MASTER robotic telescopes (see Figure 5) were automatically directed to the preliminary GRB source coordinates to begin their optical observations. Following the MASTER automatic observation, the analysis software reported the detection of a GRB optical emission and signaled the world's largest optical telescope, the 10 m Gran Telescopio Canarias (GTC) located in the Canary Islands, which recorded the burst and from the redshift value determined the host galaxy to be about 10 billion light years away.

Figure 5. Sketch of the global MASTER robotized network for space monitoring developed at the M.V. Lomonosov State University in collaboration with the Blagoveshensk Pedagogical State University Irkutsk State University, Ural Federal University, and the Pulkovo Observatory's Kislovodsk Mountain Station all in Russia, as well as the Instituto de Astrofísica de Canarias (Spain), the Universidad Nacional de San Juan (Argentina), and the South-African Astronomical Observatory. The facility locations of the corresponding participants are marked by flags on the map.
Download figure:
Standard image High-resolution image3.1. MASTER Prompt Optical Observations
The MASTER Global Robotic Net (Lipunov et al. 2004, 2010) is a network of fully automated telescopes created for the study of transient astronomical events (Figure 5). Each observatory in the network contains two classes of instruments: two fast very wide field cameras (MASTER-VWFs) with FOVs of 400 sq. degrees and two 40 cm wide field telescopes (MASTER-IIs) with a combined FOV of 8 (=2 × 4) sq. degrees. The MASTER-II instruments are able to provide surveys at a speed of 128 deg2 hr−1 at a limiting celestial magnitude of 20 on dark, moonless nights. Observations are made with Johnson BVRI filters, with two orthogonal polarizers, or without a filter for integral (white) light. Details of the MASTER filters and polarization measurements can be found in Kornilov et al. (2012) and Pruzhinskaya et al. (2014).
The MASTER system was developed to study the earliest stages of GRB evolution; consequently, each telescope is equipped with the world's most rapid telescope steering and targeting mechanisms, and the observation process is designed in such a way as to minimize or eliminate all possible delays in the initial stages of observation. In many cases, including the one considered here, such accommodations permit us to observe GRB prompt optical emissions (Gorbovskoy et al. 2016; Troja et al. 2017).
The MASTERNet software was developed to discover more than 10 different types of optical transients (OTs) (Lipunov et al. 2010, 2016a, 2016b; Kornilov et al. 2012; Gorbovskoy et al. 2013 and references therein). Included in this mission is the very rapid discovery and investigation of GRB optical counterparts (Gorbovskoy et al. 2016; Lipunov et al. 2016c); and, as detailed in the following paragraph, the robot published a GCN telegram about the discovery of the optical counterpart of GRB 161017A only 3.5 minutes after the arrival of the Swift trigger.
Following the Swift GCN trigger alert, the MASTER-Amur robotic telescope15 , located in Blagoveschensk (Russia, Far East), automatically targeted GRB 161017A at 17:52:38 UT on 2016 October 17, 22 s after notice time and 47 s after the Swift trigger time. The MASTER telescope made observations in alert mode, utilizing two parallel tubes fitted with polarization filters at exposure times determined by the formula texp = (Tstart–Ttrigger)/5, where Ttrigger is the trigger time (UT) and Tstart is the time at exposure initiation (UT). The exposure time, which cannot exceed 3 minutes, is rounded to an integer in steps of 10 s.
The automatic pipeline commenced immediately after the first two images were read out from the CCD-cameras. For the first two 10 s exposure images (initiated 47 and 71 s subsequent to triggering), there were no new sources inside the Swift error box for either of the two cameras. For the third image, a 20 s exposure commencing 96 s following trigger, the MASTER-Amur transient auto detection system found a single OT within the BAT/Swift error box brighter than the automatic upper limit, which was set to approximately 14.5 mag for both cameras. The source was detected at coordinates (J2000): R.A. = 9h31m04 6, decl. = +43d7m359, with an automatically determined unfiltered magnitude of 13.4. This source was automatically confirmed by the following (fourth) exposure taken through both tubes. This final dual exposure was completed 160 s after trigger, which takes about 60 s for image processing into account from 237 s after trigger (∼3.5 minutes after notice). A MASTER telegram (Yurkov et al. 2016) was then automatically published on the GCN system (Figure 6).
We have developed an automated transmission of information for newly discovered optical events detected at magnitudes that exceed the detection threshold (>4σ). As a result of accurate photometric processing, we were able to measure the magnitude of the object in the first two images (Yurkov et al. 2016) at a position consistent with the coordinates reported by Troja et al. (2016).

Figure 6. MASTER-Amur GRB 161017A observations, automatic pipeline, and automatic GCN telegram (Yurkov et al. 2016) sending timeline.
Download figure:
Standard image High-resolution imageOver time, the OT became brighter by a factor of 3–4, reaching a maximum brightness of about 13.6 mag (Figure 7). The observation was of a prompt emission whose activity can be extended to a duration surpassing 100 s at gamma frequencies, as measured by the BDRG/Lomonosov and BAT/Swift instruments (Figure 8). Once the gamma-ray activity ceased, the optical source followed the classical afterglow power-law decay pattern, remaining visible to MASTER-Amur until ∼700 s after the trigger and decaying to magnitude 16 over this period. We estimate a power-law decay index α = 1.28 ± 0.3 (with F ∼ t−α) during the early afterglow stage for the time range from ∼200–700 s following the trigger. After ∼700 s, the flux decayed to the point that it became invisible to the MASTER-Amur instrument's current upper detection limit of 16 mag.

Figure 7. MASTERNet optical observations. Red and blue points plot the MASTER-Amur polarimetry observations. The black dots indicate the MASTER-Tunka data, and the green dots show the MASTER-IAC data without a filter, i.e., white color.
Download figure:
Standard image High-resolution image
Figure 8. Joint Lomonosov, MASTERNet, and Swift observations of GRB 161017A across a wide range of frequencies from optical emissions to gamma-rays. The very early MASTER optical bump seems correlated to the gamma-ray and X-ray peak at around 100 s. This data indicates continuing multiple-band central engine activities as discussed in Zhang et al. (2014).
Download figure:
Standard image High-resolution imageThe MASTER-Amur observations were made at z = 53° zenith distance and were affected both by a Moon that was 96% full, 50° above the horizon, and displaced by 87° from the object coordinates and by atmospheric conditions that included tiny clouds. These conditions also affected the upper magnitude limit stated above. The MASTER-Amur observed the GRB position over the following ∼4 hr, but during that time the event flux never exceeded the instrument's upper limit of ∼16 mag.
Two additional MASTERNet observatories also studied this GRB (Sadovnichy et al. 2016). The MASTER-Tunka robotic telescope (located near Lake Baykal) targeted the GRB 161017A 75 s after notice time and 103 s after trigger time. However, this observation was occluded by fog rising from the Irkut River, and the optical source was detected only as a single image captured about 900 s after the trigger. We estimate the GRB magnitude as 15.7±0.3 at this time. The MASTER-IAC robotic telescope located at Teide Observatory (Tenerife, Canary Islands, Spain) automatically targeted GRB 161017A ∼9 hr after trigger time on 2016 October 18 starting at 03:00:53 UT. We detected the OT on co-added images at 18.6 mag. The measurements taken with the polarization filters were very similar to each other. Hence, we were unable to identify any significant polarization.
The full photometric results are listed in Table 2 and shown in Figure 6. Figure 8 shows the joint light curve at different wavelengths, the features of which will be discussed in Sections 3.3 and 4.
Table 2. MASTER Photometry Results
| Time | Tstart–T0 | Tmid–T0 | Expt. (s) | Site | Filter | Mag. | eMag. | Filter | Mag. | Error Mag. |
|---|---|---|---|---|---|---|---|---|---|---|
| 17:52:38 | 47 | 52 | 10 | MASTER-Amur | P/ | 14.6 | 0.7 | P/ | 14.5 | 0.7 *s/n = 1.2 |
| 17:53:07 | 71 | 76 | 10 | MASTER-Amur | P/ | 14.05 | 0.3 | P/ | 13.99 | 0.3 |
| 17:53:03 | 96 | 106 | 20 | MASTER-Amur | P/ | 13.87 | 0.2 | P/ | 13.63 | 0.2 |
| 17:54:03 | 131 | 146 | 30 | MASTER-Amur | P/ | 13.90 | 0.3 | P/ | 13.80 | 0.3 |
| 17:54:46 | 175 | 195 | 40 | MASTER-Amur | P/ | 14.34 | 0.3 | P/ | 14.34 | 0.3 |
| 17:55:41 | 229 | 254 | 50 | MASTER-Amur | P/ | 15.03 | 0.4 | P/ | ⋯ | ⋯ |
| 17:56:46 | 295 | 325 | 60 | MASTER-Amur | P/ | 14.91 | 0.4 | P/ | 14.91 | 0.4 |
| 17:58:12 | 381 | 540 | 240 | MASTER-Amur | P/ | 15.88 | 0.4 | P/ | 16.03 | 0.4 |
| 18:05:20 | 809 | 889 | 160 | MASTER-Tunka |

|
15.64 | 0.2 | ⋯ | ⋯ | ⋯ |
| 03:00:53 | 32942 | 33464 | 900 | MASTER-IAC | C | 18.62 | 0.2 | ⋯ | ⋯ | ⋯ |
| 03:19:17 | 34046 | 34587 | 900 | MASTER-IAC | C | 18.60 | 0.2 | ⋯ | ⋯ | ⋯ |
| 03:38:01 | 35170 | 35726 | 900 | MASTER-IAC | C | 18.62 | 0.2 | ⋯ | ⋯ | ⋯ |
| 03:57:26 | 36335 | 36885 | 900 | MASTER-IAC | C | 18.68 | 0.2 | ⋯ | ⋯ | ⋯ |
Download table as: ASCIITypeset image
3.2. GTC Spectral Observations
Following the detection of GRB 161017A by Swift (Troja et al. 2016), Fermi (Hui & Meegan 2016), and Lomonosov (Sadovnichy et al. 2016), we observed an optical afterglow (Breeveld & Troja 2016; Yurkov et al. 2016) with the 10.4 m GTC on La Palma, one of the Canary Islands, utilizing the OSIRIS Spectrograph (Cepa et al. 2000). Observations began at 05:59 UT on October 18 (i.e., 12.1 hr post-burst, Castro-Tirado et al. 2016), with both the R1000B and R2500I OSIRIS grating prisms (grisms), covering a combined range of 3800–10000 A. The observations consisted of a pair of 900 s exposures, one each for the R1000B and 2500I grisms. Data was reduced and calibrated through the employment of standard procedures utilizing IRAF and custom tools coded in Python, and G191-B2B served as the spectrophotometric standard (Oke 1990). The reddest spectrum (covering the range between 7350 and 10000 A at a resolution of 2500) shows the strong Mg ii doublet at a redshift z = 2.0127, consistent with the value reported by Postigo et al. (2016). We also identify other absorption lines in the bluest spectrum (e.g., Si ii, Fe ii), and, additionally, absorption lines in the two intervening systems at redshifts z = 0.916 and z = 1.370. The spectra and the lines identified in each system are shown in Figure 9.
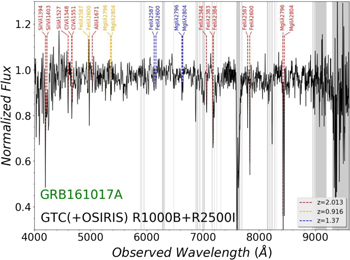
Figure 9. GRB 161017A normalized GTC spectrum observed by the 10.4 m GTC, composited from the R1000B and R2500I observations. The vertical gray bands show the range where telluric absorptions are important. Transitions are color coded to differentiate by absorption system, including the GRB host galaxy system at z = 2.0127.
Download figure:
Standard image High-resolution image3.3. Spectral Energy Distribution Fitting
To construct simultaneous wide-energy spectra, we selected time intervals that coincide with the optical observations. The GRB 161017A event is quite long, and the prompt stage contains four suitable intervals that coincide with the MASTER exposures: the intervals occurring at 71–81 s, 96–116 s, 131–161 s, and 175–215 s after the Swift/BAT trigger time. Furthermore, for the 132–142 s interval (during the second rebrightening), it was possible to use Lomonosov data for several energy ranges. We also made use of the Swift Spectra Repository (Evans et al. 2009) for the X-ray time-sliced spectra captured during the time intervals of the optical exposures. Additionally, we utilized BAT Data Analysis Guidelines16 for Swift/BAT spectra and available response matrices. The "batbinevt" procedure was used for data extraction for selected intervals: "batupdatephakw" and "batphasyser" for corrections; and, finally, the "batdrmgen" task for response matrix generation. Next, the spectra were fitted in XSPEC with "powerlaw" (power law), "cutoffpl" (cut-off power law), or "grbm" (Band function) in combination with absorption components. XSPEC model components "phabs" (Galactic absorption) and "zphabs" (absorption in the host galaxy) were also employed for soft X-ray absorption corrections. The spectra obtained from this combination of procedures are shown in Figures 10 and 11.
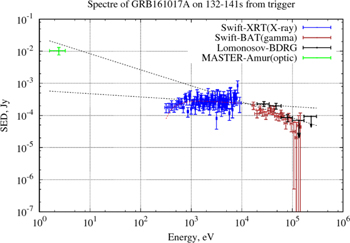
Figure 10. Joint Lomonosov, MASTER, and Swift spectrum during the second rebrightening.
Download figure:
Standard image High-resolution image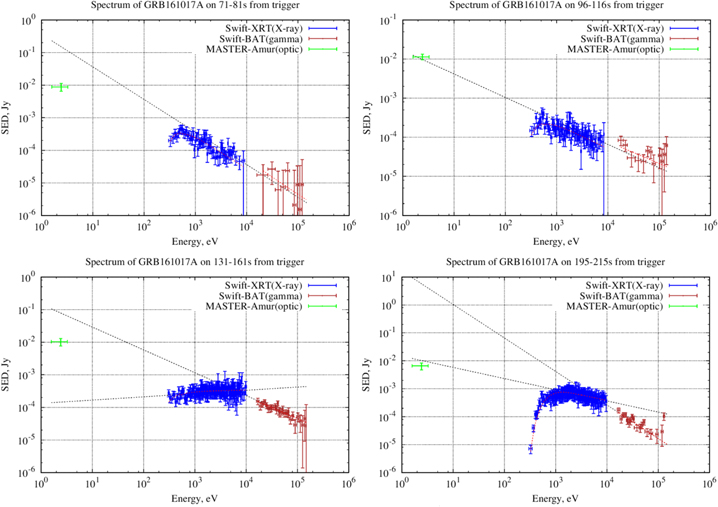
Figure 11. Optical, X-ray, and gamma-ray spectra for four time intervals covered by common MASTER-Amur, Swift/XRT, and Swift/BAT observations.
Download figure:
Standard image High-resolution imageFrom Figure 10, it is clear that the gamma spectrum from the Lomonosov data is in good agreement with Swift (in the overlap region) and supplements it in the high-energy region.
4. Discussion and Conclusion
GRB 161017A is the first GRB detected by the Lomonosov satellite, for which the optical light curve was obtained for prompt and follow-up emission; its gamma-ray emission measured up to 0.5 MeV. At a redshift z = 2.0127, the most recent findings are H0 = 67.3 km s−1 Mpc−1, 'ΩΛ = 0.685, 'ΩM = 0.315 (Planck Collaboration et al. 2016), and EISO = ∼1053 erg (for a GRB fluence of 3 · 10−6 erg s−1 and a luminosity distance of DL = 16.081 Gpc). There is no apparent forward shock emission in the optical light curve, and only an afterglow emission component is visible, peaking at around 100 s. If we interpret these observations according to the correlation provided by Liang et al. (2010), we may infer the initial Lorentz factor to be Γ0 ∼ 300.
As noted above, the prompt optical emission was detected during the first few minutes after the onset of the GRB. In some cases (e.g., Vestrand et al. 2005; Gorbovskoy et al. 2012), this optical emission may correlate with the prompt gamma-ray emission, whereas in other cases, the early optical light curve and the gamma-ray light curve are not correlated. The latter case seems to apply for GRB 161017A (see Figure 8). The X-ray and gamma-ray light curves have similar structures, but the optical emission increased over a significant interval, in the 50–120 s range, and continued decaying in the second activity episode that begins at around ∼130 s. Thus, the optical emission seems uncorrelated with the X- and gamma-rays. This is also indicated by the broadband spectrum (Figures 10 and 11). The optical flux density seems to be lower than expected from the overall gamma- and X-ray power-law fit. Nevertheless, it should be noted that after 130 s two small peaks are noticeable in three energy ranges. We find it interesting that, despite the similarity of their structures, these peaks are displaced relative to each other in time: the longer wavelength radiation is delayed with respect to its shorter wavelength one.
Also, the optical light curve has a smooth structure with a fairly shallow maximum (in logarithmic coordinates). In a recent paper, Lipunov et al. (2017) proposed their "smooth optical self-similar emission model (SOSSE)" as a universal mechanism for the optical emissions of GRBs with smooth light curves. At first glance, the GRB 161017A light curve resembles an SOSSE: the most important left, or leading, segment of the curve agrees well with SOSSE predictions as it increases to its maximum. Right at the beginning when the energy dissipation is still small and the angular momentum of the collected (rake up) substance is much smaller than the angular momentum of the jet, bolometric luminosity L grows approximately as L ∼ t2 assuming the surrounding matter is homogeneous. At this stage, the gamma coefficient of the shell remains constant, and the radius R grows proportional to t. Accordingly, the area of the radiating surface increases as R2. While the mass of the collected gas m is low (i.e., m <E0/(G2c2)), the luminosity increases. The luminosity reaches a maximum when the mass of the heated substance becomes comparable to the effective mass of the jet. After this, the radiation is determined by the dissipation of the bow shock during braking in the interstellar medium or the stellar wind of the progenitor (see discussion in Lipunov et al. 2017). This is confirmed by the measured optical power-law decay index α = 1.28 ± 0.3 after the peak.
However, in the case of our observations, inconsistencies emerge during the decay stage. There was a minor increase in optical intensity at ∼300 s concealed procedurally under measurement errors, but it should be noted that this increase follows a corresponding increase in the X- and gamma-ray emissions (Figure 8). Additionally, the points in the decay segment generally fall below the SOSSE trend line, and the most likely explanation is that following the generation of the SOSSEs, such effects are modified by other subsequent effects occurring in the relativistic jets dissipating into space. GRB 161017A is an extremely long event; therefore, we may be observing the SOSSE mechanism taking place in combination with various non-adiabatic effects in the jet as well as the extended operation of the central engine. The fact that the values for the GRB 161017A optical light curve fall below the trend line does not exclude the possibility that other as yet unidentified mechanisms are working to reduce the intensity of the GRB 161017A optical emissions below the values we would expect from a simple application of the SOSSE model. The data in Figure 12 are normalized to a maximum, where their contribution (apart from the SOSSE components of the optical emission) can be greater.

Figure 12. Comparison of GRB 161017A with smooth optical self-similar emission (SOSSE) model. The gray data set is a burst utilized by Lipunov et al. (2017), Figure 2) for SOSSE selection; the black line is a trend line and the red data set is GRB 161017A. SOSSE for GRB 161017A are tabbed in the vapor with other effects. As shown in Lipunov et al. (2017), the timescale is given in unit of τ with the definition of τ = t/tpeak. GRB data for this plot were obtained from the following papers: GRB 060605A (Rykoff et al. 2009), GRB 071010 (Covino et al. 2008), GRB 080710 (Kruhler et al. 2009) GRB 080810A (Page et al. 2009), GRB 100906A (Gorbovskoy et al. 2012), GRB 121011A (Pruzhinskaya et al. 2014), GRB 140629A (Gorbovskoy et al. 2014), and GRB 150413A (Gorbovskoy et al. 2016).
Download figure:
Standard image High-resolution image
GRB 161017A was the first GRB detected by the Lomonosov mission, for which the optical light curve was obtained for prompt and follow-up emission, and its observation proves that the onboard instruments (including the BDGR) are operating well and capable of detecting the most energetic known events in the Universe.
Analysis of the gamma-ray events observation during the BDRG experiment on board the Lomonosov satellite was fulfilled with the financial support of Ministry of Education and Science of Russia, grant No. RFMEFI60717X0175. A.J.C.T. acknowledges the Spanish Ministry Program AYA 2015-71718-R. MASTER Global Robotic Net is supported in part by the Development Program of Lomonosov Moscow State University. I.H.P. acknowledges National Research Foundation of Korea for Nos. 2018R1A2A1A05022685 and 2017K1A4A3015188. S.J. acknowledges the support of the Korea Basic Science Research Program through NRF-2018R1D1A1B07048993. This work was also supported in part by the RFBR grant 17-52-80133 and by Russian Science Foundation (RSF) grant 16-12-00085 (data analysis, interpretation, and discussion).
Footnotes
- 10
- 11
- 12
- 13
- 14
- 15
- 16