


Abstract
Laboratory measurements are reported that enable a more accurate determination of the characteristics of the near-infrared absorptions of  below 10 K. These data were obtained by photofragmentation of
  complexes in a cryogenic trap. Asymmetry in the profiles of the observed 9577 and 9632 Å absorption bands of
  is caused by the attachment of the weakly bound helium atom to hexagonal or pentagonal faces of
  . The implication is that the FWHM of the bands in the electronic spectrum of
  below 10 K is 1.4 Å. The effect of 13C isotopes on the
  electronic spectrum is experimentally evaluated by measurement of
  ,
,  , and
, and  . Data on the 9365 Å absorption band indicate a wavelength shift of about 0.3 Å between the former and latter. This result is consistent with models used to interpret the vibrational isotope effect in the Raman spectrum of neutral C60. The influence of 13C isotopes on the 9348, 9365, 9428, 9577, and 9632 Å diffuse interstellar bands is expected to be minor considering other broadening factors that affect astronomical observations. The presented data also provide more accurate relative intensities of the five interstellar bands attributed to
  .
.
Export citation and abstract BibTeX RIS
1. Introduction
In 2015 gas phase spectroscopic measurement of internally cold  ions was reported (Campbell et al. 2015). This was achieved by cooling
  in a cryogenic trap via collisions with 4 K helium buffer gas, attaching a helium atom, and dissociating the resulting
  complexes with laser radiation. The spectrum recorded using this method is slightly perturbed from that of
  itself but due to the weak interaction between
  and He the data obtained are sufficient to compare with astronomical observations. The electronic spectrum showed a striking match to two diffuse interstellar bands (DIBs) at 9577 and 9632 Å, leading us to conclude that the proposal made by Foing and Ehrenfreund in 1994 is correct (Foing & Ehrenfreund 1994).
Subsequently, astronomical observation of two intrinsically weaker  absorption bands near 9428 and 9365 Å was reported by Walker et al. (2015) providing further evidence for the presence of
  in diffuse clouds. Following improvements to our ion trapping apparatus, the perturbation on the wavelengths of free
  caused by the presence of the helium atom using this laboratory method was experimentally evaluated (Campbell et al. 2016b), leading to better agreement with astronomical data (Walker et al. 2016). By extending the wavelength range to encompass the majority of bands in the lowest energy electronic transition of
  the identification of a further DIB at 9348 Å was made (Campbell et al. 2016a). Finally, measurement of absolute cross-sections allowed the
  column density to be determined directly. This is found to be similar to that of CH+ along the same line of sight toward HD 183143. A recent summary has been given by Maier & Campbell (2017).
The assignment of five diffuse bands in the near-infrared to absorption by cold  ions present in the interstellar medium has generated considerable interest in the astrochemical community following our first report of the gas-phase spectrum (Campbell et al. 2015). The origin of these largely unidentified features observed in the spectra of star-light reddened by gas and dust has been the subject of decades of research, speculation, and debate. Due to the importance of the
  assignment, which is a convincing match between laboratory and astronomical spectra, further measurements by independent experimental (Kuhn et al. 2016) and observational (Cordiner et al. 2017) groups have been carried out. Results from the helium droplet apparatus (Spieler et al. 2017) were used to independently verify the wavelengths of the
  absorption bands reported in earlier studies employing ion traps. There is agreement in values inferred from both approaches. Note that the comparison between DIB wavelengths and laboratory results presented in Figure 3 of Spieler et al. (2017) is slightly confusing because both
  values and those extrapolated to
  are presented.
In the helium droplet studies, the role of  isomers on the measured widths of the absorption bands was discussed. For a helium atom adsorbed on
  the binding energy is largest above a hexagon, with that for a pentagonal location 1.3 meV smaller (Leidlmair et al. 2012). A unique situation exists for
  as occupation of all available low energy binding sites (20 hexagonal and 12 pentagonal faces) means that only one isomer should be present in the experiment. Spieler et al. (2017) reported a FWHM of 2.4 Å for the absorption near 9577 Å of
  , which is similar to the values derived by ion trap experiments on
  (Campbell et al. 2015), for which the helium can attach to either a hexagonal or pentagonal site. The comparable width of the
  band and that of
  provides an indication that isomeric broadening plays a minor role in the widths of the n = 1 data. However, some asymmetry in the absorption band profiles recorded using an ion trap has been previously reported (Campbell et al. 2016b).
No independent data are available on the intensity ratios of the  absorptions from the helium droplet experiments. The relative intensities are the least accurate spectroscopic characteristic determined by laboratory methods, with previous reports given only with an estimated uncertainty of about 20%. The systematic experimental uncertainties leading to this large value have been previously discussed (Campbell et al. 2016a). The only reported data on the intrinsically weak
  absorptions at 9428 and 9365 Å come from an earlier version of our instrument employing a 22-pole ion trap (Campbell et al. 2015). This was since replaced by a linear quadrupole trap to enable compression of the ion cloud, ensure good overlap with the laser beam, and allow absolute cross-sections to be determined (Campbell et al. 2016a).
Two of the five DIBs attributed to  have been widely studied (see Campbell et al. 2016b for a list of references). These are the 9577 and 9632 Å features initially observed by Foing & Ehrenfreund (1994). The spectral region covering both bands is heavily contaminated by telluric water lines and the 9632 Å region is partially obscured by magnesium stellar lines. The best observational data containing both of these interstellar absorptions is from Foing & Ehrenfreund (1997) where dry conditions at the high altitude CHFT telescope (Coudé Spectrometer) allowed an accurate removal of water lines. In general, however, the telluric and stellar observational constraints in this region lead to considerable uncertainties in the characteristics of the two astronomical bands, and an accurate removal of telluric water lines is clearly more difficult for observations at lower altitude sites. A discussion of this was given by Walker et al. (2017).
Three weaker absorption bands of  were searched for in astronomical spectra following laboratory measurement (Walker et al. 2016 and references therein). These intrinsically weaker absorption bands at 9428, 9365, and 9348 Å lie in regions that are even more strongly contaminated by water lines than near 9577 and 9632 Å. Especially problematic is the region around 9428 Å. Weak interstellar features at the
  wavelengths were reported in observations toward three reddened stars, HD 46711, HD 183143, and HD 169454. These data were obtained using the ESPaDOnS spectrograph (Donati 2003) and a gap in the spectral coverage means that the 9632 Å band cannot be observed. Furthermore, for one of these stars, HD 183143, where the 9577 Å absorption results in a strong attenuation of star light (∼10%), a stellar emission feature obscures the 9428 Å region. For HD 46711 all three weak bands are observed, but the overall intensity is low due to the abundance of
  along this line of sight. For HD 169454, the data were taken from the archive and the S/N is not high enough to search for the weakest band at 9348 Å.
In a dedicated study using the Hubble Space Telescope, interstellar absorptions at the  wavelengths were searched for along the line of sight toward BD +63 1964 (Cordiner et al. 2017). Such space-based observations offer a considerable advantage in that one of the major observational constraints, due to telluric water, is overcome. Unfortunately, such spectra are not "background free" because of contamination by overlapping stellar and perhaps also unidentified interstellar features. The
  band turned out to be very weak toward BD +63 1964, at about one-fourth of the depth compared to HD 183143. Nevertheless, weak interstellar features were observed around 9428, 9365, and 9348 Å, providing additional support for the identifications made (Walker et al. 2016).
One spectroscopic aspect that has not yet been considered experimentally concerns the effect of isotopes on the  absorption characteristics. Webster (1996) proposed a model to account for the structure observed in the well-studied 6614 Å diffuse band based on 13C. It was suggested that the appearance of this interstellar absorption, containing several distinct peaks separated by ∼0.7 cm−1, could arise as a result of a vibrational isotope effect in the upper electronic state involved in the responsible optical transition of a molecule containing 30–100 carbon atoms. Subsequent work by Webster (2004) investigated a possible zero-point isotope effect to explain broadening of the narrow 6196 Å diffuse band (Walker et al. 2001). High-resolution observational studies of the 6614 Å interstellar band showed that the energy differences of the peaks vary between lines of sight, suggesting that the origin of this structure is due to another effect such as temperature on the rotational contours (Cami et al. 2004). Nevertheless, the issue of the influence of isotopes on the spectrum is an important one for carbon-based molecules containing many tens of atoms. The natural abundance of 13C is about 1.1% which means that
  is composed of
  ,
,  , and
, and  ,
,  in the ratio 1:0.649:0.207:0.043. Due to high relative abundance of
  containing one and two 13C atoms, it is important to experimentally evaluate the influence of isotopic substitution on the wavelengths of the near-infrared absorption bands.
In this contribution, measurements are reported that more accurately determine the band profiles and intensities of the near-infrared absorptions of  encompassing the five absorptions of
  identified in astronomical spectra. Experimental results for mass-selected
  containing one and two 13C atoms are presented and the astronomical implications discussed.
2. Experimental
The central parts of the cryogenic ion trap apparatus used to carry out the experiments presented here are described in Campbell et al. (2016a).  ions were produced in an electron impact (40 eV) ionization source after heating a solid sample to 375 °C. Ions were mass-selected using a 20 cm long quadrupole with 9.5 mm diameter rods operating at a frequency of 1.2 MHz. Following their mass-selection, ions with m/z of either 720, 721, or 722 u/e were turned through 90° using an electrostatic bender and injected into a linear quadrupole ion trap (V0 = 160 V, f = 700 kHz) mounted onto the second stage of a closed cycle helium cryostat with a nominal temperature, Tnom = 4.9 K. Around 5000 primary ions per filling were cooled by collisions with cryogenic helium present at a number density of a few 1015 cm−3 for 500 ms. After pumping out the helium for 150 ms, the complexes are fragmented using radiation from a continuous wave diode laser. The ion cloud irradiation time (30 ms) was controlled using a mechanical shutter. The trap contents were then extracted and analyzed using a quadrupole mass-spectrometer and a Daly detector, and the trapping process was repeated at a rate of 1 Hz.
Interaction of cold  ions with dense helium buffer gas led to the formation of
  complexes. Mass-selection of primary ions enabled production of helium complexes with
  ,
,  , and
, and  , appearing at m/z = 724, 725, and 726, respectively, with almost no background. The attenuation in the number of complexes is described by N(Φ) = N0exp(−Φ/Φ0), where Φ is the photon fluence. The number of complexes were monitored on alternative trapping cycles with (Ni) and without (N0) laser radiation, in order to account for long-term fluctuations in the ion beam, and the laser power recorded using a power meter to allow correction for variation in the fluence as a function of wavelength, Φ(λ). The relative cross-sections σrel are a measure of the relative intensities of the bands and are proportional to 1/Φ0.
The same laser diode used by Campbell et al. (2015) but mounted in a Littmann/Metcalf rather than Littrow configuration was used in the present work. The former was used to avoid movement of the laser beam position during scans. The nominal bandwidth is ≪0.01 cm−1; however, multimode operation at certain positions of the grating/mirror led to an increase of this up to 0.3 cm−1. Removal of data points from the spectra recorded during multimode operation did not lead to any significant deviation in the appearance of the measured profiles, and so all are included in the presented figures.
3. Results
3.1.
 Spectra

Recorded profiles of the 9577 and 9632 Å absorption bands of  are shown in Figure 1. The 9577 Å feature is observed to be rather symmetric, while asymmetry is clearly seen in the shape of the 9632 Å band. The latter feature has been fitted with two Lorentzians with central wavelengths of 9632.6 and 9634.3 Å and FWHMs of 1.3 and 1.5 Å, respectively. The 9577 Å contour is reasonably reproduced with a single, slightly broader function with a FWHM of 1.7 Å.

Figure 1.
 photofragmentation spectra recorded by monitoring the attenuation of ions with m/z 724. Lorentzian fits to the experimental data (circles) are the solid lines. The 9577 Å band was fit with a single Lorentzian of central wavelength 9577.6 Å and FWHM 1.7 Å. Two Lorentzian profiles were used to fit the data around 9632 Å; only the cumulative fit is shown. These have central wavelengths of 9632.6 Å and 9634.3 Å, and FWHMs of 1.3 Å and 1.5 Å, respectively. The shown data were recorded with
  .
.
Download figure:
Standard image High-resolution imageThe origin of the asymmetry in the measured profile of the 9632 Å band is believed to arise as a result of the location of the helium atom adsorbed on the  cage structure, as synthesized in the low temperature trap. Leidlmair et al. (2012) reported that the strongest binding of a He is above a hexagon, with that above a pentagon being only slightly weaker. In recent theoretical work, Kaiser et al. (2018) showed that for
  the helium is delocalized over the many low energy binding sites (20 hexagons and 12 pentagons), with movement between sites attributed to kinetic energies that overcome small barriers or quantum tunneling. Furthermore, this work pointed out that the binding energies are slightly different for a helium atom bound to
  in the ground (
 ) and excited (
 ) electronic states. The predicted consequence is a 0.3 meV shift in the energies of the
  transition between the isomers
  and
and  . This theoretical result is in close agreement with the separation of the two Lorentzian profiles used to fit the data of the 9632 Å absorption. The differences in the helium binding energies between
  in the
  and
and  states is rationalized by changes to the charge density following this electronic transition. The calculations presented by Kaiser et al. (2018) indicate that upon excitation the electron redistribution occurs primarily on the outside of the carbon cage structure, with the effect of changing the strength of the interaction between
  and helium.
The 9577 Å profile, on the other hand, is more symmetric. It is important to note here that it is the same ensemble of  ions that interact with the laser. Under the assumption of D5d symmetry, the 9577 Å absorption band of
  is assigned to a different
  electronic transition, for which the upper state lies 60 cm−1 to higher energy than the state giving rise to the 9632 Å absorption (Figure 1 in Walker et al. 2017). The assignment of these two bands as transitions originating from a common lower state was made following attenuation experiments described in Campbell et al. (2015), where irradiation at the band maxima of the 9577 and 9632 Å absorptions led to near-complete attenuation in the number of
  complexes. An explanation for the differences between the profiles of the 9577 and 9632 Å bands of
  is due to the changes in the electron distribution for the two excited electronic states. For the 9577 Å absorption, the redistribution occurs predominately on the inside of the carbon cage structure, leading to smaller differences in the binding energies of the helium between the ground and excited electronic states (A. Kaiser 2017, private communication). This interpretation is also consistent with the widths of the absorption profiles presented in Figure 1, with the fit to the 9577 Å band giving a FWHM that is broader than either of the single profiles used in the 9632 Å region.
The isomeric effect on the 9632 and 9577 Å band shape has implications for the comparison between the laboratory and astronomical data. The conclusion from the above discussion is that the measured  profiles contain contributions from hexagonally and pentagonally bound isomers for which the transition energies lie closer together in the case of the 9577 Å feature than at 9632 Å. The implication is that the relative intensities of the
  band maxima may be somewhat perturbed from those of bare
  , indicating that caution is needed when applying a direct comparison of laboratory (based on
  ) and astronomical intensity ratios of bare
  .
.
The data shown in Figure 1 are consistent with the assumption that each  isomer contributes to the measured profiles with an intrinsic FWHM of 1.4 Å. For the 9632 Å absorption, the transition energies for hexagonally and pentagonally adsorbed helium atoms differ such that the peaks are separated by 1.7 Å. The shape and FHWM of the 9577 Å profile can be reproduced by two Lorentzians of the same relative strength with central wavelengths that are closer together. This is shown in Figure 2 where the separation is 0.9 Å. To estimate the perturbation on the intensities of the
  absorptions, the two isomeric components contributing to the profiles were set to the same central wavelength. The 9632:9577 ratio obtained by comparing the resulting single component features is 0.91, which is similar to the value of 0.85 that is obtained by directly taking the ratio of the intensities at band maxima for the shown
  data. This provides an indication that our experimental data are able to provide a reasonable approximation to the relative intensities in the spectrum of
  .
.
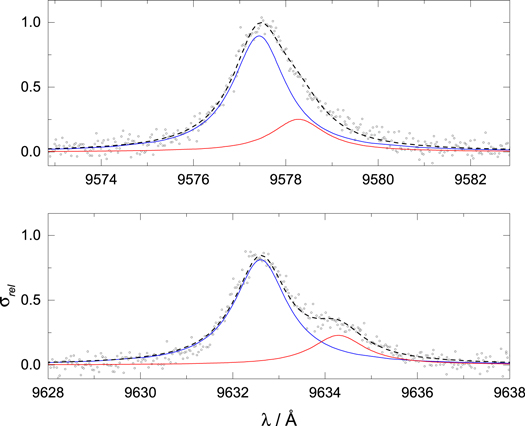
Figure 2.
 photofragmentation spectra recorded by monitoring the attenuation of ions with m/z 724. The cumulative profile of double Lorentzian fits to the experimental data (circles) are the dashed lines. The central wavelengths of the two profiles used to fit the 9577 Å band (top) are 9577.4 and 9578.3 Å. Those used to fit the 9632 Å absorption are 9632.6 and 9634.3 Å. The relative intensities of the blue and red curves are the same in both panels and all have FWHM of 1.4 Å.
Download figure:
Standard image High-resolution imageThis interpretation of the measured profiles, containing contributions from hexagonal and pentagonal bound isomers, provides an indication that the FWHM of the unperturbed  absorptions below 10 K may be narrower than the 2.2–2.5 Å value reported previously. In Campbell et al. (2015), the absorption bands were fit to single Gaussian profiles following the typical analysis of astronomical spectra. This gave rise to broader FWHM values than the 1.4 Å obtained here using two components. The expected FWHM of the
  rotational envelope below 10 K is about 1 Å, as estimated from the simulations shown in Edwards & Leach (1993). The broader widths of the laboratory bands are interpreted as due to a picosecond lifetime of the excited electronic state, caused by internal conversion. The internal temperature of
  is likely to be higher than 10 K in interstellar environments, and one expects a broadening of the DIB FWHM due to the unresolved rotational profile to 3 Å at 50 K and 4 Å at 100 K.
The  spectrum in the range of 9300–9640 Å, encompassing the five absorption features identified as DIBs, is shown in Figure 3. In our previous work, the profiles of each of these bands were measured individually and only estimated uncertainties for the relative intensities given, see Table 1 in Walker et al. (2017) and the discussion in Campbell et al. (2016a). In this report, the new homebuilt cw diode laser used eliminates the systematic uncertainties caused due to the reproducibility of the laser-ion cloud overlap and enables a more accurate determination of the relative intensities of the
  absorptions. The result listed in Table 1 for the two strongest absorption bands at 9577 and 9632 Å is in excellent agreement with the initial report (Campbell et al. 2015).

Figure 3.
 photofragmentation spectra recorded by monitoring the attenuation of ions with m/z 724. The experimental data (circles) have been fit with Lorentzian profiles, the cumulative result is the solid blue line.
Download figure:
Standard image High-resolution imageTable 1. Wavelengths and Relative Cross-sections Inferred from Laboratory Measurements
| λca/Å | σrelb |
|---|---|
| 9632.1 ± 0.2 | 0.84 |
| 9577.0 ± 0.2 | 1.00 |
| 9427.8 ± 0.2 | 0.17 |
| 9365.2 ± 0.2 | 0.26 |
| 9348.4 ± 0.2 | 0.09 |
Notes.
aExtrapolated wavelengths taken from Campbell et al. (2016b).
bσrel at the band maxima in the measured
wavelengths taken from Campbell et al. (2016b).
bσrel at the band maxima in the measured  spectrum. The influence of isomers on the band profiles indicates that caution is needed when comparing with astronomical observations (see the text).
Download table as: ASCIITypeset image
In the context of comparison with astronomical spectra, an important observation is that the relative intensity of the 9428 Å absorption is weaker than previously estimated from data recorded using a 22-pole ion trap (Campbell et al. 2015; Walker et al. 2017). The more accurate data presented here in Figure 3 indicate an intensity ratio 9365:9428 of ∼1.6:1. The relative strength inferred from these measurements on  appears to give better agreement with astronomical data. For example, observations toward HD 46711 indicate that DIB 9428 is weaker than 9365 (Walker et al. 2017), with this result also being consistent with recent Hubble spectra of the line of sight toward BD +63 1964 (Cordiner et al. 2017). The wavelength region around 9428 Å is clearly the most problematic in terms of telluric contamination, leading to considerable uncertainty in determining the strength of this interstellar band by the reduction of data recorded using ground-based telescopes. Space-based observations of suitable targets may be able to confidently determine the strength of this interstellar absorption. For a recent discussion of the evaluation of observational data see Lallement et al. (2018).
3.2. 13C Isotopic Substitution
The 9577 Å absorption band of  and
and  was recorded by monitoring the attenuation of ions with m/z = 724 and 725 u/e, respectively, and is presented in Figure 4. This feature is understood to be the origin band of
  electronic transition in D5d symmetry
  . The wavelengths of absorption maxima of the
  and
and  data shown lie within the uncertainties of the two and indicate that the changes to the zero-point energies are small upon replacement of one of sixty 12C atoms by a 13C. Note that 13C substitution may also lead to different
  isotopomers. A discussion of D5d symmetry
  was given recently by Yamada et al. (2017).

Figure 4.
 (red) and
  (blue) photofragmentation spectra recorded by monitoring the attenuation of ions with m/z 724 and 725, respectively. Lorentzian fits to the experimental data (circles) are the solid lines. The vertical dashed lines indicate the central wavelengths of these fits.
Download figure:
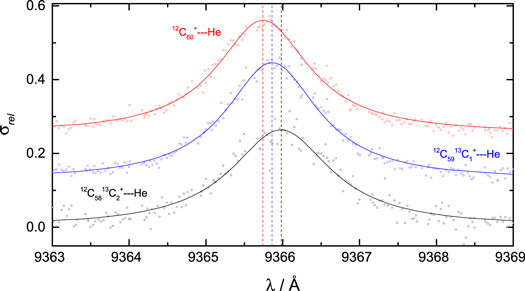
Standard image High-resolution imageThe 9365 Å absorption band of  ,
,  , and
, and  is shown in Figure 5. Fits to the data using a Lorentzian function yield band maxima at 9365.7, 9365.9, and 9366.0 Å, respectively. Unlike the origin band, the effect of isotopic substitution (redshift) is visible in these spectra. But note that this effect is much smaller than the 0.7 Å wavelength shift between the spectrum of
  and
and  . This feature is believed to arise due to the
  transition. The energy separation from the band origin, Δ = 236 cm−1, is consistent with the excitation of a low-frequency vibrational mode of
  in the upper electronic state.
Figure 5.
 (red) and
  (blue) and
  (black) photofragmentation spectra recorded by monitoring the attenuation of ions with m/z 724, 725, and 726, respectively. Lorentzian fits to the experimental data (circles) are the solid lines. The vertical dashed lines indicate the central wavelengths of these fits.
Download figure:
Standard image High-resolution image
The effect of isotopic substitution on the infrared and Raman spectra of neutral, icosohedral C60 was previously observed. Perturbation theory was used to interpret the Raman spectrum of a 13C isotopically enriched sample of C60 in a frozen solution of CS2 at 30 K. This was reported by Guha et al. (1994) who recorded spectra in the region around the "pentagonal pinch" mode, which has Ag(2) symmetry in Ih and an energy of about 1470 cm−1. The model predicts that for totally symmetric Ag vibrations, the first-order correction to the frequency for C60 containing  nuclei is given by
  , independent of the relative positions of the 13C atoms. Their Figure 1 shows three resolved peaks separated in energy by 1 cm−1, in agreement with the predicted frequencies for 12C60,
  and
and  .
.
Our data on the cation  shown in Figure 5 also appear to be in agreement with the predictions of perturbation theory. This is perhaps not surprising as the Jahn–Teller distortion from Ih symmetry is expected to be small for this rigid molecule. The 236 cm−1 mode in D5d is assigned as A1g (Fulara et al. 1993). Using the above formula, one expects a redshift of 0.3 cm−1 on going from
  to
to  , in accord with the experimental observations. The small differences in central wavelengths between the overlapping absorptions of
  ,
,  and
and  indicate that the isotopic effect on the bands shown in Figure 3 should be minor in observational data, especially considering other broadening factors that affect astronomical spectra. For bands that involve excitation of higher frequency vibrations in the upper electronic state, such as those shown in the top panel of Figure 3 in Campbell et al. (2016a), a larger isotopic wavelength shift is expected; however, such features will be difficult to detect in interstellar spectra due to their strength.
4. Conclusion
High-quality gas-phase measurements of the near-infrared electronic absorptions of  are reported. This provides the most accurate laboratory data on the profiles and intensities of these features reported until now. The influence of 13C isotopic substitution on the electronic spectrum has been evaluated experimentally, giving rise to a measurable vibrational isotope shift in the wavelength of the 9365 Å band, while the wavelength of the origin band 9577 Å is relatively unaffected within the uncertainties of these measurements. The data presented in this article should aid future telluric-free astronomical observations.