


Abstract
We present the discovery of 1568 RR Lyrae stars in three of the most luminous M31 satellites: And VII (573), NGC 147 (177), and NGC 185 (818). We use their properties to study the formation history of Local Group spiral haloes, and in particular, to infer about the nature of their possible building blocks by comparison with available data for RR Lyrae stars in the halo and in a sample of satellites of M31 and the Milky Way. We find that the brightest satellites and the halos of both galaxies host a number of High Amplitude Short Period (HASP) RR Lyrae variable stars, which are missing in the faintest satellites. HASP variable stars have been shown by Fiorentino et al. to be tracers of a population of stars as metal-rich as [Fe/H] ≃ −1.5 and older than  . This suggests that the metal-rich M31 and MW halo component, which manifests through the HASP phenomenon, comes from massive dwarf galaxy building blocks, as the low-mass dwarfs did not chemically enrich fast enough to produce them. All detected variable stars are new discoveries; in particular, this work presents the first detections of RR Lyrae stars in And VII. Moreover, a number of candidate Anomalous Cepheids, and binary and long-period variable stars have been detected. We provide pulsation properties (period, amplitude, mean magnitude), light curves, and time series photometry for all of the variable stars in the three galaxies.
Export citation and abstract BibTeX RIS
1. Introduction
One of the pillars of modern cosmology is the prediction that galaxies as we observe them today are the result of a merging process (White & Rees 1978). As this scenario was proposed for the Galaxy (Searle & Zinn 1978), the idea that the present-day dwarf galaxies are the survivors of such an accretion history started to be investigated, and this triggered a huge observational effort to characterize the nearby dwarf galaxies in the Local Group (LG). When it became possible to collect medium- and high-resolution spectroscopic data for a large number of stars in the Milky Way (MW) satellites (e.g., Shetrone et al. 1998; Bonifacio et al. 2000; Tolstoy et al. 2001), it became clear that their chemical patterns were systematically different from those of the MW halo (Tolstoy et al. 2003). This strongly suggested that stellar systems similar to present-day dwarf galaxies were unlikely its building blocks. The drawback of this approach is that while the properties of the halo stellar populations got frozen at an early time in their accretion, LG dwarfs had at their disposal many gigayears of independent evolution, until today.
Using purely old populations as tracers allows a more meaningful comparison in order to understand the mechanism(s) of halo formation. This is possible through a comparative study of the properties of RR Lyrae stars (RRL). They are considered the best tracers of old stellar populations (>10 Gyr), as they are the progeny of the stars that formed when the host galaxies were only few gigayears old, thus tracing their properties back then.
In recent years, different surveys have provided the properties of a large number of MW field RRL stars (QUEST: Vivas et al. 2004; Zinn et al. 2014; ASAS: Szczygieł et al. 2009; CATALINA: Drake et al. 2013). Moreover, RRL stars have been detected in all galaxies where they have been searched for (except possibly some of the lowest mass MW satellites), within (e.g., Dolphin et al. 2001; Bersier & Wood 2002; Kinemuchi et al. 2008; Bernard et al. 2009; Coppola et al. 2015) and outside the LG (Da Costa et al. 2010). In a previous work (Fiorentino et al. 2015, hereafter F15), we have shown how a systematic search with highly complete samples of RRL stars in nearby galaxies allowed us to infer strong constraints on the stellar mass assembly of the MW halo.
In this paper, we present a similar comparative study of the RRL stars in the M31 halo with the RRL stars of the M31 satellites. In addition to using literature values, we introduce here a new study of the RRL population in And VII, NGC 185, and NGC 147. Table 1 summarizes the main properties of the three systems. And VII is the most luminous dSph companion of M31 (MV = −13.3; McConnachie & Irwin 2006), but few investigations have focused on its stellar content. Using medium resolution Keck/DEIMOS spectra of RGB stars, Vargas et al. (2014) estimated a mean metal content of [Fe/H] = −1.24 ± 0.12 by directly measuring the strength of the Fe lines. Later, Ho et al. (2015) presented a broad metallicity distribution function extending from [Fe/H] ≈ −3.5 to super-solar, based on Ca triplet lines of similarly bright RGB stars. The deepest published color–magnitude diagram (CMD) is the one in Weisz et al. (2014), based on shallow WFPC2 images barely reaching the horizontal branch (HB).
Table 1. Summary of the Main Properties of the Three Galaxies
| Galaxy | And VII | NGC 185 | NGC 147 |
|---|---|---|---|
| R.A. | 23 26 31.7 | 00 38 58.0 | 00 33 12.1 |
| Decl. | +50 40 33 | +48 20 15 | +48 30 32 |
| (m − M)0[mag] | 24.41 ± 0.10 | 23.95 ± 0.09 | 24.15 ± 0.09 |
| MV [mag] | −12.6 | −14.8 | −14.6 |
| E(B – V) | 0.194 | 0.184 | 0.172 |
![$\langle [\mathrm{Fe}/{\rm{H}}]\rangle $](https://content.cld.iop.org/journals/0004-637X/842/1/60/revision1/apjaa738dieqn2.gif)
|
−1.4 ± 0.3 | −1.3 ± 0.1 | −1.1 ± 0.1 |
Download table as: ASCIITypeset image
NGC 185 and NGC 147 are among the brightest M31 satellites (MV = −15.41 and −15.33, respectively; Crnojević et al. 2014), at the edge between dSph and dE galaxies. Based on deep CMDs reaching below the old main sequence turnoff, Geha et al. (2015) found that NGC 185 has a predominantly old population, while the mean age of NGC 147 is significantly younger, by 4–5 Gyr. Based on CaT spectra, Ho et al. (2015) report that the mean metallicity of NGC 147 ([Fe/H] = −0.5 ± 0.1) is significantly higher than that of NGC 185 ([Fe/H] = −1.0 ± 0.1). Moreover, NGC 185 presents a strong radial metallicity gradient not detected in NGC 147 (Crnojević et al. 2014). The pioneering works by Saha & Hoessel (1990) and Saha et al. (1990) first claimed the discovery of RRL stars in both galaxies, later revised by Yang & Sarajedini (2010) in the case of NGC 147.
2. Observations and Data Analysis
The data analyzed in this work consist of archival HST images from two different GO proposals: GO 10430 (And VII, PI Armandroff) and GO 11724 (NGC 185 and NGC 147, PI Geha). Detailed observing logs are available in Appendix A. In the following, we will explain the main features of the observing strategy of each data set.
And VII—The central regions of And VII were observed using the ACS camera in 2006 June. The observations span 1.29 days, and 32 and 16 images were collected in the F435W and F555W filters, respectively. The observing strategy was such that two groups of eight images in the F555W filter were observed before and after the full set of the F435W images. In particular, the latter cover 1.02 days. All of the individual images had exposure times of 600 s.
NGC 147—Two off-center fields in NGC 147 were observed with the ACS and the WFC3 cameras in the F606W and F814W filters. As short exposures were not included in our study, the individual exposure times ranged from 1243 and 1543 s. The ACS (WFC3) fields are located at 8 6 (127) from its center (Geha et al. 2015), corresponding to 1.3 (1.8) effective radii. The observations of NGC 147 were executed between 2009 November 21 and December 2. In particular, all the F606W images were collected first, providing a coverage of 2.68 days, followed, after a gap of 2.2 days, by all the F814W exposures (6.2 day non-continuous coverage). The total number of phase points used in this work are 24 and 32 in F606W and F814W, respectively, for both cameras.9
NGC 185—The observing strategy used for NGC 185 was similar to that adopted for NGC 147, and based on the same instruments, filters, and exposure times. The ACS and WFC3 fields are located at 66 and 101 from the center of NGC 185, corresponding to 2.5 and 3.5 effective radii, respectively. The observations of NGC 185 were executed between 2010 January 14 and February 5, and therefore the time baseline is longer than in the case of NGC 147, as it spans 22.2 days. Moreover, the time sampling is rather different. The F606W exposures were collected in five groups of four images. Each group covers ≈2.7 hr and the groups are separated by 1.6, 7.0, 11.5, and 1.92 days. With the exception of two images (collected with the second group of F606W data), all the F814W data have been observed with continuous coverage for 0.9 days, after collecting half of the F606W data. The total number of images is 20 and 26 in the F606W and F814W bands, respectively, with both cameras.
2.1. Photometric Reduction
The data reduction was performed homogeneously for the three galaxies. Following Monelli et al. (2010), we adopted the original  images provided by the HST calibration On-The-Fly-Reprocessing pipeline (CALACS v.8.3.3) rather than the processed drizzled ones. Consequently, the pixel-area mask had to be applied to each image in order to compensate for the different area of sky projected on individual pixels. Photometric reduction was performed using the DAOPHOTIV/ALLFRAME package (Stetson 1994), basically following the prescriptions of Monelli et al. (2010). Photometric calibration was performed using the standard recipe provided by the instrument Web page and updated zero points.10
2.2. Variable Star Detection and Characterization
Variable star candidates were selected by means of a modified version of the Welch–Stetson variability index (Welch & Stetson 1993). Their light curves were individually inspected, and 590, 188, and 826 stars turned out to be real variable stars in And VII, NGC 147, and NGC 185, respectively. All of them are new discoveries. The pulsational properties were determined using the procedure described in Bernard et al. (2009). In summary, a widget-based software allowed us to first estimate the period of candidate variables through Fourier analysis of the time series, following the prescription of Horne & Baliunas (1986). The analysis is refined by visual inspection of the light curves in both bands simultaneously in order to fine-tune the period. Amplitudes are then estimated by fitting to a set of light-curve templates (Layden et al. 1999).
The vast majority of them are RRL stars, though a few ACs, long-period variables, and binary stars were also found. A summary of the discovered RRL stars is presented in Table 2, while the remaining different candidates detected will be presented in Appendix C. We provide the full set of light curves, and the mean properties and time series are available in Appendix B. The variables detected in this work were named with a prefix, which refers to the galaxy ("AndVII," "NGC 147," or "NGC185"), and a suffix, which indicates whether the star is a variable ("V"), together with a number that increases with increasing R.A.
Table 2. Subgroups of RRL Stars Detected in the Three Galaxies
| And VII | NGC 185 | NGC 147 | Total | ||
|---|---|---|---|---|---|
| ACS | 386 | 428 | 103 | 917 | |
| RRab | WFC3 | ⋯ | 116 | 15 | 131 |
| Total | 386 | 544 | 118 | 1048 | |
| ACS | 181 | 232 | 48 | 461 | |
| RRc | WFC3 | ⋯ | 42 | 10 | 52 |
| Total | 181 | 272 | 58 | 511 | |
| ACS | 6 | 2 | 1 | 9 | |
| RRd | WFC3 | ⋯ | 0 | 0 | 0 |
| Total | 6 | 2 | 1 | 9 | |
| TOTALACS | 573 | 660 | 152 | 1385 | |
| TOTALWFC3 | ⋯ | 158 | 25 | 183 | |
| TOTAL | 573 | 818 | 177 | 1568 | |
Download table as: ASCIITypeset image
Table 3. Log of the Observations
| Image Name | Filter | Exp. Time | Date | MJD |
|---|---|---|---|---|
| (s) | (UT start) | d-2,400,000 | ||
| And VII | ||||
| j96301hcq | F555W | 600.0 | 2006 Jun 16 17:50:33 | 53902.74343780 |
| j96301hdq | F555W | 600.0 | 2006 Jun 16 18:02:49 | 53902.75195632 |
| j96301hfq | F555W | 600.0 | 2006 Jun 16 18:15:25 | 53902.76070632 |
| j96301hhq | F555W | 600.0 | 2006 Jun 16 18:27:41 | 53902.76922483 |
| j96301hjq | F555W | 600.0 | 2006 Jun 16 19:15:51 | 53902.80267372 |
Only a portion of this table is shown here to demonstrate its form and content. A machine-readable version of the full table is available.
Download table as: DataTypeset image
3. RR Lyrae Stars
3.1. And VII
Figure 1 presents the (F555W, F435W–F555W) color–magnitude diagram (CMD) of And VII. The photometry reaches ∼2 mag below the HB, meaning that this is to date the deepest CMD available for this galaxy. The most prominent evolutionary features are the red giant branch (RGB) and the HB. The RGB presents a significant color spread at any luminosity, suggesting a large metallicity spread. This is consistent with spectroscopic determinations based on bright RGB stars (Kalirai et al. 2010; Ho et al. 2015). The HB has a predominantly red morphology, even though a well-populated tail reaches F435W–F555W ∼ 0 mag. The spur of stars fainter than the HB is probably populated by blue stragglers (BSs). All of the detected variables are overplotted on the CMD: 573 RRL stars (386 RRab + 187 RRcd type stars), 7 suspected ACs, and 8 variable sources for which it is not possible to determine the pulsational properties on the basis of the current data.
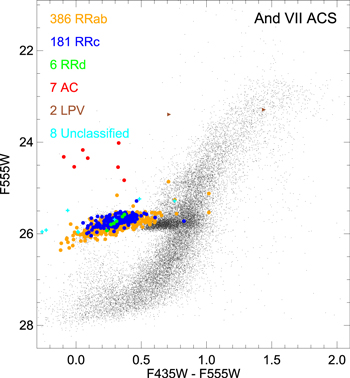
Figure 1. (F555W, F435W–F555W) color–magnitude diagram for the ∼53,000 stars detected in And VII. The discovered variable stars are marked with different colors: RRab (orange), RRc (blue open circles), RRd (green), ACs (red dots), LPV candidates (brown triangles), and unclassified ones (cyan crosses).
Download figure:
Standard image High-resolution imageThe population of RRL stars in the CMD presents a very broad color distribution. In particular, there is no clear color separation between the RRab and RRc types, as one would expect. To understand this occurrence, we show in Figure 2 six selected light curves. Gray and black symbols show the individual points in the F435W and F555W filters, respectively (for the sake of clarity shifted by +0.4 mag and −0.4 mag, respectively). The top row plot shows three cases in which the data in the two bands resulted in a good estimation of the period. This is especially true whenever the maximum light is well sampled. Nevertheless, while the ∼0.9 days of continuous monitoring in the F435W filter provide in most cases a good phase sampling of the light curve in this band, this is not the case in F555W. As a consequence of this, the mean magnitude and amplitude in theF555W band will be affected, despite the fact that the period is well constrained. Given the asymmetric shape of the light curves, this effect is expected to be larger for the RRab type than for the RRc-type stars. The bottom panels show selected worse cases in which the points in F555W do not fill properly the phase cycle of the variable star. However, in some cases (such as And VII–V075; see the bottom right-hand panel of Figure 2), the limited phase coverage of the F555W band is very useful to constrain the period, as it samples the region of maximum light.
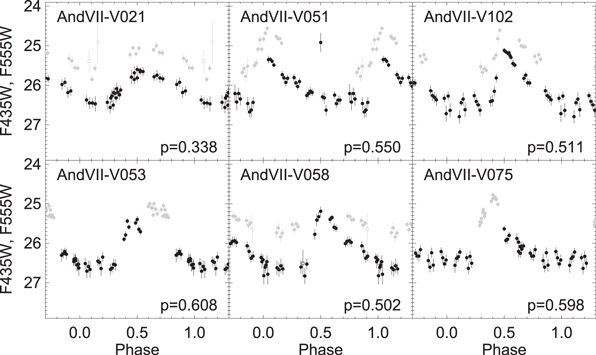
Figure 2. Example of light curves of RRL stars in And VII for the F435W (black) and F555W bands (gray). For the sake of clarity, the former have been shifted by +0.4 mag while the latter were moved by −0.4 mag. Open symbols show the data points for which the errors are larger than 3σ above the mean error of a given star (data not used in the pulsation property determinations). Periods are given in days. The top row shows three cases in which, despite the good agreement between the light curves in the two filters, the scarce phase sampling in F555W suggests that the mean magnitude and the amplitude in this filter may be affected. The bottom row shows even worse cases in which, in spite of well-sampled F435W light curves, the light curves in the F555W are very poorly constrained. However, in some cases (such as AndVII–V075), the use of the F555W band is very useful in the period determination, as the F555W points complement the lack of a maximum in the F435W light curves.
Download figure:
Standard image High-resolution imageTo further investigate this fact, Figure 3 shows the period–amplitude (Bailey) diagram for the And VII RRL stars. In particular, we show the amplitude as a function of the logarithm of the period in F435W (AF435W) and in F555W (AF555W) in the left and central panels, respectively. The distribution of points in the second diagram presents a larger number of outliers at high amplitude, and a less clear separation between RRab and RRc around log P ≈ −0.4 and low amplitude. The right panel of Figure 3 shows the distribution of the ratios between the amplitude in the two bands for the RRab stars of And VII. Despite the fact that the distribution peaks at the expected value of 1.3 (di Criscienzo et al. 2011), a large number of outliers is present. This suggests that while the majority of stars have well-constrained amplitude in both bands, for some the measurements are not reliable. Given the much poorer time sampling of the F555W data with respect to the F435W ones, we conclude that the amplitudes in F435W are more solid than in F555W.

Figure 3. Left: Bailey diagram for RRL stars in And VII. The amplitude in the F435W filter,  , vs. the logarithm of the period is shown. Center: same as the left panel, but for the
  filter. Right: distribution of the ratio between the amplitudes in the two bands. The peak occurs at the expected value of 1.3 (di Criscienzo et al. 2011), but a significant number of stars have their amplitude in F555W underestimated.
Download figure:
Standard image High-resolution image3.2. NGC 147 and NGC 185
Figure 4 presents the CMD of the two galaxies and the variable stars detected (NGC 185: top panels; NGC 147: bottom panels). Moreover, in addition to the ACS CMDs (left), we present for the first time the CMD obtained from the parallel WFC3 fields. Both ACS CMDs contain of the order of 40,000 stars. Overall, the photometry is significantly deeper than in the case of And VII, mostly thanks to the fact that the individual exposure times were at least a factor of two larger. Notably, the depth of the WFC3 data is comparable to that of ACS ones, just a few tenths of magnitude shallower. The discovered variables are shown with the same symbols and color code as in Figure 1. In total, 818 and 177 RRL stars have been discovered in NGC 185 and NGC 147, respectively, together with a handful of other suspected candidate variable stars (see Appendix C).
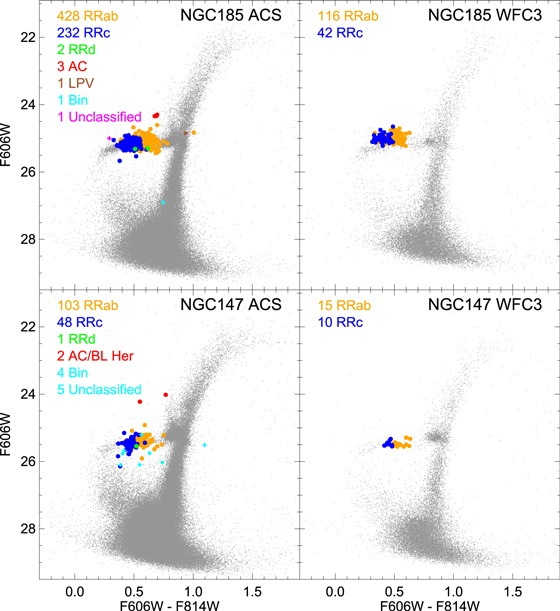
Figure 4. (F606W, F606W–F814W) CMDs for NGC 185 (top panels) and NGC 147 (bottom panels). Left and right columns present the ACS and the WFC3 CMDs, respectively. Variable stars are shown with the same symbol and color codes as in Figure 1.
Download figure:
Standard image High-resolution imageThe four CMDs show in this case a much better defined separation between RRab and RRc stars, with the former typically redder than the latter. This suggests that the recovered pulsational parameters are well determined for both galaxies. Nevertheless, the time sampling of the observations, which is not optimized to search for short-period variables such as RRL stars, is prone to a subtle aliasing effect which would require more observations to be removed.
4. Bailey Diagrams and High Amplitude Short Period (HASP) Stars
Figure 5 presents the period–amplitude (Bailey) diagram for the RRL stars in the three galaxies. Following the discussion in Section 3.1, in the case of And VII, we convert the better constrained amplitude  to
to  by applying the factor 1/1.3, and assume that the
  filter is equivalent to AV. To test this hypothesis, we used synthetic light curves from Marconi et al. (2015) and verified than the amplitude in the two photometric systems typically changes only by 0.01–0.02 mag. In the case of NGC 147 and NGC 185, the F606W amplitude was rescaled using a factor equal to 1.09 (Brown et al. 2004; Fiorentino et al. 2010). For the three galaxies, the RRab- and RRc-type sequences are well defined, with very few interlopers at low amplitude, which are possibly double-mode pulsators. The well-populated sequence of first overtones in And VII and NGC 185 follows the well-known bell-shape sequence. The sequence of fundamental pulsators presents a considerable period spread, at fixed amplitude. In the case of NGC 185, two sequences are visible. Such dichotomic distribution is not present either in And VII or in NGC 147. Moreover, we note that the period–amplitude distribution in And VII is missing stars in the low-amplitude tail of the RRab-type stars. Interestingly, this does not seem to be an observational bias, since RRc-type stars with amplitude smaller than 0.3 mag have been detected.

Figure 5. Period–amplitude diagrams (or Bailey diagram) for the RRL stars in the three galaxies. We converted the  amplitudes to V using the scaling factor 0.77, while the
  amplitudes were increased by a factor of 1.09 (see text for details). The shaded area marks the HASP region. A sample of HASP RRL stars is present in each of the three galaxies. The blue lines represent the location of the Oosterhoff I and Oosterhoff II globular cluster (Cacciari et al. 2005).
Download figure:
Standard image High-resolution imageA comparison with the loci of Oosterhoff I (Oo-I) and II (Oo-II), as defined for globular clusters (GCs), is shown by the blue dashed lines (Cacciari et al. 2005). By defining a third, intermediate relation between the RRab Oo-I and Oo-II curves, we can estimate the fraction of Oo-I-like and Oo-II-like stars as those stars standing below and above the new relation, respectively. This provides a fraction of 75%, 70%, and 63% of Oo-I-like stars in And VII, NGC 147, and NGC 185, respectively. The mean period of the full samples of RRab stars in the three galaxies is similar: 0.578 ± 0.004 days (σ = 0.065 days) for And VII, 0.589 ± 0.008 days (σ = 0.090 days) for NGC 147, and 0.587 ± 0.007 days (σ = 0.086 days) for NGC 185, respectively. This would suggest classification as an Oosteroff-intermediate type, though the period in other dwarf galaxies is closer to 0.6 days or higher (see, e.g., Sculptor, Martínez-Vázquez et al. 2016b; Leo I, Stetson et al. 2014b). Moreover, the mean period of the RRab stars does not correlate with the fraction of either group of Oo stars. Finally, we note that the fraction of RRc types over the total number of RRL stars is of the order of 0.3 for the three galaxies, and therefore intermediate between the Oosterhoff types. All of these suggest that the Oosterhoff classification of galaxies based only on the mean period of fundamental pulsators can be misleading (see also the case of Tucana and Sculptor; Martínez-Vázquez et al. 2016b) and does not provide any useful information about the early evolution of the host system.
Following F15, the gray shaded area in Figure 5 shows the adopted definition of HASP RRLs (defined as those RRab stars with period P < 0.48 days and amplitude in the V band  ). Clearly, the three galaxies host a sizable number of them. In particular, 12, 7, and 48 HASP RRLs have been detected, corresponding to 3.1%, 5.9%, and 8.8% of the total number of RRab stars in And VII, NGC 147, and NGC 185, respectively. We stress that the definition of HASP is fundamentally based on the period, and the cut in amplitude helps in removing the contamination of low-amplitude first overtones or double pulsators. This means that, in the case of And VII, the HASP identification provides the same results assuming either F435W or F555W
Figures 6–8(d) present the light curves of the HASP stars in And VII, NGC 147, and NGC 185, respectively. The plots show well-defined light curves for the vast majority of HASP stars in NGC 185 and NGC 147. In particular, they are well sampled in phase and cover the maximum light region in most cases. In the case of And VII, the combination of inappropriate sampling and large photometric errors affect the quality of the light curves, but nonetheless, the agreement between the two filters supports the reliability of our determination of pulsation properties.
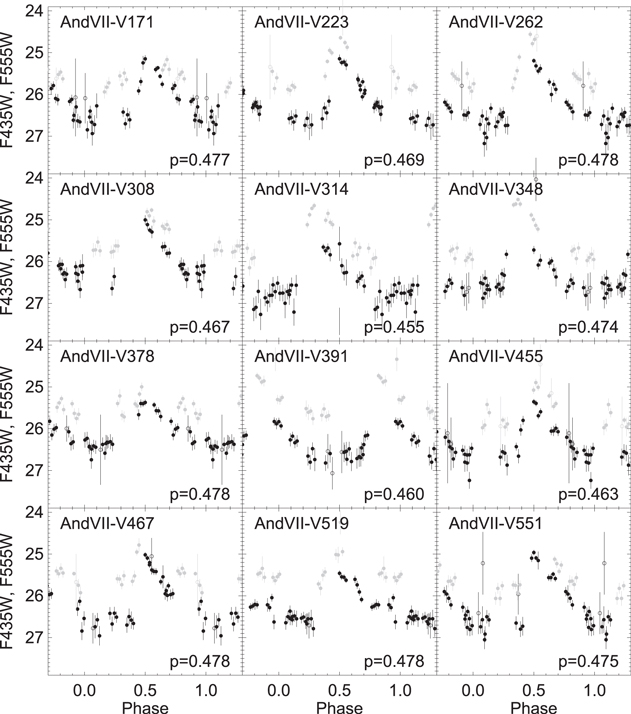
Figure 6.
Light curve of HASP stars in And VII. Stars are named in order of increasing R.A. Gray and black symbols show the individual F435W and F555W points, respectively. For the sake of clarity, the former have been shifted by +0.4 mag while the latter were moved by −0.4 mag. Open symbols show the data points for which the errors are larger than 3σ above the mean error of a given star (data not used in the pulsation properties determinations). Periods are given in days. The other RRL stars in And VII are shown in the figure set. (The complete figure set (39 images) is available.)
Download figure:
Standard image High-resolution image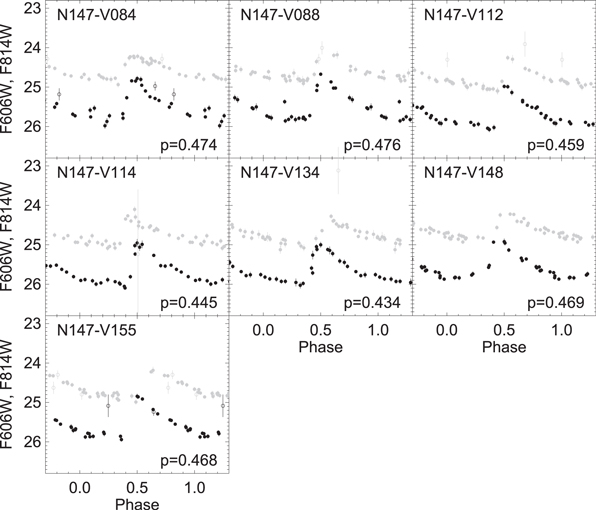
Figure 7.
Same as Figure 6, but for the full sample of HASP RRL stars in NGC 147. The other RRL stars in NGC 147 are shown in the figure set. (The complete figure set (12 images) is available.)
Download figure:
Standard image High-resolution image
Download figure:
Standard image High-resolution image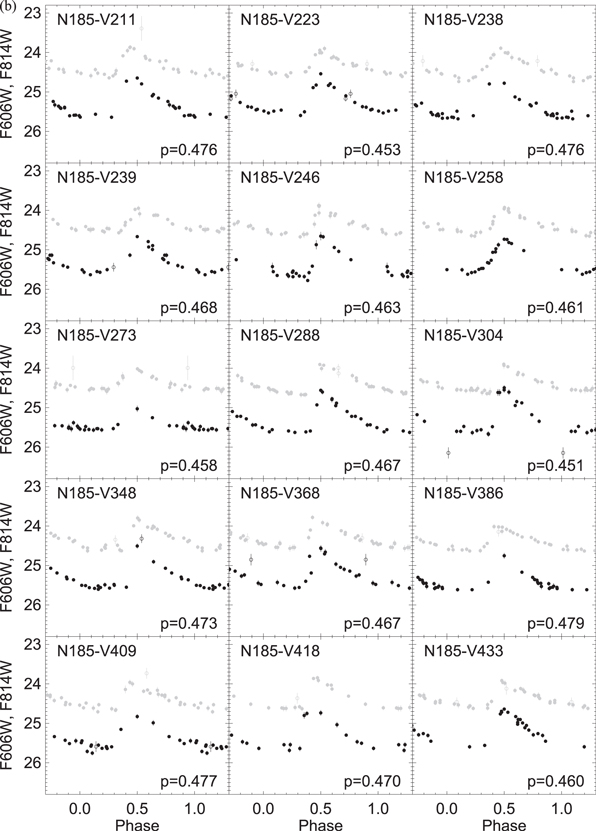
Download figure:
Standard image High-resolution image
Download figure:
Standard image High-resolution image
Figure 8.
(a) Same as Figure 6, but for 15 out of the 48 HASP stars in NGC 185. The other RRL stars in NGC 185 are shown in the figure set. (b) The next 15 HASP stars in NGC 185. (c) The next 15 HASP stars in NGC 185. (d) The final three HASP stars in NGC 185. (The complete figure set (55 images) is available.)
Download figure:
Standard image High-resolution imageFigure 9 shows the CMD of the three galaxies zoomed-in on the HB region. Orange and black symbols show the location of the RRab- and RRc-type stars, respectively. Red circles indicate the position of the HASP stars. Interestingly, in most cases they are located within the bulk of the RRL stars, again supporting our determination of the pulsation parameters. In the case of NGC 185 and NGC 147, where the HASP stars have well-constrained mean magnitudes, they are preferentially located at the blue edge of the color distribution of RRab stars, as expected for the shortest-period RRab-type stars.

Figure 9. Zoom-in on the CMD region of the HB of And VII (left), NGC 185 (center), and NGC 147 (right). Orange and black symbols show the RRab- and RRc-type stars, respectively. Red circles mark the position of the HASP stars.
Download figure:
Standard image High-resolution image5. The Building Blocks of the M31 Halo
In Stetson et al. (2014a), F15, and Fiorentino et al. (2017), we provided the first examples of comparative analysis of RRL populations in different stellar systems based on the detailed properties of the period distribution rather than based only on the mean properties of RRL stars. This allowed us to detect systematic differences between the populations of RRL stars in the MW halo, GCs, and dwarf galaxies. In particular, F15 showed that HASP RRL stars are present in the halo and GCs more metal-rich than [Fe/H] ≈ −1.5. This strongly suggests that part of the stellar systems that accreted onto the MW halo were already at least as metal-rich as [Fe/H] = −1.5. On the other hand, the HASP component seems to be typically absent in dwarf galaxies, with the exception of the most massive ones, such as Sagittarius and the Magellanic Clouds. This implies that only the most massive dwarfs were able to self-enrich at an early epoch and in a timescale short enough to produce today's HASP RRL stars. Consequently, F15 suggested that a large fraction of the MW halo was formed by massive dwarfs.
Figure 10 compares the Bailey diagram and period distributions of RRL stars in the M31 and MW halos, and in their satellite systems. In particular, the figure includes the following data sets (the number labeled in the plot indicates the total number of RRLs, while the number in the following list refers to RRab only, used later in the analysis):11
- 1.Panel (a) M31 halo: five ACS fields from Jeffery et al. (2011, 108 stars) and Field 2 from Sarajedini et al. (2009, 387 stars). Their Field 1 was not included given the proximity to M32. All these fields are located in the distance range between 4 and 35 kpc from the M31 center, and therefore belong to the inner halo of M31 (Ferguson & Mackey 2016; d < 50 kpc);
- 2.(b) MW halo: same collection as in F15, selecting stars in the inner halo and adopting the same cut in distance from the MW center, d < 16 kpc;
- 3.(c) M31 bright satellites: dwarfs with
 −12, namely the data presented here, plus data for M32: (Fiorentino et al. 2012, 314 stars) and And II, from the compilation of C. E. Martínez-Vázquez et al. (2017, in preparation, 253 stars);
 - 4.
- 5.(e) M31 faint satellites: And I, And III, And XV, And XVI, and And XXVIII from C. E. Martínez-Vázquez et al. (2017, in preparation, 649 stars in total12 ), And VI (Pritzl et al. 2002, 110 stars), And XI and And XIII (Yang et al. 2014, 15 and 9 stars, respectively), And XIX (Cusano et al. 2013, 31 stars), And XXI (Cusano et al. 2015, 41 stars), and And XXV (Cusano et al. 2016, 57 stars) observed with the Large Binocular Telescope;
- 6.


Figure 10. Comparison of the Bailey diagram of different samples of RRL stars belonging to the inner halos of M31 (left) and the Milky Way (right), and to a number of satellite dwarf galaxies. From top to bottom: panels (a) and (b) show the case of the available RRL stars in the halo of both spirals; panels (c) and (d) show the system of bright satellites; and panels (e) and (f) present the faint satellites of both systems. The number indicates the total number of RRLs in each panel. Panels (g) and (h) illustrate the period histogram of the sample shown above.
Download figure:
Standard image High-resolution imageOverall, the Bailey diagram of the MW and M31 halos (panels (a) and (b)) are globally very similar, despite the very different sample size. In particular, both distributions present a wide period range, at fixed amplitude, covering both the Oo-I and Oo-II loci. We estimate the fraction of Oo-I-like and Oo-II-like stars as described in Section 4, and we find values of the former of 75% and 67% in the case of the M31 and MW halos, respectively. Moreover, both samples seem to suffer from similar incompleteness at the lowest amplitudes, as suggested by the few variables with amplitude <0.4 mag. This is known in the case of the MW sample, as discussed in F15. HASP stars are present in both samples in a sizable group, and the tail at the shortest-period RRab-type stars reaches log P ∼ −0.4, implying that the metallicity distribution of M31 halo stars at the observed locations extends to values well above [Fe/H] = −1.5.
Panels (c) and (d) compare the bright satellites ( ) of the two spirals. Again, interesting similarities show up. First, the large period spread and the clear bimodality around the two Oosterhoff types can be clearly noticed. In this case, the fraction of Oo-I and Oo-II stars are 70%/30% and 72%/28% for the M31 and MW satellites, respectively. Second, the HASP region is well populated in the RRL sample compiled from the bright satellites. When moving to fainter dwarfs (panels (e) and (f)), this region is largely depleted of stars, with very few exceptions (these have been discussed in detail in Fiorentino et al. 2017). The definition of HASP at P = 0.48 days was empirically set by F15 to quantify the difference in the period distribution of the MW satellites with respect of the GCs and the MW halo distributions. The fact that few faint M31 satellites host a handful of HASPs, typically with periods very close to this arbitrary limit, suggests that the underlying metallicity distribution is similar among them and compared to MW satellites of similar size.
Panels (g) and (h) compare the normalized period histogram of the various samples of RRab stars. For both M31 and the MW, the period distribution of bright satellites is strikingly similar to that of the corresponding spiral halo, despite the reduced number of M31 halo RRLs known to date. Conversely, the period distribution of low-mass systems is lacking the short-period tail of the RRab-type stars. It is very unlikely that this is an observational bias, as the shortest-period stars are expected to have the largest amplitudes. Figure 11 show the cumulative period distributions of the six different samples. Solid and dashed lines refer to the M31 and MW samples, respectively, while black, orange, and blue colors refer to the halo, bright satellite, and faint satellite stars. The figure clearly shows that the cumulative distributions of the MW bright and faint satellites are very similar to the corresponding M31 counterpart. The distribution of the MW halo stars is strikingly similar to that of the MW bright satellites, and the distribution of the M31 halo stars resembles as well both samples of stars from bright dwarfs and the MW halo. On the other hand, the period distribution of the faint dwarfs is shifted to longer periods. In order to estimate quantitatively the similarities between the different distributions, we applied a Kolmogorov–Smirnov test. We find that both halo distributions have a significant likelihood of being drawn from the same distribution as the bright satellites ones: 46% and 99% for the case of M31 and MW. Basically, a 0% probability is given by the comparison with the faint dwarfs samples.
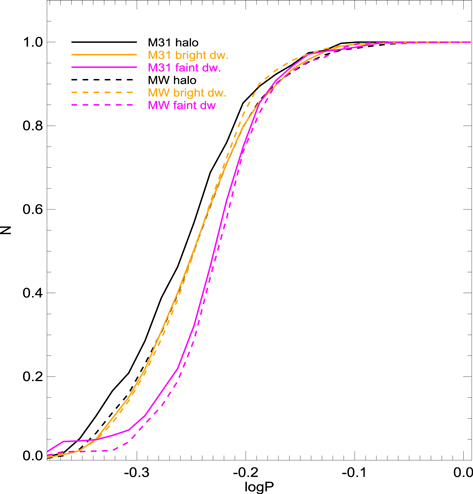
Figure 11. Cumulative period distribution functions for the different samples of RRab-type stars. The samples from the bright dwarfs in M31 and MW look very similar, and similar to the MW halo one. The M31 halo sample has a slightly sharper rise. The two samples from the faint satellites are clearly shifted to longer periods.
Download figure:
Standard image High-resolution imageThese findings strongly support the following scenario:
(i) HASP stars seem ubiquitous in the most massive dwarf galaxies. The fact that today they host a few percent of HASP RRL stars implies that they were significantly enriched at an early epoch ([Fe/H] > −1.5 10 to 13 Gyr ago). This indicates that the dwarf galaxy mass–metallicity relation was in place at an early epoch. (ii) the existence of HASP RRL stars in the inner M31 halo implies that a stellar population as metal-rich as [Fe/H] = −1.5 was present in the systems that took part in forming the halo. This favors massive fragments as halo building blocks, since low-mass dwarf galaxies did not have enough time to chemically evolve to produce the stars that we observe today as HASP stars. Despite the very limited spatial coverage of the M31 halo, our results indicate that the old populations of the M31 and MW halos (represented by their RRL stars), and possibly the formation mechanisms, were similar.
This result is in agreement with theoretical models (Cooper et al. 2010; Tissera et al. 2014), but may appear in contradiction with spectroscopic investigations, which suggest that surviving dwarf galaxies experienced a different chemical evolution and are not suitable building blocks for the halo (e.g., Venn et al. 2004; Vargas et al. 2014). In particular, Vargas et al. (2014) performed a detailed analysis of a large sample of RGB stars in nine satellites of M31, including the three studied here. They concluded that the MW halo could not be formed by dwarf galaxies such as the present-day M31 satellites. In order to understand this apparent discrepancy, one has to take into account that the RGB stars used in the spectroscopic analysis may span a wide age range during which the host galaxy may experience a significant chemical evolution. The analysis presented here focuses on RRL stars because they are exclusively old (>10 Gyr) stellar tracers, and therefore they allow us to infer the properties of the building blocks at the time of their accretion onto the halo.
In order to test whether the different star formation histories of the sample galaxies affected their conclusions, Vargas et al. (2014) divided the purely old galaxies (And I, And III, And V, and And VII) from those hosting intermediate-age populations (And II, NGC 185, and NGC 147),13 showing that the latter present higher mean and peak metallicity, and that neither sample seems representative of the MW halo. On the other hand, RGB stars more metal-rich than HASP stars have been measured even in these low-mass dwarfs not hosting HASPs. Martínez-Vázquez et al. (2016a) investigated the case of the Sculptor dSph galaxy. By comparing the metallicity distribution inferred for the RRL stars with the spectroscopic metallicity distribution of RGB stars, they showed that the latter covers a substantially wider metallicity range. This implies that Sculptor evolved and was able to produce a population of stars young and/or metal-rich enough to show up in the RGB but without a counterpart in the RRL stars. Such late chemical enrichment appears to occur on relatively short timescales, and significant enrichment is produced when the star formation rate drops and is close to vanishing (Pont et al. 2004; Hidalgo et al. 2009).
6. Final Remarks
The structural and chemical properties of the M31 and MW halo are known to be strikingly different, in terms of density profile and mean metallicity (see Gilbert et al. 2012 and references therein). In particular, the mean metallicity of the M31 inner halo is significantly higher ([Fe/H] ∼ −0.5 within 20 kpc; Gilbert et al. 2014) than that of the MW [Fe/H] ∼ −1.6; Carollo et al. 2007). Taken at face value, these properties may indicate a significantly different accretion history and evolution of the MW and M31 halos. Indeed, the inner halo (Ferguson & Mackey 2016, <50 Kpc) of M31 is dominated by the Giant Stellar Stream (GSS) associated with a merger of an early-type system as massive as  (Ibata et al. 2001) and with a strong component as metal-rich as [Fe/H] ∼ −0.5 (Bernard et al. 2015). The satellite systems of the two spirals are also different. On the one hand, the Magellanic Clouds do not have a counterpart in M31, while the MW does not have any dwarf ellipticals, such as NGC 147, NGC 185, or NGC 205.
Nevertheless, if we restrict the comparison to the old population as traced by the RRL stars, the global picture appears much more uniform. This is indicated by the similarities in the period distribution of the RRL stars not only in both the M31 and the MW halos, but also in the corresponding satellite systems. In fact, the HASP RRL stars discussed in this paper, which are powerful tracers of early chemical enrichment, exist in both halos and in the massive dwarf galaxies only.
It is worth noting that all of the RRL data included in panel (a) of Figure 10 is limited to the inner halo only, spanning a distance range from 4 to 35 kpc from the M31 center. This means that the spatial coverage of the M31 halo is sorely incomplete. Future wide-area variability surveys of the M31 halo (and possibly, its disk) would be a giant leap forward to tightly constrain the formation and early evolution of M31.
M.M. would like to dedicate this paper to the memory of his friend Savio. His alternative approach will always be missed. M.M. is also grateful to Annette Ferguson for the useful suggestions. This research has been supported by the Spanish Ministry of Economy and Competitiveness (MINECO) under the grant AYA2014-56795-P. E.J.B. acknowledges support from the CNES postdoctoral fellowship program. G.F. has been supported by the Futuro in Ricerca 2013 (grant RBFR13J716).
Facilities: HST(ACS, WFC3).
Software: ALLFRAME, IDL.
Appendix A: Observing Logs
We present here the complete log of observation for the three galaxies, including both the ACS and the WFC3 cameras for NGC 185 and NGC 147.
Appendix B: Full Light Curves, Mean Properties, and Time Series
We present here the photometry of the variable stars in Table 4 and their mean properties in Table 5.
Table 4. Photometry of the Variable Stars
| MHJDa | F435 |

|
MHJDa | F435 |

|
|---|---|---|---|---|---|
| AndVII-V001 | |||||
| 53903.8139 | 26.655 | 0.320 | 53903.9424 | 26.166 | 0.124 |
| 53903.8224 | 26.836 | 0.170 | 53903.9509 | 26.171 | 0.094 |
| 53903.8311 | 26.614 | 0.147 | 53903.9597 | 26.212 | 0.104 |
| 53903.8397 | 26.765 | 0.164 | 53903.9682 | 26.291 | 0.132 |
| 53903.8751 | 26.543 | 0.140 | 53904.0114 | 26.025 | 0.146 |
Note.
aModified Heliocentric Julian Date of mid-exposure: HJD–2,400,000.Only a portion of this table is shown here to demonstrate its form and content. A machine-readable version of the full table is available.
Download table as: DataTypeset image
Table 5. Mean Properties of the Variable Stars
| Name | R.A. | Decl. | Period (Days) | F435W |

|
F555W |

|
F435W–F555W | Type |
|---|---|---|---|---|---|---|---|---|---|
| AndVII-V001 | 23:26:20.342 | +50:42:22.86 | 0.523 | 26.199 | 1.417 | 25.852 | 1.002 | 0.347 | RRab |
| AndVII-V002 | 23:26:20.747 | +50:42:23.15 | 0.626 | 26.229 | 0.743 | 25.671 | 0.835 | 0.558 | RRab |
| AndVII-V003 | 23:26:21.063 | +50:42:36.31 | 0.733 | 26.030 | 1.287 | 25.561 | 1.047 | 0.469 | RRab |
| AndVII-V004 | 23:26:21.379 | +50:42:34.20 | 0.502 | 26.194 | 1.755 | 26.157 | 0.640 | 0.036 | RRab |
| AndVII-V005 | 23:26:21.389 | +50:42:33.83 | 0.352 | 26.167 | 0.642 | 25.762 | 0.429 | 0.405 | RRc |
Only a portion of this table is shown here to demonstrate its form and content. A machine-readable version of the full table is available.
Download table as: DataTypeset image
Appendix C: Other Variable Stars
Other than RRL stars, a few other candidates have been detected in the three galaxies. Table 6 summarizes their number. A few of them are ACs (see Table 7), discussed in the next section. The other, whose properties are reported in Table 8, have uncertain classification and are presented below.
Table 6. Other Types of Variable Stars Detected in the Three Galaxies
| And VII | NGC 185 | NGC 147 | Total | ||
|---|---|---|---|---|---|
| ACS | 7 | 3 | 1 | 11 | |
| AC | WFC3 | ⋯ | 0 | 0 | 0 |
| total | 7 | 3 | 1 | 11 | |
| ACS | 2 | 1 | 0 | 3 | |
| LPV | WFC3 | ⋯ | 0 | 0 | 0 |
| total | 2 | 1 | 0 | 3 | |
| ACS | 0 | 1 | 4 | 5 | |
| Binary | WFC3 | ⋯ | 0 | 0 | 0 |
| total | 0 | 1 | 4 | 5 | |
| ACS | 8 | 1 | 6 | 15 | |
| Unclass. | WFC3 | ⋯ | 0 | 0 | 0 |
| total | 8 | 1 | 6 | 15 | |
| TOTALACS | 17 | 6 | 11 | 34 | |
| TOTALWFC3 | ⋯ | 0 | 0 | 0 | |
| TOTAL | 17 | 6 | 11 | 34 | |
Download table as: ASCIITypeset image
C.1. Other Helium-burning Variables: ACs and BL Her
A small number of candidate ACs have been detected. In particular, And VII hosts seven of them, while three and one suspected ACs are present in NGC 185 and NGC 147, respectively. Their light curves are shown in Figures 12–14. And VII-V183 and And VII-V199 are bona fide ACs, given the quality of their light curves, which provides reliable period and position on the CMD. The period determination of the other stars does not allow strong constraints on their period to be derived, and therefore their classification remains uncertain. In fact, we cannot exclude that some of them are type II Cepheids.
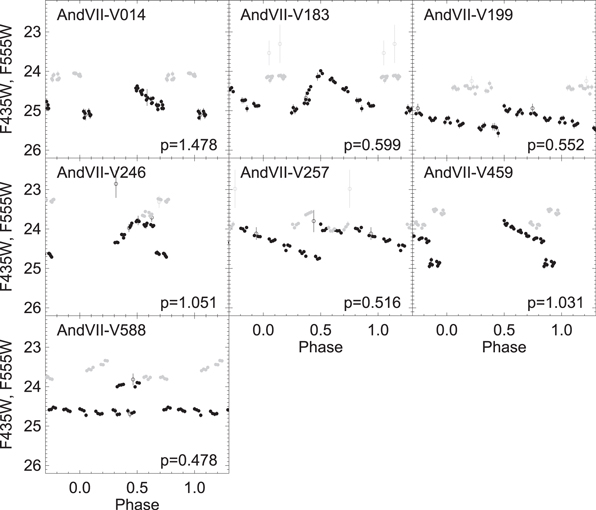
Figure 12. Light curves of the candidate ACs in And VII.
Download figure:
Standard image High-resolution image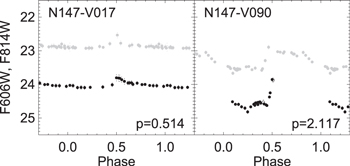
Figure 13. Light curves of the candidate ACs in NGC 147.
Download figure:
Standard image High-resolution image
Figure 14. Light curves of the candidate ACs in NGC 185.
Download figure:
Standard image High-resolution image
Table 7. Position and Properties of Candidate ACs and BL Her Stars
| Name | R.A. (hh:mm:ss) | Decl. (° '' ') | Period (Days) | F606W |

|
F814W |

|

|
Type |
|---|---|---|---|---|---|---|---|---|---|
| And VII | |||||||||
| AndVII-V014 | 23:26:39.466 | +50:43:29.59 | 1.478 | 24.866 | 0.585 | 24.544 | 0.334 | 0.322 | AC? |
| AndVII-V183 | 23:26:39.467 | +50:43:29.59 | 0.599 | 24.523 | 0.838 | 24.537 | 0.001 | 0.015 | AC |
| AndVII-V199 | 23:26:39.467 | +50:43:29.59 | 0.552 | 25.199 | 0.491 | 24.830 | 0.000 | 0.369 | AC |
| AndVII-V246 | 23:26:39.467 | +50:43:29.59 | 1.051 | 24.225 | 0.791 | 24.319 | 1.218 | 0.094 | AC? |
| AndVII-V257 | 23:26:39.467 | +50:43:29.59 | 0.516 | 24.221 | 0.542 | 24.169 | 0.508 | 0.052 | AC? |
| AndVII-V459 | 23:26:39.467 | +50:43:29.59 | 1.031 | 24.437 | 1.142 | 24.347 | 0.947 | 0.090 | AC? |
| AndVII-V588 | 23:26:39.467 | +50:43:29.59 | 0.478 | 24.344 | 0.740 | 24.017 | 0.417 | 0.327 | AC? |
| NGC 147 | |||||||||
| N147-V017 | 0:32:42.986 | +48:22:12.41 | 0.514 | 24.019 | 0.239 | 23.251 | 0.202 | 0.767 | AC? |
| N147-V090 | 0:32:52.610 | +48:22:04.27 | 2.117 | 24.224 | 1.038 | 23.674 | 0.768 | 0.550 | BL Her |
| NGC 185 | |||||||||
| N185-V001 | 0:38:56.940 | +48:26:43.65 | 0.654 | 24.333 | 0.194 | 23.643 | 0.178 | 0.691 | AC? |
| N185-V157 | 0:39:05.063 | +48:25:31.07 | 0.642 | 24.340 | 0.287 | 23.665 | 0.147 | 0.674 | AC? |
| N185-V558 | 0:39:14.847 | +48:25:51.77 | 0.651 | 24.297 | 0.264 | 23.601 | 0.204 | 0.696 | AC? |
Download table as: ASCIITypeset image
Table 8. Position and Tentative Classification of Other Candidate Variable Stars Detected
| Name | R.A. (hh:mm:ss) | Decl. (° '' ') | Period (Days) | F606W |

|
F814W |

|

|
Type |
|---|---|---|---|---|---|---|---|---|---|
| And VII | |||||||||
| AndVII-V153 | 23:26:39.467 | +50:43:29.59 | 9.999 | 99.999 | 9.999 | 99.999 | 9.999 | 9.999 | LPV |
| AndVII-V154 | 23:26:39.467 | +50:43:29.59 | 9.999 | 99.999 | 9.999 | 99.999 | 9.999 | 9.999 | LPV |
| AndVII-V184 | 23:26:39.467 | +50:43:29.59 | 9.999 | 99.999 | 9.999 | 99.999 | 9.999 | 9.999 | Unclass. |
| AndVII-V320 | 23:26:39.467 | +50:43:29.59 | 9.999 | 99.999 | 9.999 | 99.999 | 9.999 | 9.999 | Unclass. |
| AndVII-V355 | 23:26:39.467 | +50:43:29.59 | 9.999 | 99.999 | 9.999 | 99.999 | 9.999 | 9.999 | Unclass. |
| AndVII-V398 | 23:26:39.467 | +50:43:29.59 | 9.999 | 99.999 | 9.999 | 99.999 | 9.999 | 9.999 | Unclass. |
| AndVII-V470 | 23:26:39.467 | +50:43:29.59 | 9.999 | 99.999 | 9.999 | 99.999 | 9.999 | 9.999 | Unclass. |
| AndVII-V558 | 23:26:39.467 | +50:43:29.59 | 9.999 | 99.999 | 9.999 | 99.999 | 9.999 | 9.999 | Unclass. |
| AndVII-V561 | 23:26:39.467 | +50:43:29.59 | 9.999 | 99.999 | 9.999 | 99.999 | 9.999 | 9.999 | Unclass. |
| AndVII-V589 | 23:26:39.467 | +50:43:29.59 | 9.999 | 99.999 | 9.999 | 99.999 | 9.999 | 9.999 | Unclass. |
| NGC 147 | |||||||||
| N147-V020 | 00:32:43.337 | +48:21:48.73 | 99999 | 99.999 | 9.999 | 99.999 | 9.999 | 9.999 | Ecl. Bin. |
| N147-V027 | 00:32:44.194 | +48:22:34.45 | 99999 | 99.999 | 9.999 | 99.999 | 9.999 | 9.999 | Ecl. Bin. |
| N147-V058 | 00:32:48.231 | +48:22:32.53 | 99999 | 99.999 | 9.999 | 99.999 | 9.999 | 9.999 | Ecl. Bin. |
| N147-V115 | 00:32:54.029 | +48:23:38.81 | 99999 | 99.999 | 9.999 | 99.999 | 9.999 | 9.999 | Ecl. Bin. |
| N147-V048 | 00:32:47.349 | +48:22:51.52 | 99999 | 99.999 | 9.999 | 99.999 | 9.999 | 9.999 | Unclass. |
| N147-V086 | 00:32:52.181 | +48:21:26.87 | 99999 | 99.999 | 9.999 | 99.999 | 9.999 | 9.999 | Unclass. |
| N147-V104 | 00:32:53.303 | +48:21:41.20 | 99999 | 99.999 | 9.999 | 99.999 | 9.999 | 9.999 | Unclass. |
| N147-V105 | 00:32:53.366 | +48:21:42.62 | 99999 | 99.999 | 9.999 | 99.999 | 9.999 | 9.999 | Unclass. |
| N147-V157 | 00:32:59.183 | +48:22:34.18 | 99999 | 99.999 | 9.999 | 99.999 | 9.999 | 9.999 | Unclass. |
| NGC 185 | |||||||||
| N185-V394 | 00:39:10.293 | +48:27:17.86 | 9.999 | 99.999 | 9.999 | 99.999 | 9.999 | 9.999 | Unclass. |
| N185-V507 | 00:39:13.096 | +48:25:08.79 | 9.999 | 99.999 | 9.999 | 99.999 | 9.999 | 9.999 | Unclass. |
| N185-V655 | 00:39:20.115 | +48:26:23.75 | 9.999 | 99.999 | 9.999 | 99.999 | 9.999 | 9.999 | Unclass. |
| N185-V424 | 00:39:10.893 | +48:24:30.10 | 9.999 | 99.999 | 9.999 | 99.999 | 9.999 | 9.999 | Ecl. Bin. |
| N185-V388 | 00:39:10.198 | +48:25:05.57 | 9.999 | 99.999 | 9.999 | 99.999 | 9.999 | 9.999 | LPV |
Download table as: ASCIITypeset image
In the case of NGC 147, two stars are too bright to be RRL stars. One of them, N147-V017, has a very small amplitude, and may be a case of extreme blend. Moreover, the period and the light-curve shape of N147-V090 are compatible with the properties of a BL Her star (see Soszyński et al. 2015, their Figure 4).
NGC 185 hosts three variable stars about 1 mag brighter than the HB. The three of them are characterized by low amplitude and a period around 0.65 days.
The paucity of ACs in the three systems may be a consequence of different effects. First, there is a spatial sampling problem, especially in the case of NGC 147 and NGC 185, as the pointings are relatively far from their center. Second, there is a metallicity effect. ACs are known to form only in metal-poor environments (Z < 0.006; Fiorentino et al. 2006) and can be the evolution of intermediate-age single stars or the process of primordial binary stars rejuvenated through a Blue Straggler phase. The single star channel appears unlikely in the three galaxies, either because they do not host stars young enough to evolve as ACs (NGC 185 and most likely And VII) or because the metallicity is too high at that age (NGC 147). The detected ACs are most likely descending from primordial binary stars from the oldest and most-metal-poor component.
C.2. Eclipsing Binaries
One star in NGC 185 (N185-V424) and four in NGC 147 (N147-V020, N147-V027, N147-V058, N147-V115) are candidate eclipsing binary systems. The analysis of the time series shows the presence of a minimum light compatible with an eclipse. Given that only one partial event is sampled, it is not possible to determine the period.
C.3. Long-period Variables
Two stars in And VII are candidate long-period variable stars (AndVII-V153, AndVII-V154). One star in NGC 185 (N185-V424) shows hints of long-term variability, in particular a slow increase of luminosity with time. Nevertheless, we note that its position on the CMD (see Figure 4) is unusually faint for such type or variable stars.
C.4. Unclassified Variable Stars
Few other stars show significant variability, but their classification and the determination of the pulsation parameters were not possible with the current data. Namely, these are eight stars in And VII (AndVII-V184, AndVII-V320, AndVII-V355, AndVII-V398, AndVII-V470, AndVII-V558, AndVII-V561, AndVII-V589), five in NGC 147 (N147-V048, N147-V086, N147-V104, N147-V105, N147-V157), and three in NGC 185 (N185-V394, N185-V507, N185-V655).
Footnotes
- ∗
Based on observations made with the NASA/ESA Hubble Space Telescope, obtained at the Space Telescope Science Institute, which is operated by the Association of Universities for Research in Astronomy, Inc., under NASA contract NAS 5-26555. These observations are associated with programs #10430 and #11724.
- 9
The images from the sixth visit of the program were not included in the current analysis due to problems during the data reduction process.
- 10
Visual inspection of the CMD revealed a residual zero point between the ACS and WFC3 photometry of NGC 185. Since we could not identify the origin of the shift, we rescaled by hand the WFC3 to the ACS using the HB magnitude level. This correction does not affect the period nor the amplitude determination at all.
- 11
Whenever the data had been collected in the F606W pass bands, the amplitude were corrected by dividing by the factor 0.92, following Fiorentino et al. (2010).
- 12
- 13
It should be noted that they included NGC 185 among the galaxies with an intermediate-age population, though later on Geha et al. (2015) showed that this galaxy hosts predominantly old populations.